
Abstract
The office chair is one of the most important sittings in the office, life and learning process. When people use uncomfortable office chairs, it can have a negative impact on people’s work efficiency and health. The body pressure distribution of the office chair is one of the most common objective measures index of office chair comfort. Therefore, in order to improve the comfort of the office chair, it is necessary to study the differences in the pressure distribution and the differences in comfort evaluation of people with different BMI. The Pliance pressure test system was used to collect the seat pressure and contact area of 18 subjects with different BMI, and a subjective score for office chair of each subject was recorded. Through difference analysis, we found that the mean pressure and mean contact area of subjects with different BMI were significantly different (P < 0.05) and positive correlation were found for mean pressure and BMI, for mean contact area and BMI. But no correlation were found for BMI and subjective comfort scores (p > 0.05). According to the experimental data, the pressure distribution diagram was drawn, the pressure distribution characteristics of subjects with different BMI were summarized.
You have full access to this open access chapter, Download conference paper PDF
Keywords
1 Introduction
Nowadays, working in an office chair is ubiquitous. Approximately three-quarters of all employees in industrialized countries now have jobs that require working in a sitting position. A good seat can not only properly support for hip and distribute the weight of the human body, but also improve work efficiency. An increasing amount of time is spent seated, especially in office environments, where sitting comfort are increasingly important due to the prevalence of musculoskeletal disorders [1].
At present, the methods for measuring the comfort of the office chair seat surface mainly include objective measurement and subjective evaluation. In the literature, various objective methods (e.g. pressure measurements, measurements of posture, EMG etc.) can be used to quantify the subjective comfort/discomfort of an office chair [2]. Objective methods have the advantage of being less time consuming, less dependent on a large number of subjects and less prone to measurement error [3]. The seat surface is the main interface between the user and the seat, and is an important part that affects the comfort of the user. The body pressure distribution of the office chair is one of the most common objective measures of office chair comfort [4].
However, technical methods to objectively determine sitting comfort/discomfort are always indirect and, at best, can provide only an indication of a chair user’s feeling of comfort/discomfort. The comfort/discomfort of the seat is based on subjective feelings and is difficult to quantify. Subjective assessment is possible to gain an indication of the level of sitting comfort and discomfort. Vergara and Page reported that subjective evaluation is the effective way to determine changes in comfort and pain [5].
Chen Yuxia, Zhou Min, Hou Jianjun and others used the method which combined pressure distribution measurement and subjective comfort evaluation to study the relationship between objective data and subjective comfort evaluation of sofa and seat respectively. The factors affecting the comfort of sofa and chair are analyzed. Tianyi [8] also used the method which combined body pressure distribution and subjective evaluation to study the influence of sitting posture on seat comfort. This proves the effectiveness of the combination of subjective and objective evaluation.
At present, the distribution ratio of Chinese adult BMI is 1 (thin): 5 (normal): 4 (fat). The distribution of the seat surface pressure of people with different BMI is different. The pressure distribution of fat people is relatively uniform, and the highest pressure values of thin people are seen at the hip ischial tuberosity [9]. It can be seen that the individual BMI difference has an effect on the seat pressure distribution [10]. Therefore, in order to improve the comfort of the office chair, it is necessary to further study the difference in the pressure distribution of people with different BMI.
Based on the above analysis, the combined method of subjective and objective was used in this study. The pressure test system was used to measure the seat surface pressure, and the seat surface was subjectively evaluated for comfort. The experimental data was analyzed for differences. This study will provide reference and basis for the office chair seat surface design to improve the comfort of the office chair.
2 Method
2.1 Experimental Design
In this study, according to the Chinese BMI index classification criteria, 18 subjects of three types were recruited. They were divided into thin group (BMI < 18.5), normal group (18.5 ≤ BMI < 23.9) and fat group (BMI ≥ 24) respectively. The most common office chair with moderate seating hardness was selected as the experimental sample. The subjects provided their evaluation on comfort of the seat surface after sitting for 20 min. The subjective comfort experience evaluation was scored by using a 5-level comfort meter (1 point - very uncomfortable, 2 points - uncomfortable, 3 points - general, 4 points - comfortable and 5 points - very comfortable). Then, the subjects sit in the office chair in accordance with the requirements of the “reference sitting posture [11]”. The reference seating posture is as follows:
-
The sole of the foot placed on the floor;
-
The foot forms an angle of approximately 90° with the lower leg;
-
The lower leg is approximately vertical;
-
The lower leg forms an angle of approximately 90° with the thigh;
-
The thigh is almost horizontal;
-
The thigh forms an angle of approximately 90° with the trunk;
-
The trunk is erect.
Subjects were required to be in contact with the office chair only by buttocks and thighs, try to ensure that the rest of the body and the office chair is not in contact to reduce the influence of extraneous factors on the pressure distribution test of the seat surface. Finally, the Pliance pressure test system of German Novel Company was used to collect pressure distribution data of each subject for 30 s, and 15 s stable pressure distribution data was selected to extract mean pressure values, peak pressure values and mean contact area. One-way analysis of variance was used to compare mean pressure, peak pressure and mean contact area of people with different BMI, and the correlation between BMI and seat comfort was determined based on Spearman correlation analysis (Fig 1).

The reference seating posture
2.2 Subject
In this study, according to the Chinese BMI index classification criteria, 18 subjects of three types were recruited. They were divided into thin group (BMI < 18.5), normal group (18.5 ≤ BMI < 23.9) and fat group (BMI ≥ 24) respectively. All subjects were required healthy, with no spine and hip related medical history and experimented with good physical and mental condition. All subjects provided written informed consent prior to participation in this study. Subjects’ information see Table 1.
2.3 Main Apparatus
Pressure Test System.
The body pressure distribution test was carried out by the Pliance body pressure test system (see Fig. 2) of Germany Novel. The computer software used with the system can visually display 2D and 3D color pictures of pressure distribution. And the pressure values of each sensor is contained in the picture (see Fig. 3).

The main hardware of Pliance body pressure measure system

2D (left) and 3D (right) color pictures of pressure distribution. (Color figure online)
Office Chair.
The seat surface hardness of 15 office chair were measured for selecting office chair by the Shore F Durometer (a device for measuring the surface hardness of soft materials such as sponges, see Fig. 4). We found that the seat surface hardness of 11 office chair is mainly concentrated between 35HD and 42HD, and the mean hardness is 40.18HD. So the office chair with 40HD and adjustable height was selected for experiment (see Fig. 5).

Shore F durometer

Office chair
2.4 Task and Procedure
-
1.
Each subject was informed about the study and gave a written informed consent,
-
2.
Before the test, the subjects were informed of experiment purpose, experiment contents and way of testing, and assistance was given to them to get familiar with the subjective comfort rating scale.
-
3.
The gender, age, and height and weight of the subjects were record.
-
4.
The subjects provided their evaluation on comfort of seat surface after sitting for 20 min.
-
5.
Adjust the seat surface of the office chair to the appropriate height. The subjects sat in the office chair in accordance with the requirements of the “reference sitting posture” (see Fig. 6) while back does not contact with the backrest without using the armrest (hands on their lap).
Fig. 6. 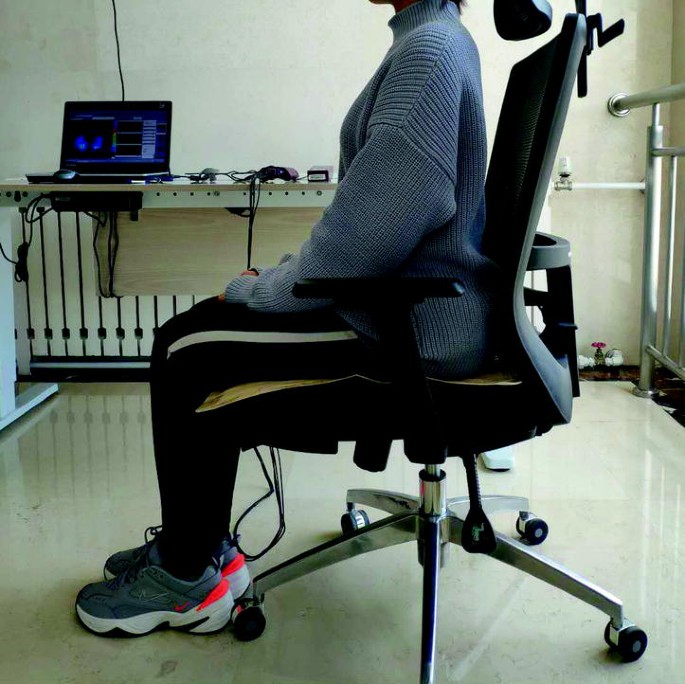
The experimental scene. The subject kept the “reference sitting posture” while back does not contact with the backrest without using the armrest (hands on their lap) for 30 s. Measure the pressure distribution during this period.
-
6.
Contact pressure and contact area between chair seat and buttock was measured within 30 s.

2.5 Data Analysis
Subjective scores of different BMI subjects were counted. Peak pressure values, mean pressure values and mean contact area of the sensors during the measurements were extracted from the Novel software. One-way analysis of variance was used to determine whether there was a difference between pressure distribution and BMI. Spearman correlation analysis was used to determine correlation between subjective comfort scores and BMI, mean pressure and BMI, peak pressure and BMI, mean contact area and BMI. The significance was determined at a 0.05 level.
3 Results
Significant differences were found for mean pressure and mean contact area of people with different BMI (p < 0.05). See Table 2 for significant results. Positive correlations were found for mean pressure and BMI, for Mean contact area and BMI (see Table 3).
3.1 Mean Pressure
Mean pressure of thin group was the lowest (4.02 kPa). Mean pressure of fat group was the highest (5.20 kPa). Mean pressure of normal group was somewhere between the two (4.71 kPa). And positive correlations were found for mean pressure and BMI (R > 0.8, p < 0.05). In Fig. 7, the distribution of mean pressure is shown. And the trend of mean pressure with BMI can be seen from the dotted line in the figure. So, mean pressure increases with increasing BMI.

Mean pressure scatter diagram of 18 subjects. And the dotted line represents the trend line of mean pressure with BMI
3.2 Peak Pressure
No significant differences were found for peak pressure of people with different BMI (p > 0.05). And no correlations were found for peak pressure and BMI (p > 0.05). It can be seen from Fig. 8 that with the increase of BMI, there is no obvious change trend of peak pressure.

Peak pressure scatter diagram of 18 subjects. And the dotted line represents the trend line of peak pressure with BMI
3.3 Mean Contact Area
The mean contact area of the fat group was the largest (1164.48 cm2). The mean contact area of the thin group was the smallest (922.38 cm2), and the mean contact area of the normal group was between the two (1011.42 cm2). Positive correlations were found for mean contact area and BMI (R > 0.8, p < 0.05). It can be seen from Fig. 9 that as the BMI increases, the mean contact area has a significant increase trend. The higher the BMI is, the larger the volume of the subject is. So the contact area between the hip and the office chair is larger.

Mean contact area scatter diagram of 18 subjects. And the dotted line represents the trend line of mean contact area with BMI
3.4 Subjective Score
No significant correlations were found for subjective scores and BMI (p > 0.05). At present, only one office chair with moderate hardness is selected in the experiment. It is possible that this office chair has met the comfort requirements of all the subjects. And López-Torres [12] reported comfort is an extremely complex concept that involves the absence of discomfort and the presence of a series of positive perceptions. Some participants in the experience said that this office chair did not cause discomfort, so they thought that this office chair is comfortable, which may lead to no difference in subjective scores, or there was indeed no significant correlation between subjective score and BMI. Studies have shown that subjective comfort evaluation may take at least 1 h to distinguish the change of comfort [13], and the experience of this experiment is only 20 min, which may not be enough to get an effective subjective score in a short time. Therefore, it is necessary to carry out experiments with longer experience in the future, so as to obtain accurate subjective scores.
3.5 Pressure Distribution
The difference in pressure distribution between subjects with different BMI can be clearly seen from Figs. 10, 11 and 12. The seat contact area of thin subject is the smallest, and the highest pressure values are seen at the hip ischial tuberosity. The seat contact area of normal subject is slightly larger than that of thin subject, and larger pressure values are distributed near the hip ischial tuberosity. The seat contact area of fat subject is the largest, and larger pressure values are also distributed near the ischial tuberosity, but the area is larger than normal, and the pressure distribution of fat subject is more evenly distributed.

Typical example of pressure distribution in thin group.

Typical example of pressure distribution in normal group.

Typical example of pressure distribution in fat group.
4 Conclusion
Research shows [3] that the pressure distribution of car seats is correlated with subjective score, so it can be hypothesized that the same conclusion may hold for other seats (like office chair) as well, although the association between pressure distribution and (dis)comfort in other seats is yet to be determined. And the seating pressure distribution of groups with different BMI was different. Therefore, people with different BMI have different feelings on the comfort level of the same office chair. Li Juan reported there were different pressure distribution in different hardness of the seat surface. This study found that the mean pressure of different BMI groups is different. Therefore, in order to improve the comfort of office chairs, it is necessary to design office chairs with different seating hardness for people with different BMI.
References
Zemp, R., Taylor, W.R., Lorenzetti, S.: Seat pan and backrest pressure distribution while sitting in office chairs. Appl. Ergon. 53, 1–9 (2016). https://doi.org/10.1016/j.apergo.2015.08.004
Zemp, R., Taylor, W.R., Lorenzetti, S.: Are pressure measurements effective in the assessment of office chair comfort/discomfort? Rev. Appl. Ergon. 48, 273–282 (2015). https://doi.org/10.1016/j.apergo.2014.12.010
De Looze, M.P., Kuijt-Evers, L.F.M., Van DieN, J.: Sitting comfort and discomfort and the relationships with objective measures. Ergonomics 46(10), 985–997 (2003). https://doi.org/10.1080/0014013031000121977
Zhang, Z., Yuan, Q., Xu, Z., Huang, S., He, Y.: A study on the ride comfort of vehicle seats based on body pressure distribution. Automot. Eng. 36(11), 1399–1404 (2014)
Vergara, M., Page, A.: Relationship between comfort and back posture and mobility in sitting-posture. Appl. Ergon. 33(1), 1–8 (2002). https://doi.org/10.1016/s0003-6870(01)00056-4
Chen, Y., Shen, L.: Discuss about the evaluation method on sofa comfort degree. J. Northwest Forest. Univ. 22(02), 179–183 (2007). https://doi.org/10.3969/j.issn.1001-7461.2007.02.046
Min, Z.: The study on the interface pressure distributions and the temperature between the testee and the seat. Doctoral dissertation, Nanjing Forestry University (2007). https://doi.org/10.7666/d.y1196137
Tianyi, H., Liming, S.: Comfort and supporting ability of waist and haunch by using office chair in forward sitting position. J. Anhui Agric. Univ. 41(1), 173–178 (2014)
Lingling, H., Zuoxin, L., Jilei, Z.: The study of sitting pressure distribution for subjects with different BMI. Furniture & Interior Design (6) (2015)
Xinzhu, H.: Research on individual differences of the seat surface comfort effect. Doctoral dissertation, Beijing Institute of Technology (2015)
BS ISO 24496:2017 Office furniture-Office chair-Methods for the determination of dimensions
López-Torres, M., Porcar, R., Solaz, J., Romero, T.: Objective firmness, average pressure and subjective perception in mattresses for the elderly. Appl. Ergon. 39(1), 123–130 (2008). https://doi.org/10.1016/j.apergo.2006.11.002
Carcone, S.M., Keir, P.J.: Effects of backrest design on biomechanics and comfort during seated work. Appl. Ergon. 38(6), 755–764 (2007). https://doi.org/10.1016/j.apergo.2006.11.001
Li, J., Xu, B., Lian, J., Wang, C.: Seat comfort characterization by body—seat interface pressure distribution. Mech. Sci. Technol. Aerosp. Eng. 33(9), 1298–1303 (2014). https://doi.org/10.13433/j.cnki.1003-8728.2014.0904
Acknowledgments
This research is supported by 2016 revised national standard project plan project (20162676-T-469) and China National Institute of Standardization through the “special funds for the basic R&D undertakings by welfare research institutions” (522017Y-5278 and 522016Y-4488).
Author information
Authors and Affiliations
Corresponding author
Editor information
Editors and Affiliations
Rights and permissions
Copyright information
© 2019 Springer Nature Switzerland AG
About this paper

Cite this paper
Hong, P., Li, Y., Hu, H., Cai, M. (2019). Research on Body Pressure Distribution of Office Chair with Different BMI. In: Duffy, V. (eds) Digital Human Modeling and Applications in Health, Safety, Ergonomics and Risk Management. Human Body and Motion. HCII 2019. Lecture Notes in Computer Science(), vol 11581. Springer, Cham. https://doi.org/10.1007/978-3-030-22216-1_5
Download citation
DOI: https://doi.org/10.1007/978-3-030-22216-1_5
Published:
Publisher Name: Springer, Cham
Print ISBN: 978-3-030-22215-4
Online ISBN: 978-3-030-22216-1
eBook Packages: Computer ScienceComputer Science (R0)