
Abstract
One of the common problems among preschool children is attention ability development. It is important to detect and identify earlier the attention problems which may minimize the harmful impact of childhood disorders. The purpose of this research is to predict and analyze the attention levels of children aged 4–7. Using parental report or subjective report to analyze the children’s psychological dimensions of temperament is a common approach for temperament research, but it may be bias. Electroencephalography (EEG) is a method to illustrate the brain electrical activity. We proposed a Neurofeedback Technology (NFT) system to amalgamate the collection of EEG signals data and Behavior Style Questionnaire (BSQ) for child temperament data by applying k-means algorithm, an Artificial Intelligence (AI) unsupervised machine learning, clustering analysis method, to observe children’s attention levels. The experimental results not only infer that the value of temperament with EEG classification could be consistent, but also provide a valid way to classify attention levels in specific time period. The combination of the parental subjective report with EEG data demonstrates a novel and valuable approach for resolving child attention problems. The results facilitate earlier identification of attention problems and support better parent-child understanding and interactions.
1 Introduction
One of the common problems among preschool children is attention ability development. Inattention among preschoolers may cause a variety of alternatives or co-existing conditions, such as Attention-deficit/Hyperactivity Disorder (ADHD), language disorders, low intellectual functioning, or other forms of problems. It is important to detect and identify earlier the attention problems and doing so may minimize the harmful impact of childhood disorders [2, 11, 13, 17, 22].
The purpose of this research is to predict and analyze the attention levels of children who are 4–7 years old. Using parental report or subjective report to analyze the children’s psychological dimensions of temperament is a common approach for temperament research [1, 18]. However, parental memory bias, contrast effects, and the possibly different understanding of the questions by parent or caregiver are the limitation of this approach [10].
When a brain is functioning, the brain nerve cells continually having electrical discharge activity, forming brain waves. Electroencephalography (EEG) is a method to illustrate the brain electrical activity. It is a very small signal to be observed on any instruments. EEG measures the voltage changes that are caused due to the ionic movement within the neurons of the brain [5, 7, 8, 12, 24]. BRAINLINK is a tool that works just like a simple EEG based brain-computer interface, analyzing and classifying EEG signals with the help of a neural network [6].
We proposed a Neurofeedback Technology (NFT) system to amalgamate the collected data of EEG signals data and Behavior Style Questionnaire (BSQ) for child temperament data by applying Artificial Intelligence (AI) clustering analysis method, k-means algorithm, to observe children’s attention levels. K-means clustering as one of the simplest unsupervised machine learning algorithms is able to classify similar data points together and discover underlying patterns [9, 16]. The EEG data provide valuable and reliable information while analyzing children’s attention levels with the outcomes of parental reports. Combining the subjective report with EEG data for analysis produces a valuable and reliable approach for children’s attention levels. The experimental results not only infer that the value of temperament with EEG classification could be consistent, but also provide a valid way to classify attention levels in specific time period. The results facilitate earlier identification of attention problems and support better parent-child understanding and interactions.
2 Literature Review
With the development of information technology and the rise of artificial intelligence, the 21st century is called the “century of the brain” [19]. Neurofeedback technology has become one of the new innovative technologies. We apply the Research Fronts of the Essential Science Indicators (ESI) database developed by Clarivate Analytics [4] to explore trends in the field of neurofeedback (shown in Fig. 1). The information selected for this research is that from 1990/01/01 to 2018/12/15, obtaining 4,723 highly cited papers in the field of neurofeedback. Leading papers can help to distinguish the most influential academic papers, while at the same time uncovering breakthrough research directions in a subject area, including the field of neuroscience (40.77%, 1,926), biomedical engineering (20%, 1,373), computer science artificial intelligence (10.35, 489), recovery (10%, 473), clinical neuropathy (8.7%, 411), Electrical Engineering (8.32%, 393), Interdisciplinary Science (6.183%, 292), Psychology (5.844%, 276), Mathematical Computer Biology (5.082%, 240) and related papers on interdisciplinary applications in computer science (3.557%, 168).

Trends in the field of neurofeedback
An EEG signal is measured in the range of micro volts (µV). EEG measures the voltage changes that are caused due to the ionic movement within the neurons of the brain. EEG signals are divided into different types of signals based on the frequency of the signal: delta (0.5–4 Hz), theta (4–7 Hz), alpha (8–15 Hz), beta (13–30 Hz), and gamma (30–200 Hz). Table 1 shows the EEG band names, frequency range (Hz) and activity status [5, 7, 8, 12, 24].
The study of child temperament includes psychological and physiological approaches, and these approaches influence how researchers classify and interpret child temperament. Using parental report or subjective report to analyze the children’s psychological dimensions of temperament is so far a common approach for temperament research [1, 18]. By answering the temperament questionnaires, parents or caregivers provide their perspective and observation on child behavior or reaction under numerous real situation. However, parental memory bias, contrast effects, and the possibly different understanding of the questions by parent or caregiver are the limitation of such an approach [10]. We employ and modify the child temperament survey and produce Behavior Style Questionnaire (BSQ) [20, 21]. A total of 72 BSQ survey are created (Table 2).
On the other hand, the behavioral observation and physiological measures as physiological approaches are developed in modern research. Behavioral observation executed in a controlled and independent laboratory could be more objective than parental report. However, the restriction of time and space, and the cost of the experiment are relatively high. Physiological measures include electroencephalographic (EEG), autonomic measures and neuroendocrine measures. EEG is a relatively noninvasive measure among physiological measures, and is able to trace the central brain activity by event-related potentials (ERPs). Since the limitation of recording children’s EEG and immature possibility of children’s ERP components, combining the subjective report or behavioral observation with EEG data for analysis could be a valuable and reliable approach in temperament research [3, 10].
In this research, we focus on predicting and analyzing the attention levels of 4–7 year-old children. The attention span/persistence is defined as the “capacity for attentional focusing and control as basis for voluntary behavior including persistence”, which is related to effortful control and distractibility. The effortful control includes attentional control and inhibitory control that the former is about “the capacity to maintain attention on tasks as well as to shift attention when desired”, and the latter is “the capacity to plan and to suppress inappropriate action” [14, 15, 23].
K-means clustering as one of the simplest unsupervised machine learning algorithms is able to classify similar data points together and discover underlying patterns [9, 16]. We adopt AI clustering analysis method, k-means algorithm, to cluster and observe children’s attention levels. The novelty of this research is its feature engineering, adopting NFT combined with BSQ. Another one is the combination of these two features by using AI clustering to discovery the consistency in terms of children’s cognitive reactions.
3 Research Method
The proposed NFT system combines two kinds of data, EEG signal data and the temperament BSG data. Figure 2 shows the NFT system architecture and process. The system includes 5 process stages, which are data acquisition, data collection, data storing, data analytics, and data visualization. We follow Institutional Review Board (IRB) regulations for human subjects research ethics. Parents and young children are volunteers for the experiment.

The proposed NFT system process and architecture
-
a.
In the data acquisition and the data collection stages, parents fill in the BSQ survey whereas children play games and wear EEG. A head-mounted brainwave detecting instrument is constructed to collect the EEG signals. We use a tool called BRAINLINK, shown in Fig. 3, that works just like a simple EEG based brain-computer interface – it analyzes and classifies EEG signals with the help of a neural network. EEG records the brain’s spontaneous electrical activity over a short period of time. In our research, there is only a two-minute recording of EEG data for each case.
Fig. 3. 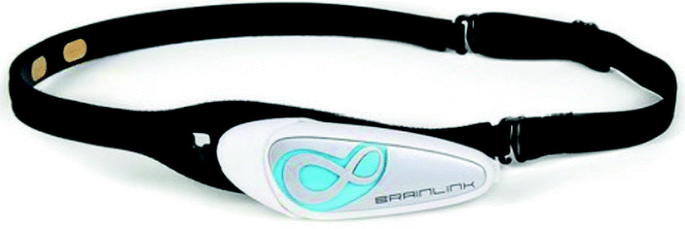
Head-mounted brainwave detecting instrument (BrainLink)
-
b.
In the data storing stage, the EEG data store records in the EEG data files (.bdf files) and BSQ records in excel.
-
c.
In the data analytics stage, AI unsupervised learning, k-means algorithm, is applied to analyze children’s attention levels. K-means clustering is one of the simplest unsupervised machine learning algorithms. The algorithm classifies similar data points together and discover underlying patterns. To achieve this objective, K-means looks for a fixed number (k) of clusters in a dataset. We combine the EEG data and BSQ survey data for better parent-child understanding and interactions.
-
d.
What follows is IBM SPSS Modeler for data analytics and visualization.

4 Result Analysis
A total of thirty children, aged 4–7 years old, start the trial of wearing EEG head band while their parents do the BSQ survey. Table 3 shows examples of BSQ questions, relationship with the child temperament, and the means for the BSG survey questions. The Likert scale, which falls under our definition of a survey scale, is a 7-point scale (1 = Never like this, 2 = rarely such, 3 = even so, 4 = sometimes like this, 5 = often like this, 6 = often this is, 7 = Always like this).
After parents fill in seventy-two BSQ questions, the responses are stored in Excel. We compile the BSQ responses with child temperament. Examples of results are shown in Fig. 4.

Examples of results for BSQ questions
When parents fill in BSQ survey, young children wear EEG head band and play games. EEG, the spontaneous electrical activity, is recorded over a short period of time. The data are collected at a sampling frequency close to 1 kHz for every second with 512 EEG band data set collected. In our example, about 2 min, which gives a total of 61,440 EEG band data set collected in each sample. EEG produces brain band data set with attention and relaxation value. We pre-process the EEG band data set and employ the average of the EEG data set in each sample.
Figure 5 shows the attention and relaxation reference scale for the examples of EEG data. The horizontal axis refers to the child samples and the vertical axis represents the attention and relaxation reference scale. As shown in Fig. 5, the solid blue line represents the individual average attention reference scale, while the dotted gray line represents the group average attention reference scale. The solid red line represents the individual average relaxation reference scale, while the dotted orange line represents the group average relaxation reference scale. Between the individual average reference scale and the group average reference scale, the attention scale is lower than the relaxation reference scale.

Examples of attention and relaxation value
BSQ data and EEG data are integrated as the experimental input dataset. Unsupervised learning k-means clustering algorithm is used to cluster the input dataset. The k-means algorithm is computed using an IBM SPSS Modeler. We have trailed the clustering for 3-classes, 4-classes and 5-classes. However, the results for 4-classes seemed more suitable for the identification of attention and relaxation levels. The results for 4-classes are summarized in Table 4. The classification is done for 4 classes, including class-1, class-2, class-3, and class-4. Class-2, of ten children, shows lower attention and relaxation levels. Class-4, of two children, has the highest attention and relaxation levels.
In the temperament data part, class-4 has the highest approaching, activity amount, attention distraction and mood nature. Class-2 has the lowest reaction threshold. The experimental results infer the consistency in the value of temperament with EEG classification, and a valid approach for classifying attention levels in specific time period.
5 Conclusions
This research proposes an NFT system which has been developed with the objective of predicting and analyzing children’s attention levels. The combination of the parental subjective reports with EEG data has been demonstrated as a novel and valuable approach for resolving problems of child attention levels. Unsupervised machine learning k-means algorithm reveals to be a useful and effective technique for data cluster analysis. The experimental results that demonstrated the temperament activities, including reaction strength, approaching (avoidance), persistence, reaction threshold, activity amount, regularity, adaptability, attention distraction, and mood nature, can be identified and EEG data that classified the attention and relaxation value in specific time period can be asserted. The contribution of this paper is to find implicit clusters of children who might have hidden cognitive disorders. One of novelties of this research is its feature engineering, adopting NFT combined with BSQ. Another one is the discovery of clusters indicating consistency between these two features in terms of childrens’ cognitive reactions. The discovery is practically valuable, because finding childrens’ cognitive disorder in their early stage is very difficult.
For further research, we would like to extend the predicting and analyzing of the attention levels to preteens, i.e. children that are 8–11 years old. Most preteens show great gains in their cognitive development and mark a growth spurt—physically, emotionally, and mentally. They are in child developmental milestones. We are interested to observe not only attention levels, but also their creativity. Creativity is especially important for preteens because together with their mood, it facilitates their ability of expression. Moreover, creativity fosters mental growth in preteens by providing opportunities for new ways of thinking and problem-solving.
References
Carey, W.B., McDevitt, S.C.: Revision of the infant temperament questionnaire. Pediatrics 61(5), 735–739 (1978). https://doi.org/10.1037/t05932-000
Capsi, A., Silva, P.A.: Temperamental qualities at age three predict personality trait in young adulthood: longitudinal evidence from a birth cohort. Child Dev. 66(2), 486–498 (1995). https://doi.org/10.2307/1131592
Cheng, S.-C., Cheng, Y.-P., Huang, C.-H., Huang, Y.-M.: Exploring the correlation between attention and cognitive load of students when attending different classes. In: Wu, T.-T., Huang, Y.-M., Shadieva, R., Lin, L., Starčič, A.I. (eds.) ICITL 2018. LNCS, vol. 11003, pp. 205–214. Springer, Cham (2018). https://doi.org/10.1007/978-3-319-99737-7_21
Clarivate Analytics, Essential Science Indicators. https://clarivate.com.tw/products/essential-science-indicators/
Desai, J.: Electroencephalography (EEG) Data Collection and Processing through Machine Learning, University of Arkansas, Theses and Dissertations (2014)
Felzer, T., Freisleben, B.: BRAINLINK: a software tool supporting the development of an EEG-based brain-computer interface. Proc. METMBS 2, 329–335 (2002)
Heilmeyer, F.A., Schirrmeister, R.T., Fiederer, L.D., Volker, M., Behncke, J., Ball, T.: A large-scale evaluation framework for EEG deep learning architectures. In: 2018 IEEE International Conference on Systems, Man, and Cybernetics (SMC), pp. 1039–1045. IEEE (2018). https://doi.org/10.1109/smc.2018.00185
Hegde, N.N., Nagananda, M.S., Harsha, M.: EEG signal classification using k-means and fuzzy c means clustering methods. Int. J. Sci. Technol. Eng. 2(1), 1–5 (2015)
Kanungo, T., Mount, D.M., Netanyahu, N.S., Piatko, C.D., Silverman, R., Wu, A.Y.: An efficient k-means clustering algorithm: analysis and implementation. IEEE Trans. Pattern Anal. Mach. Intell. 24(7), 881–892 (2002). https://doi.org/10.1109/TPAMI.2002.1017616
Mathewson, K.J., Miskovic, V., Schmidt, L.A.: Individual differences in temperament: definition, measurement, and outcomes. In: Ramachandran, V.S. (ed.) Encyclopedia of Human Behavior (Second Edn.), pp. 418–425. Academic Press, San Diego (2012). https://doi.org/10.1016/b978-0-12-375000-6.00203-2
Mahone, E.M., Schneider, H.E.: Assessment of attention in preschoolers. Neuropsychol. Rev. 22(4), 361–383 (2012). https://doi.org/10.1007/s11065-012-9217-y
Orhan, U., Hekim, M., Ozer, M.: EEG signals classification using the k-means clustering and a multilayer perceptron neural network model. Expert Syst. Appl. 38(10), 13475–13481 (2011). https://doi.org/10.1016/j.eswa.2011.04.149
Palfrey, J.S., Levine, M.D., Walker, D.K., Sullivan, M.D.: The emergence of attention deficits in early childhood: a prospective study. J. Dev. Behav. Pediatr. 6(6), 339–348 (1985). https://doi.org/10.1097/00004703-198512000-00004
Reed, M.A., Pien, D.L., Rothbart, M.K.: Inhibitory self-control in preschool children. Merrill-Palmer Q. 30(2), 131–147 (1984)
Rothbart, M.K., Bates, J.E.: Temperament. In: Damon, W., Lerner, R. (Series eds.) (eds.) Handbook of Child Psychology, vol. 3, Social, Emotional, and Personality Development, 6th edn., pp. 99–166. Wiley, New York (2006)
Singh, D., Reddy, C.K.: A survey on platforms for big data analytics. J. Big Data 2(1), 8 (2015). https://doi.org/10.1186/s40537-014-0008-6
Sonuga-Barke, E.J., Koerting, J., Smith, E., McCann, D.C., Thompson, M.: Early detection and intervention for attention-deficit/hyperactivity disorder. Expert Rev. Neurother. 11(4), 557–563 (2011). https://doi.org/10.1586/ern.11.39
Thomas, A., Chess, S.: Temperament and Development. Brunner/Mazel, New York (1977)
Wang, L.: Mu-ming Poo: China brain project and the future of Chinese neuroscience. Nat. Sci. Rev. 4(2), 258–263 (2017). https://doi.org/10.1093/nsr/nwx014
Wang, P.L. (ed.): Children’s Temperament: Basic Characteristics and Social Composition. Psychological Publishing, Taiwan (2003)
Wang, P.L.: A literature review of child temperament research from 1980 to 2011. Res. Appl. Psychol. 61, 52–112 (2014)
Wilens, T.E., et al.: Psychiatric comorbidity and functioning in clinically referred preschool children and school-age youths with ADHD. J. Am. Acad. Child Adolesc. Psychiatry 41(3), 262–268 (2002). https://doi.org/10.1097/00004583-200203000-00005
Zentner, M., Bates, J.E.: Child temperament: an integrative review of concepts, research programs, and measures. Int. J. Dev. Sci. 2(1–2), 7–37 (2008). https://doi.org/10.3233/dev-2008-21203
Zhu, G., Li, Y., (Paul) Wen, P., Wang, S., Zhong, N.: Unsupervised classification of epileptic EEG signals with multi scale k-means algorithm. In: Imamura, K., Usui, S., Shirao, T., Kasamatsu, T., Schwabe, L., Zhong, N. (eds.) BHI 2013. LNCS (LNAI), vol. 8211, pp. 158–167. Springer, Cham (2013). https://doi.org/10.1007/978-3-319-02753-1_16
Acknowledgement
This research is supported by the Ministry of Education, Taiwan and Shih Chien University under grant USC-107-03-04010, USC-107-05-04006 and USC-108-08-04005.
Author information
Authors and Affiliations
Corresponding author
Editor information
Editors and Affiliations
Rights and permissions
Copyright information
© 2019 Springer Nature Switzerland AG
About this paper

Cite this paper
Lee, M.R., Yen, A.YJ., Chang, L. (2019). Neurofeedback and AI for Analyzing Child Temperament and Attention Levels. In: Ohara, K., Bai, Q. (eds) Knowledge Management and Acquisition for Intelligent Systems. PKAW 2019. Lecture Notes in Computer Science(), vol 11669. Springer, Cham. https://doi.org/10.1007/978-3-030-30639-7_3
Download citation
DOI: https://doi.org/10.1007/978-3-030-30639-7_3
Published:
Publisher Name: Springer, Cham
Print ISBN: 978-3-030-30638-0
Online ISBN: 978-3-030-30639-7
eBook Packages: Computer ScienceComputer Science (R0)