
Abstract
There are different techniques (e.g. direct or indirect observation, questionnaires, etc.) with which it is possible to estimate user experience. Biometric data obtained with different devices (e.g. EEG, EMG) have been used as a source to infer user experience. In this work, as part of the construction of an evaluation model of user experience, we present a preliminary study that seeks to identify emotions using records of brain electrical activity through the visualisation of preset images that stimulate emotions known a priori. The results include identifying emotions of joy and displeasure through brain activity using the Emotive device in older adults.
You have full access to this open access chapter, Download conference paper PDF
Keywords
1 Introduction
The aging of population and increased incidences of diseases such as the Alzheimer’s disease have moved researchers to look for alternative non-drug treatments, including technologies supporting cognition, that seek to maintain the cognitive status of the elderly through cognitive stimulation [1, 2]. To this end, diverse intelligent environment applications that seek to promote cognitive stimulation have been proposed [3]. However, due to the characteristics of this group of users, caused by their decline in their physical and cognitive skills, it is necessary to assess what is the elderly’s perception regarding the use, acceptance and adoption of these applications.
In the literature various types of usability and user experience evaluations have been reported to assess the perception of the elderly regarding the use of technology [4], however, conducting this kind of assessments may be a difficult task due to the inherent limitations of the evaluation methods themselves. It is well known that in techniques based on self-report, participants tend to respond thinking about what the researcher wants to hear, or tend not to be sincere and “improve” their perception of the results because they feeled assessed, or because they have forgotten the details of their experience [5]. Because of this, the results of these evaluations may not be very reliable. In addition there are additional elements that can affect user experience, including [6]: context of use, devices, cultural factors, social factors and the user features.
As an alternative to traditional user experience assessment techniques, we propose to record brain electrical activity of the participant by means of a low-cost electroencephalogram (EEG) device, to infer the user experience in an automated manner; and this through the design of a baseline EEG reference associated with two basic emotional states (pleasure-displeasure). The goal is to build a model with which we could identify emotions using biometrics brain data and based on these determine the user experience. In this work we present the first results of the process towards building this model.
2 Related Work
In recent years, biometric data have been used to assess the experience of users. For example, in [7], an assessment is made using the game Half-Life 2 by means of galvanic skin response, video, questionnaires and electromyography of users. Additionally, in [8] different physiological data such as galvanic skin response, electrocardiogram, electromyography of the jaw, and respiration rate are used to measure the user experience in entertainment technology, specifically using EA Sport video game NHL 2003.
Chai [9] evaluates three mobile phone applications using three self-report questionnaires to obtain subjective data as well as recording brain activity using EEG of participants. These data were used to determine the positive and negative states in the user experience of the applications used. Yao [10] evaluates the user experience of a cell phone application using the User Experience Questionnaire (UEQ) as well as physiological data such as brain activity (EEG), galvanic skin response, pulse, heart rate and respiration rate.
Hakvoort [11] evaluated the user experience of a brain-computer interface (BCI) game based on the expectation of users. For such assessment, a modified version of the SUXES method [12] was used. They used an evoked visual response as stimuli, and an EEG to register physiological data.
In a similar fashion, in this work we propose to design a model that uses brain biometric data to evaluate the user experience of the elderly during their use of computer applications, and compare these results with those of other more traditional assessment techniques.
3 The Brain and Emotions
The brain has approximately 100 million neurons and is responsible for processes such as reasoning and emotions, among others. The brain is divided into two hemispheres, the left and the rightFootnote 1, which in turn are divided into four lobesFootnote 2: frontal, parietal, occipital, and temporal [13] (see Fig. 1).

Hemispheres and brain lobes
On the one hand, emotions can be positive or negative. At all times, no matter the context of the (private or public) situation people experience a range of emotions whether positive (e.g. joy, gratefulness, sympathy, happiness, love, etc.) or negative (e.g. displeasure, irritability, disgust, anger, sadness, etc.) [14, 15]. Investigations concerning emotional state indicate that left prefrontal cerebral activity is associated with positive facial expressions while viewing joyful films, whereas right prefrontal cerebral activity is associated with negative facial expressions while viewing unpleasant films [16]. Positive emotions are associated with the activation of regions of the left hemisphere while negative emotions relate to the activation of regions of the right hemisphere [16–19].
On the other hand, asymmetry analysis of the power of the alpha wave, is recognized as a useful procedure for the study of emotional reactivity [20]; further, it is common to find the asymmetries in the frontal region of the brain, which may be perceived on a subject since childhood [18]. In a study conducted in [21] a spectral analysis of the electrical activity obtained through an EEG is conducted. In this analysis it is established that the power of the alpha wave varies depending on the emotion present (positive or negative emotion). Coan [22] mentions that frontal EEG asymmetry serves as a moderator in case of emotional activity and also functions as a mediator if there is an emotional response. Papusek [23], by means of brain activity EEG records and the Scalar Emotional Abilities Self-Report (SEAS), shows that people perceive the emotions of others and are able to regulate their own emotions, this by means of asymmetric changes in the prefrontal cortical regions during social interaction and emotional stimuli. Also in Papusek [23], other works on EEG and emotional states are presented, which show the asymmetrical changes that occur in the prefrontal cortical part of the brain during social emotional stimulations [23].
Taking this background into consideration, in the next section a controlled study is described that seeks (i) to analyze the biometric signals of an electroencephalogram (EEG) of the participants and (ii) identify patterns in the frequencies of signals and the activated brain areas according to known a priori stimuli.
4 Methodology
In order to build a model that interprets a set of user experience emotions, we conducted a preliminary study that presents selected images to stimulate known a priori emotions and registers the EEG response. For the study we used the International Affective Picture System (IAPS) [24], which establishes a set of standardized images that are used by researchers in the study of emotions and attention. A subset of the images proposed in [25], which evoke specific emotions. The following categories of emotion in images were used: (A) 10 of fear, (B) 10 of joy, (C) 10 of displeasure and (D) 29 neutral (see Fig. 2).

Example of selected images from the IAPS catalog
The results of brain activity were studied using spectral analysis of power = 10*log10(µV2/Hz)r2 in the alpha, betha and theta bands, including 15 min of trace clean of artifacts removed by visual analysis, in the frontal and occipital derivations: (1) AF3, (2) F7, (3) F3, (4) FC5, (7) O1, (14) AF4, (12) F4, (13) F8, (11) FC6 y (8) O2.
4.1 Participants
Participants were 8 seniors, 2 men and 6 women, aged 60 to 83 years (avg. = 72.3 years, s.d. = 8.46 years). Inclusion criteria were: aged over 60 years, not having suffered a head trauma, absence of moderate or severe cognitive problems and absence of visual problems (i.e. not being able to see well without glasses at a distance of 30–50 cm). All participants signed an informed consent, the procedures of this study did not represent any risk to them. To determine that participants did not have cognitive problems, we applied the Mini Mental State Examination (MMSE).
4.2 Materials
-
Device: We used the Emotiv EEG device (See Fig. 3) with which is possible to obtain and record brain activity through 14 electrodes (AF3, F7, F3, FC5, T7, P7, O1, O2, P8, T8, FC6, F4, F8, AF4). The electrodes are placed according to the International 10–20 System, which sets the position of the electrodes on the craneal surface corresponding to cortical areas. The device also has a filter for frequencies from 0.2 to 45 Hz, which takes 128 samples per second for each channel.
Fig. 3. 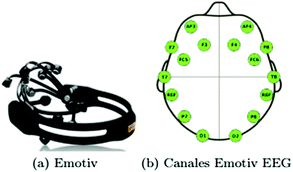
Device and EEG channel positions
-
Software: We used Camtasia Studio to record the facial expressions of each participant; TestBench software, included with the Emotiv EEG device, to record data from brain activity with the 14 electrodes; EEGExProc, to display images; and EEGLAB to process the electroencephalography data [26].

4.3 Reduction, Filtering and Data Analysis
To perform data analysis of the recorded brain activity using the EEGLAB software, we applied a finite response filter to the impulse for powers above ranges of electrical brain activity, in order to attenuate all signals with frequencies less than 0.2 Hz and eliminate various artifacts. Deleted artifacts are generated by eye blinking, lateral eye movements, muscle activity and others movements [27, 28]. This was corroborated by visual analysis. Once applied the filter and removed the unnecessary signals and artifacts, we proceeded to apply the Fast Fourier Transform, in order to obtain the powers of the different brain waves (alpha, betha, theta and delta) and to graphically identify the different brain areas activated depending on the analyzed brain wave.
4.4 Procedure
-
Introduction to the study: Firstly, we explained to the elderly the purpose of the study and the characteristics of the Emotiv EEG device. They were also asked to sign a consent form.
-
Device calibration: For best performance of the device, this was calibrated for each participant by recognizing facial gestures and the manipulation of a virtual 3D cube through brain interaction.
-
Image presentation: In this stage, each participant was presented with a set of images according to the proposal in [24]. The images were presented in a sandwiched way: joy, fear, disgust and neutral for 6 s each, and immediately after, we asked the participant to indicate what was his/her impression upon seeing the image according to one of the following categories: joy, fear, disgust and neutral. During this phase, the brain activity of each participant was recorded by the TestBeanch software.
5 Results
According to the classification verbally reported by each participant, we obtained that the answers to the selected images to provoke emotions of joy fitted 92 % of the times (see Fig. 4). Additionally, responses to images of disgust agreed 84 % of the times (see Fig. 5). In both cases, the images converge to the categories of the established test.

Joy

Disgust
Responses to the images selected to evoke fear agreed 49 % (see Fig. 7) of the times, while for those selected as Neutral their responses corresponded 56 % of the times (see Fig. 6). As can be seen, the responses in these categories did not reported as expected.

Fear
Later, once brain activity data was processed by means of the methods described in section “Reduction, filtering and analysis”, different EEG frequency spectra were obtained for each of the bands. The analysis of EEG data was corroborated by an expert in the area of neuroscience. The asymmetry in the alpha band of subject ADM1 indicates the possibility of observing through EEG patterns a relationship with the affective state during the observation of stimulus with emotional valence as a synchronization response caused in the limbic system and its relation to the frontal structures.
The power of the beta band was more prominent in the dorsolateral frontal of the left hemisphere, associated to cognitive analysis of observed information, which suggests an interpretation of disgust by the user, coinciding with the stimuli presented in the activity (see Fig. 9).
In the same vein, regarding the analysis of power of the theta band, it is possible to observe an asymmetry whose greatest value is seen in the right frontal, consistent with the stimuli in the activity with emotional charge, besides indicating attention by the elderly in the activity (see Fig. 10).
6 Discussion
From the results obtained from verbal responses for the images in the joy category 92 % of the responses were reported as joy, 6 % as neutral and 2 % as fear (See Fig. 5). The image shows that participant AD4 expressed that image 45 caused fear to him/her; in this case the image corresponded to 3 girls smiling, so it could be a coding error by the participant; while for image 51, which corresponded to an older woman, it was classified as neutral by participants AD1 and AD6.
In Fig. 6, corresponding to the verbal responses for the images in the disgust category, it can be observed that over 80 % transmitted emotions of disgust to participants, while 10 % were reported as neutral, 3 % as fear and 2 % as joy. Participant AD3 indicated that image 31, which showed a hand surgery, brought joy to him/her as s/he was a medical doctor, so that it could be concluded that the activities being undertaken by participant AD3 as a professional affected his/her answer.
For images of the neutral category, we obtained that 56 % of these were classified as neutral, 40 % of them caused joy and 2 % were reported as disgusting (see Fig. 7). Participant AD2 consistently indicated the same disgust response for pictures 4, 24 and 44, in which the same fungus appeared, while participant AD5 responded as neutral for image 4, as disgust for image 24 and as neutral for image 44. These two participants were the only ones who gave responses of disgust for the images.

Neutral
For the fear category, only 49 % of the responses indicated that the images provoked this emotion, 39 % of responses indicated disgust and 10 % of responses were classified as neutral (see Fig. 8). Of this group of images, image 59, which shows a skeleton, was the only one that did not caused fear; 40 % of participants responded with neutral and 30 % responded with disgust. It is important to highlight that participant AD7 was a special case, as s/he responded that all images caused him/her joy. We observed that participant AD7 was greatly nervous during the test, which along with a possible misunderstanding during the explanation of the activity could caused that s/he always provided the same answer.

Power spectrum of alpha wave
The analysis conducted of the EEG data is preliminary, as we only obtained power spectra for each band using the EEG registry of each elderly. This analysis allowed us to visually identify different brain regions where an activity related to the emotional stimuli were shown depending on the selected band (See Figs. 8, 9 and 10). These results can be related to those obtained by the categories of joy (positive emotion) and disgust (negative emotion). The analysis of EEG records stimulus in order to establish a better relationship between the categories of images with different power spectra and the brain areas involved remains pending. This type of analysis will reveal which elements have to be considered in the design of the model to assess the user experience.

Power spectrum of beta wave

Power spectrum of theta wave
7 Conclusions and Future Work
This paper presents preliminary results of our proposal to determine a set of emotions through brain activity (EEG) records. The results of verbal responses of participants validated the emotional presence of joy and disgust, especially when the selected images to evoke these emotions were presented.
In the analysis of the spectra for each subject, asymmetries are seen in the frontal EEG recording of the elderly, this is related to changes in mood showing joy at left frontal activation and disgust at right frontal activation, allowing the detection of brain regions linked to these emotions [20, 29, 30]. The electrophysiological results of this study confirm the possibility of identifying changes in the affective state (displeasure vs. joy) during the activity through the biometric signals of the brain obtained with the eMotiv headset. Our future work includes processing the EEG records by type of stimulus to make a comparison between what is verbally said by the elderly and what is registered with the eMotive headset. Additionally, we will conduct an analysis of variance (ANOVA) to determine significant differences between the types of stimuli administered to subjects.
References
Buiza, C., Soldatos, J., Petsatodis, T., Geven, A., Etxaniz, A., Tscheligi, M.: HERMES: pervasive computing and cognitive training for ageing well. In: Omatu, S., Rocha, M.P., Bravo, J., Fernández, F., Corchado, E., Bustillo, A., Corchado, J.M. (eds.) IWANN 2009, Part II. LNCS, vol. 5518, pp. 756–763. Springer, Heidelberg (2009)
Meza-Kubo, V., Morán, A.L.: UCSA: a design framework for usable cognitive systems for the worried-well. Pers. Ubiquit. Comput. 1–11 (2012)
Augusto, J.C.: Ambient intelligence : basic concepts and applications. In: Filipe, J., Shishkov, B., Helfert, M. (eds.) ICSOFT 2006. CCIS, vol. 10, pp. 16–26. Springer, Heidelberg (2008)
Meza-kubo, V.: Guıas para el diseno de aplicaciones de estimulacion cognitiva utilizables por el adulto mayor. Universidad Autonoma de Baja California (2012)
Arhippainen, L., Tähti, M.: Empirical evaluation of user experience in two adaptive mobile application prototypes. In: Proceedings of the 2nd International Conference on Mobile and Ubiquitous Multimedia (2003)
Arhippainen, L.: Capturing user experience for product design (2003)
Mandryk, R.L., Atkins, M.S., Inkpen, K.M.: A continuous and objective evaluation of emotional experience with interactive play environments. In: Proceedings SIGCHI Conference Human Factors Computing Systems - CHI 2006, p. 1027 (2006)
Mosquera, G., Daniel, S.: Adquisición de señales electroencefalográficas para el movimiento de un prototipo de silla de ruedas en un sistema BCI (2012)
Chai, J., Ge, Y., Liu, Y., Li, W., Zhou, L., Yao, L., Sun, X.: Application of frontal EEG asymmetry to user experience research. In: Harris, D. (ed.) EPCE 2014. LNCS, vol. 8532, pp. 234–243. Springer, Heidelberg (2014)
Yao, L., Liu, Y., Li, W., Zhou, L., Ge, Y., Chai, J., Sun, X.: Using physiological measures to evaluate user experience of mobile applications. In: Harris, D. (ed.) EPCE 2014. LNCS, vol. 8532, pp. 301–310. Springer, Heidelberg (2014)
Hakvoort, G., Poel, M., Gurkok, H.: Evaluating user experience with respect to user expectations in brain-computer interface games, pp. 1–4 (2011)
Turunen, M., Hakulinen, J., Melto, A., Heimonen, T., Laivo, T., Hella, J.: SUXES—user experience evaluation method for spoken and multimodal interaction, pp. 2567–2570 (2009)
Isotani, T., Lehmann, D., Pascual-Marqui, R.D., Fukushima, M., Saito, N., Yagyu, T., Kinoshita, T.: Source localization of brain electric activity during positive, neutral and negative emotional states. Int. Congr. Ser. 1232, 165–173 (2002)
Fredrickson, B.L., Losada, M.F.: Positive affect and the complex dynamics of human flourishing. Am. Psychol. 60(7), 678–686 (2005)
Piqueras Rodriguez, J.-A., Ramos Linares, V., Matínez Gonzalez, A.E., Oblitas Guadalupe, L.A.: Emociones negativas y su impacto en la salud mental y física. Suma Psicológica. 16, 85–112 (2009)
Harmon-Jones, E., Sigelman, J.: State anger and prefrontal brain activity: evidence that insult-related relative left-prefrontal activation is associated with experienced anger and aggression. J. Pers. Soc. Psychol. 80(5), 797–803 (2001)
Simón, V.: Mindfulness y neurobiología. Rev. Psicoter. 66, 5–30 (2007)
Navarro, F.S., Pedro, J., Lapuente, R.: Amígdala, corteza prefrontal y especialización hemisférica en la experiencia y expresión emocional. Serv. Publicaciones, Murcia Univ., Murcia (2004)
Winkler, I., Mark, J., Jager, M., Mihajlovic, V., Tsoneva, T., Winkler, I., Mark, J.: Frontal EEG asymmetry based classification of emotional valence using common spatial patterns. World Acad. Sci. Eng. Technol. 45, 373–378 (2010)
Bermúdez Cicchino, A.N.: Técnicas de procesamiento de EEG para detección de eventos (2014). Postgradofcm.Edu.Ar
Kostyunina, M.B., Kulikov, M.A.: Frequency characteristics of EEG spectra in the emotions. Neurosci. Behav. Physiol. 26(4), 340–343 (1996)
Coan, J.A., Allen, J.J.B.: Frontal EEG asymmetry as a moderator and mediator of emotion. Biol. Psychol. 67(1–2), 7–49 (2004)
Papousek, I., Freudenthaler, H.H., Schulter, G.: Typical performance measures of emotion regulation and emotion perception and frontal EEG asymmetry in an emotional contagion paradigm. Pers. Individ. Dif. 51(8), 1018–1022 (2011)
Bertron, A., Petry, M., Bruner, R., Mcmanis, M., Zabaldo, D., Martinet, S., Cuthbert, S., Ray, D., Koller, K., Kolchakian, M., Hayden, S.: International affective picture system (IAPS): technical manual and affective ratings (1997)
Bradley, M.M., Lang, P.J.: The international affective picture system (IAPS) in the study of emotion and attention. In: Coan, J.A., Allen, J.J.B. (eds.) Handbook of Emotion Elicitation and Assessment, pp. 29–46. Oxford University Press, Oxford (2007)
Delorme, A., Makeig, S.: EEGLAB: an open source toolbox for analysis of single-trial EEG dynamics including independent component analysis. J. Neurosci. Meth. 134, 9–21 (2004). Elsevier
Vecchio, F., Babiloni, C., Buffo, P., Rossini, P.M., Bertini, M.: Inter-hemispherical functional coupling of EEG rhythms during the perception of facial emotional expressions. Clin. Neurophysiol. 124(2), 263–272 (2013)
Mandryk, R.L., Inkpen, K.M., Calvert, T.W., Science, C., Canada, B.C.V.A.: Using psychophysiological techniques to measure user experience with entertainment technologies, vol. 2005 (2005)
Marcuse, L.V., Schneider, M., Mortati, K.A., Donnelly, K.M., Arnedo, V., Grant, A.C.: Quantitative analysis of the EEG posterior-dominant rhythm in healthy adolescents. Clin. Neurophysiol. 119, 1778–1781 (2008)
Wheeler, R.E., Davidson, R.J., Tomarken, A.J.: Frontal brain asymmetry and emotional reactivity: a biological substrate of affective style. Psychophysiology 30, 82–89 (1993)
Acknowledgements
We acknowledge the support of UABC, specially that in the form of the Programa de Servicio Social 212, and CONACYT by scholarship number 538130 to first author. We also acknowledge the elderly participants from Ensenada, B.C., México for their support and participation in the study.
Author information
Authors and Affiliations
Corresponding author
Editor information
Editors and Affiliations
Rights and permissions
Copyright information
© 2015 Springer International Publishing Switzerland
About this paper
Cite this paper
Carrillo, I., Meza-Kubo, V., Morán, A.L., Galindo, G., García-Canseco, E. (2015). Emotions Identification to Measure User Experience Using Brain Biometric Signals. In: Zhou, J., Salvendy, G. (eds) Human Aspects of IT for the Aged Population. Design for Aging. ITAP 2015. Lecture Notes in Computer Science(), vol 9193. Springer, Cham. https://doi.org/10.1007/978-3-319-20892-3_2
Download citation
DOI: https://doi.org/10.1007/978-3-319-20892-3_2
Published:
Publisher Name: Springer, Cham
Print ISBN: 978-3-319-20891-6
Online ISBN: 978-3-319-20892-3
eBook Packages: Computer ScienceComputer Science (R0)