
Abstract
The rapid development of China urbanization and smart transportation has promoted the optimized environment design research of Chinese railway station, while earlier rapidity construction and changing commerce operation based on original railway station have posed various contradictions of function, business and culture. This paper aims at proposing optimized environment design solutions based on pedestrian simulation as exemplified Nanjing South Railway Station, which is the largest railway junction station in Asia. In this paper, simulation experiment of passenger traffic is implemented to diagnose environmental problems, which is based on passengers’ behavioral patterns. Then, five kinds of optimized design solutions are proposed pointedly according to quantized conclusion of the simulation. In addition, a special ‘Optimized Simulation Sample’ System (a.k.a. OSS) of passenger traffic is established, for evaluating whether expected effects have been realized by using the framework of AnyLogic 7.0. In the end, the optimized environment designing is implemented based on pedestrian simulation. In this way, the existing environment problems of railway station can be identified precisely and optimized design solutions can be more effective.
You have full access to this open access chapter, Download conference paper PDF
Keywords
1 Introduction
The rapid development of China urbanization and smart transportation has promoted the optimized environment design research of Chinese railway station. The railway station displays regional culture as a city landmark, while earlier rapidity construction and commerce operation based on original railway station have posed various contradictions, which need to be solved urgently. Most of environment design research was related to passenger sensory experience rather than behavioral data analysis, which leads to the ignorance of passengers’ potential demands.
Under the circumstances, the optimized environment designing project of Nanjing South Railway Station, which is the largest railway junction station in Asia, is commissioned to our design team by Shanghai Railway Bureau of China, for solving the existing environment problems and improving passengers’ experience on the waiting floor based on analysis of pedestrian simulation, which is one most effective ways to establish the scientific relationship between human behavior and environmental space of railway station.
The location of Nanjing is in the confluence of the Yangtze River and Beijing-Shanghai railway (Fig. 1). Nanjing South Railway Station connects five high-grade railway lines as the national principal railway station. And its location is on the main axis of Nanjing city (Fig. 2). The gross area of Nanjing South Railway Station is approximately 458000 m2, the daily passengers traffic is more than a hundred thousand passengers. It has been operated in 2011.

Nanjing location

Nanjing South Railway Station location
2 Diagnosis of Environmental Problems
2.1 Passengers’ Behavioral Patterns in Key Periods
A database of 250 passengers’ behaviors based on on-site observing and video tracking is quantified for recording their behavioral patterns and active time. The conclusion consists of three parts:
-
(1)
Duration of stay. 10 % of passengers stay within 15 min. 32 % of passengers stay between 15 and 30 min. 44 % of passengers stay between 30 min and 1 h. 14 % of passengers stay more than 1 h (Fig. 3).
Fig. 3. 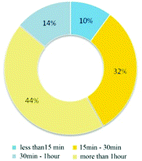
Duration of stay (Color figure online)
-
(2)
Behavioral pattern. 46 % of passengers are only waiting for the trains. 24 % of passengers have a meal before getting on trains. 13 % of passengers are shopping during the waiting. 7 % of passengers consult information from the staff or service facilities. 6 % of passengers need necessary service, including travel help for disabled passengers, care services for maternal and child and emergency care of elderly passengers. 2 % of passengers store their luggage. 2 % of passengers have other behaviors (Fig. 4).
Fig. 4. 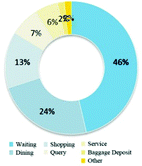
Behavioral patterns (Color figure online)
-
(3)
Passengers’ behavioral patterns in key periods. Passengers who stayed within 15 min are just waiting for the trains. Passengers who stayed between 15 and 30 min have a meal. Passengers who stayed between 30 min and 1 h have a meal and go shopping. Passengers who stayed more than 1 h need to store luggage, station services, or querying besides above-mentioned behavior patterns (Fig. 5).
Fig. 5. 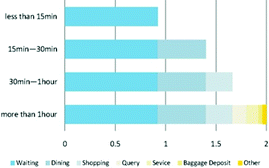
Behavioral patterns in key periods (Color figure online)


2.2 Simulation Experiment of Passenger Traffic
The simulation experiment of passenger traffic is set at 30 min and 1 h, because 86 % of passengers stay within 1 h. Meanwhile, for providing a necessary foundation for experimental analysis, our team establish environmental base map according to functional zones, facilities distribution and detailed dimension of waiting floor. Then, passengers’ traffic density and active chain is simulated by using the framework of AnyLogic 7.0. Analytical drawings are shown in Figs. 6 and 7.

Simulation of passenger traffic at 30 min (Color figure online)

Simulation of passenger traffic at 1 h (Color figure online)
The conclusions are as follows: The blue zones on the outer edge represent less passenger traffic. The green zones at the center of floor mean steady traffic. The yellow zones in the front and the middle of waiting floor indicate concentrated passenger traffic. The red zones at the center axis and waiting zone mean congested traffic.
2.3 Simulation Sample System of Passenger Traffic
For obtaining quantized conclusion of the simulation experiment, a special ‘Simulation Sample System of Passenger Traffic’ is established. The procedure is divided into three steps:
-
(1)
Selecting simulation samples. To choose 7 key locations in the environmental base map as the target samples such as the front of center axis, the middle of center axis, both sides of center axis, north store zone, south store zone, waiting zone for VIP and special passengers and the bottom of center axis.
-
(2)
Analyzing the changes of passengers’ traffic density and comparing traffic density of these samples at 30 min and 1 h.
-
(3)
Establishing simulation sample system of passenger traffic. The quantized conclusions are as follows: The traffic in the front of center axis is very congested. The traffic in the middle of center axis is crowded. Both sides of center axis have huge vertical traffic. The north store zone is lack of shopping passengers. The south store zone has appropriate density. The traffic of the waiting zone for VIP and special passengers occur the route intersection with revenue passenger. The passengers at the bottom of center axis stay for a while (shown in Table 1).
Table 1. Simulation samples of passenger traffic
2.4 Analysis of Environmental Problems
The environmental problems on the waiting floor of Nanjing South Railway Station contain five parts according to simulation conclusion:
-
(1)
The location of the waiting zone for VIP and special passengers is unreasonable (Fig. 8: Blue zones). The routes of different passengers, including revenue passengers and VIP and special passengers interfere with each other. The special passengers’ route is not convenient and VIP passengers are lack of privacy.
Fig. 8. 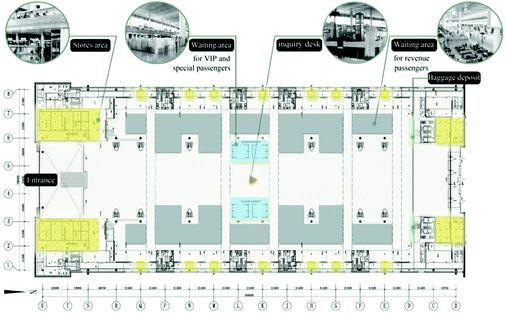
Plan drawing (Color figure online)
-
(2)
The number of inquiry desk is not enough and its functions need to be separated. It only has one inquiry desk in the middle of center axis to take three functions such as enquiry, service and medical aid. Its utilization rate cannot satisfy passengers’ requirements due to the over long route (Fig. 8: Red zone).
-
(3)
Service facilities need to be improved. The shortage of information equipments cause passengers waiting for a long time. Baggage deposit at the bottom of center axis is too far (Fig. 8: Green zones). And public facilities for children are missing.
-
(4)
Scattered shops are lack of unified design (Fig. 8: Yellow zones). The business of stores is unsatisfactory except food shops, especially in north store zone because its location is far away from waiting zone.
-
(5)
Local culture characteristics are not obvious. Passengers have no idea which city they stay and what is the spirit of this station.

3 Optimized Design Solutions
3.1 Separation of Different Passengers
In order to shorten distance and avoiding interference, the waiting zone for VIP and special passengers is removed to east side of entrance so that their route can be separated from revenue passengers (Fig. 9: Blue zone).And the waiting zone for revenue passengers is arranged symmetrically in both sides of center axis (Fig. 9: Gray zones).

Optimized plan drawing (Color figure online)
3.2 Improvement of Center Zone
For emphasizing central axis and creating space sequence, a center zone is established along with the central axis of waiting floor, which is arranged multiple space nodes, including inquiry desk, service center, cultural display and characteristic landscape (Fig. 9: Red zones). The inquiry desks in both ends of center zone are the start and end of space nodes. The service center in the midpoint is the primary space node. The cultural display between inquiry desks and service center, combined with characteristic landscape, is secondary space node (shown in Table 2).
3.3 Addition of Service Facilities
Two service facilities zones are established in both sides of entrance (Fig. 9: Green zones) in order to integrate these functions of baggage deposit, information query and cash withdrawal, etc. In addition, for providing medical emergency, a medical aid station is arranged in the west side of center axis. Public facilities for children and the disabled are added in public lavatory and waiting zone for special passengers.
3.4 Redesign of Store Zone
For avoiding interference of shopping route, service route and sightseeing route. Four-row store zone is unified designed in both sides of center axis to sell foods, magazines, costumes and digital products near the waiting zone for revenue passengers (Fig. 9: Yellow zones). Then, food shops are removed to the west side of the entrance so as to meet passengers’ dining requirements in a shortest route. In addition, the enclosed north stores are replaced by open type stores to attract more passengers.
3.5 Promotion of Regional Culture
The regional culture is inherited and remodeled. The center axis is the emblem of main axis in Nanjing city. Many unique structure elements in traditional Chinese architecture are used such as Tianjing, Dougong and Louchuang, etc.
Study on the regional culture elements of south Jiangsu. The circle portal of inquiry wall is printed by Pixie pattern, which is the emblem of Nanjing city. The lamps in cultural booths are printed by plum pattern, which is the flower of Nanjing city. The ceramic store applies symbolic architectures of South Jiangsu to demonstrate characteristic topics.
4 Evaluation of Optimized Environment Designing
4.1 Optimized Simulation Experiment
For determining the optimized expected effects have been intuitively realized, the optimized simulation experiment of passenger traffic is also set at 30 min and 1 h by using AnyLogic 7.0. And analytical drawings are shown in Figs. 10 and 11.

Optimized simulation of passenger traffic at 30 min (Color figure online)

Optimized simulation of passenger traffic at 1 h (Color figure online)
Comparing optimized traffic density with present situation, the optimized conclusions of simulation experiment are as follows: The blue zones reduce in a small range, especially at the bottom of waiting floor. It means that the passenger traffic of north stores is improved. The proportion of green zones is increased significantly so as to most of passenger traffic is evenly distributed. The decreased yellow zones in the middle of waiting floor show that passengers’ partition is very effective. The area of red zones has a huge decrease so that congestion situation is improved properly.
4.2 Optimized Simulation Sample System
For obtaining quantized conclusion of optimized simulation, a special ‘Optimized Simulation Sample’ system (a.k.a. OSS) of passenger traffic is established. All the target samples are the same as before. The result comes out after comparing the improvement of optimized traffic density at 30 min and 1 h: The traffic in the front of center axis is effectively separated. The congestion in the middle of center axis is improved significantly. The traffic of the waiting zone for revenue passengers is evenly distributed. The shopping traffic of north store zone is increasing. The traffic of the waiting zone for VIP and special passengers has appropriate density. Both sides of center axis have steady shopping passengers. The traffic at the bottom of center axis is evenly distributed (shown in Table 3).
5 Implementation of Optimized Environment Designing
Our design team confirms that the above-mentioned five design solutions are very effective to solve these contradictions of function, business and culture on the waiting floor of Nanjing South Railway Station. And expected effects have been realized based on optimized simulation outcome. Then, Shanghai Railway Bureau of China passed our optimized environment designing after three rounds of design presentation, plan modification and achievement demonstration. In the end, the optimized environment designing is implemented. Finished photos are shown in Table 4.
6 Conclusion
From the perspective of environment design, this paper aims at proposing optimized design solutions based on pedestrian simulation as exemplified the waiting floor of Nanjing South Railway Station. The purpose of optimized design is to improve the facilities and functions of Nanjing South Railway Station, and to enhance the city’s culture characteristics.
Depending on the thought of pedestrian simulation, the simulation experiment of passenger traffic is implemented to diagnose environmental problems, which is based on passengers’ behavioral patterns. In addition, a special ‘Optimized Simulation Sample’ System (a.k.a. OSS) of passenger traffic is established, for evaluating whether expected effects have been realized. In the end, five kinds of optimized design solutions are proposed and implemented according to the quantized conclusion of the simulation.
In this way, pedestrian simulation can provide more effective technical supports for optimized environment design. Therefore, the existing problems can be identified precisely and the optimized design solutions can be pointedly proposed.
References
Zhang, G., Chen, Y., Li, P., Fibbe, S., Brayne, C.: Study on evaluation indicators system of crowd management for transfer stations based on pedestrian simulation. Int. J. Comput. Intell. Syst. 4(6), 1375–1382 (2011)
Hu, Q.Z., Deng, W.: Optimization Models and Rating Methods of Urban Public Transport. Science Press, Beijing (2009)
Ekmekcioğlu, M., Kutlu, A.C., Kahraman, C.: A fuzzy multi-criteria swot analysis: an application to nuclear power plant site selection. Int. J. Comput. Intell. Syst. 4(4), 583–595 (2011)
Acknlowledgment
This research is supported by “the Social Science Foundation of Jiangsu Province” (Grant No. 15ZHD001), and funded by “2013 Research Initiation Project of Nanjing University of Science and Technology”.
Author information
Authors and Affiliations
Corresponding author
Editor information
Editors and Affiliations
Rights and permissions
Copyright information
© 2016 Springer International Publishing Switzerland
About this paper
Cite this paper
Cao, Y., Duan, Q., Zhang, N. (2016). Optimized Environment Designing of Nanjing South Railway Station Based on Pedestrian Simulation. In: Rau, PL. (eds) Cross-Cultural Design. CCD 2016. Lecture Notes in Computer Science(), vol 9741. Springer, Cham. https://doi.org/10.1007/978-3-319-40093-8_50
Download citation
DOI: https://doi.org/10.1007/978-3-319-40093-8_50
Published:
Publisher Name: Springer, Cham
Print ISBN: 978-3-319-40092-1
Online ISBN: 978-3-319-40093-8
eBook Packages: Computer ScienceComputer Science (R0)