
Abstract
Accident investigations have revealed that human errors are the most likely reasons of major accidents in the nuclear domain. As the nuclear power plant system become more computerized and automated, operators pay more attention to following the operating procedures, rather than why they are conducting a certain operation, or what results will the operation lead to. On the other hand, due to complexity of the nuclear system as well as accident scenario, operators are overwhelmed by detailed operating procedures and component parameters, thus may lose awareness of system status while conducting operations. This is very dangerous especially when emergency or unanticipated events occurs.
Researches show that displaying higher information abstraction hierarchy on the nuclear system interface can help operators achieve higher efficiency as well as situation awareness. This approach has been used in interface design in the nuclear domain, and has been proved to be helpful with operators understanding of the system, as well as the connection between component parameters and the system status. However, existing applications of abstraction hierarchy are system-oriented, and do not explicitly supply procedures operation.
This project is an exploratory research to improve the functional displays design for a 3rd generation nuclear power plant. Our objective in this research, is to design and evaluate an auxiliary display with higher abstraction hierarchy, for supplying emergency operating procedures in the emergency scenario. We use task analysis methods to obtain a list of system components and parameters that are related to the emergency operating procedures. Work-domain analysis is used to obtain goal-means connections among system components as well as their parameters. With this list of elements and their connections, we design an auxiliary display, referring to the current system interface design handbook. The display design is implemented on design-support DCS platform. User testing and expert evaluation are conducted to evaluate the display design in two aspects: improvement of operation efficiency, as well as reduction of human errors.
You have full access to this open access chapter, Download conference paper PDF
Keywords
1 Introduction
1.1 Research Background
As more and more emphasis is paid upon clean energy, nuclear energy is being used to meet the needs of more industries. However, from Three Mile Island to Fukushima nuclear power plant accident, the safety of nuclear power plants has been the bottleneck of the development and wide acceptance of nuclear energy. On the one hand, serious consequences of accidents could be caused in the field of nuclear power; on the other hand, there is a high proportion of human error among all errors. With the development of nuclear power technology and the improvement of system automation, human error has become the most likely cause of accidents in the field of nuclear power (Endsley and Garland 2000). This is very dangerous especially when emergency or unanticipated events occurs (Burns 2008). Thus, a lot of research has been done on how to improve operator performance. The digital human-machine interface is a very important part of the factors that affect operators’ performance.
The digital human-machine interface includes the digitized monitoring display, the alert system and the procedure display. Our study focuses on the procedure display of the system. Procedure is what guides people to achieve a certain purpose by taking sequential actions (Niwa and Hollnagel 2002). In nuclear power plant control room, the operator follows these procedures to carry out corresponding actions. Specifically, we focus on emergency operation procedures.
1.2 Research Methods
The current procedure display includes three modules: the main step module containing procedure steps, the sub-step module containing specific operations corresponding to each main task, and the parameter module containing relevant parameters of the current system. The issue with this display is that only the detailed steps to be performed are displayed. Although operators have taken training regarding the reason to perform this step, it’s hard to maintain overall situational awareness (Baddeley 1972) of the whole system, since operators are conducting operations with a high degree of concentration on the current step. Meanwhile, the problem related to situational awareness is the most likely cause to operators’ errors (Endsley and Garland 2000). Due to the complexity of the emergency and the operation itself, the operator may be lost in the details of the specific task, and not able to maintain awareness of “why this task needs to be accomplished”, “what is going to happen if the step is accomplished” and “what is going on in the whole system”. The situation is particularly dangerous when the operator is conducting unfamiliar operation procedures.
Researches have shown that improving the level of abstraction hierarchy of information displayed on the screen can improve operator performance. This prompts us to add an abstract auxiliary display to the digitized system to improve the performance of the operator in emergency. We evaluate operators’ performance from two aspects: first, the completion rate of procedures, including the completion time, error rate, workload, etc.; second, the situational awareness of the system.
On the other hand, most of the previous researches are focused on the information content and information organization of the monitoring display. In this study, we will apply these methods and design concepts to the procedure display. Since the purpose of improving the abstraction hierarchy of the information (Rasmussen 1985) in the monitoring display is to improve the operators’ situation awareness of the system state, it is necessary to obtain the function information of each system components. While in the procedure display, we are concerned not only about the situation awareness of the whole system, but also of the current task being operated on. Thus, we need to extend the study to each system components and operation steps. After obtaining their functional information, we then come up with a reasonable way to organize it.
In this study, we first use the cognitive work analysis to get the information content to be presented on the display, and the second is to research the organization of information per different interface design methods. Then we implement the procedure display on the design-support DCS platform in the actual system. Experiment is then carried out to evaluate the display for its ability to support situation awareness as well as task completion.
2 Design of Procedure Display
2.1 Design Method
In “abstract auxiliary display” we concern about two aspects: “abstract” refers to the use of information abstraction hierarchy (Rasmussen 1985) in the display to show the system state-related information to help the operator improve the overall state of the system cognition; “auxiliary” refers to adding computerized procedures to support the display, to ensure that the operator can successfully complete the procedures in the display.
In terms of showing the system state, in the abstract auxiliary display each relevant component is displayed, their state being encoded by shapes and colors. Focusing on the emergency operation procedure we choose, we mainly concern on the coolant loading, pressure and temperature of the first loop. At the same time, we also show the functional connection between the components in the display.
In terms of supporting the procedure operation, the display shows various items on the paper-based procedure, including steps, sub-steps, prompts and monitoring items. And by highlighting the information associated with the current task in the auxiliary screen, we combine the procedure steps and the auxiliary screen to improve the operators’ situation awareness of the current operational task.
2.2 Display Design
Our design called the connection display is shown in Fig. 1. In this display, we keep the original physical connections among components of the system, components’ parameters and states are encoded by shape, area and color. The main coding methods and their corresponding meanings are described as follows:

Connection display design (Color figure online)
-
Circles, pipes and loading
Storage and transmission of the coolant is the main support of loading, represented by circles and pipes between circles. Specifically, if there is only one-way coolant transfer between the two devices, the two circles are connected by only one pipe; if there is a two-way coolant circulation between the two devices, the two circles are by two pipes. As shown in the figure, it is a one-way transfer from ACC to RCS, and it is a two-way circulation between CVS and RCS.
In addition, we use the area of circles combined with solid/dashed contour to represent the volume of each equipment. A solid contour is used when the equipment (such as the ACC) carries the set amount of load which doesn’t change with condition. And the device that can introduce more liquid from the outside of the system is represented by a dashed contour. For circles with solid contour, we use the area size of the circle to represent the size of its inherent capacity. For example, in PXS system, IRWST has the largest amount of loading, followed by CMT, and ACC has the minimum, then circle representing IRWST has the maximum area size, followed by CMT and finally ACC. Note that the size of area and the amount of the loading are only corresponded in order, not in proportion.
-
Black solid lines and temperature
The direct operation on the temperature is mainly in the form of heat exchange in pipes, represented by black solid lines in our display. For example, PRHR uses coolant in IRWST to cool down the high-temperature coolant in the pipe from RCS, through the pipe heat exchange.
-
Pipes with outlet and pressure
The RCS system primarily reduces the pressure by venting gas (or gas-liquid mixture), such as in ADS stages 1–3, which depressurize the RCS system by excluding high-pressure gas from the RCS system into the containment vessel. We represent this with the pipes with outlet.
Since the procedure is a cooling and depressurization process of the RCS system, we use color and concentric circles to represent the temperature and pressure in our display. And the combination of color and pipe represents whether the device is running or not.
-
Colors and temperature
Three colors are used to represent the system temperature: red represents the highest temperature, which characterizes the temperature of the RCS system and the primary coolant of the SG; yellow represents the second-high temperature which characterizes that of the SG secondary side liquid, gas, and RCS gas outlet; the lowest temperature is represented by blue, as shown in the figure, such as CVS, CMT.
-
Colors and equipment status
The color can be used combined with a pipe to represent the operation status of a device: for example, when a coolant is being transferred between two circles, the pipe is filled with solid red or blue. Red indicates that the coolant in the RCS flows into the other device, and blue indicates the flow from the other devices into the RCS. If the ADS first-stage is running, the ADS first-stage pipeline is filled with yellow dashed line. For heat exchange pipes, they are filled with solid black when not running, and filled with read surrounded by a halo when they are running.
-
Concentric circles and the size of the pressure
From the work analysis of the system, most of the automatic cooling and pressure relief operations are related to the RCS system pressure. In the display, we use concentric circles to represent RCS system pressure. There are some representative pressure values, such as when the RCS system pressure is lower than 11.72 MPa, CMT and PRHR are in use, and when it’s less than 4.9 MPa the ACC is triggered to come into use. As shown in the figure, from inside to outside, concentric circles form a pressure drop scale ring. To show the correspondence between the pressure and the devices being triggered by each pressure value, devices are placed on the corresponding concentric circles. For example, when the RCS pressure drops to a specific value, the corresponding concentric circle lights up (turns black) and the corresponding device starts to work (pipe filled).
3 Design Valuation
3.1 Operating Environment
Since the design of this abstract auxiliary display is engineering-oriented, it is necessary to extend the design scheme to all procedures. The focus of attention is on practical application in nuclear power plants. Therefore, the compatibility between the design and the original nuclear power plant system, and the operating experience are very important. Considering the actual situation of the laboratory, we combined user test and expert evaluation to evaluate the display design.
-
Procedure display. In this study, the following two procedure displays are involved:
-
Original procedure display: the display that includes only the main step module, the sub-step module and the parameter module, not including the abstract auxiliary display;
-
Procedure display with abstract auxiliary display: the display that includes the main step module, the sub-step module and the parameter module, together with the abstract auxiliary display (Fig. 2).
Fig. 2. 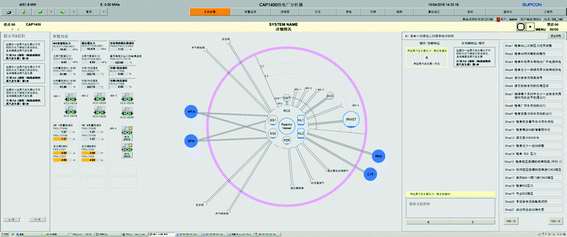
Design implementation on system display
-

-
Operational tasks. As previous researched have shown, the structural goal-instrument information has a significant effect on performance improvement when the operator performs a non-designed task, but little help in designed tasks and the situation with interference. To solve the problem in these two cases, we use highlighting relevant information to connect procedure display and abstract display to provide operational purposes-means information. To distinguish these three cases, the following three tasks are designed:
-
Designed benchmark task: to conduct the emergency operation procedures;
-
Designed benchmark task with non-design tasks: When conducting procedures, abnormal situations happen in the system, which is about parameters relevant to the designed benchmark task, but doesn’t affect the operation and final system status. For example, CMT level value is normal, but is shown abnormal and in alarming color in the abstract. If the operator raised this question during the operation or interviews, then consider the operator’s non-design task completed;
-
Designed benchmark task with interference: the interference occurs when operator is conducting procedure steps, whereby the performance of the operator after the return to the task is evaluated. Situational awareness questionnaires, which are needed to obtain data during task operation, serve as interference in our experiment.
-
3.2 Testing Process
In the user test section, a total of two nuclear power plant operators participated in the test. The two operators respectively go through the following processes: training, completing the learning experience questionnaire, conducting emergency operation procedure tasks (filling in the situational awareness questionnaires in the process), filling in the operation experience questionnaire and post-test interview.
In the procedure operation section, the operator conduct operations alone in the simulated control room, using the abstract auxiliary display, and the accident process and data are controlled from the simulator by staff. During operation, to ensure that the operation process is close to the actual situation of the main control room as much as possible, staff and expert reviewers observe the operator’s screen and mouse operation in the observation room through the Morae recording and monitoring tools on another screen.
3.3 Operator Performance Measures
In the user test section, on the one hand we obtain subjective opinions feedbacks through the interview, on the other hand we also collect the following quantitative data (Kim and Seong 2009).
-
Task completion time: the whole time the operator needed to complete the operation from the beginning to mandate procedures.
-
Situational awareness: it is divided into situation awareness of system status and of procedure operations (Burns 2008), the two of them are also divided into overall perception of the process, and understanding of the current situation respectively. The overall perception is measured by the questionnaire sent out after the task is finished, at which time the participant cannot see the system display and need to fill out the questionnaire relying on their own recall. The question in the questionnaire is about the whole operation process, the change trend of local or global parameters. The understanding of the current situation involves questions like “why you are conducting this operation”, “what do you expect to see when this operation is completed” and “why is this situation happening”. A total of four situation awareness questionnaires were sent during the test. The first time was after the operator chose to start the operation, and the situation awareness of the system state was examined. The second and third were completed respectively by the operator after the operation of two modules of operations, and cognition of the current operation was examined. The fourth is sent when the operation is completed, once again on the cognition of system status.
-
Workload: we use the NASA-TLX scale to examine workload, including six dimensions of mental demand, physical demand, time pressure, effort requirement, performance satisfaction and frustration, each dimension scoring 1--10, with higher scores indicating greater workload.
-
Non-design task completion: CMT level value is normal during the test, but is shown abnormal and in alarming color in the abstract. If the operator raised this question during the operation or interviews, then consider the operator’s non-design task completed.
3.4 Data Analysis
-
Task completion time. The two operators spent 17 min and 21 min respectively completing 23 steps of the procedure. Since there is no comparison between operation with and without the abstract auxiliary display, we asked operators to evaluate the task completion time during the post-test interview. Both operators reckon that, due to the screen integration and automatic navigation, they do not need to find their relevant displays and parameters on their own, thus the use of the abstract auxiliary screen can shorten task completion time.
-
Situational awareness. In the case of questionnaires on situational awareness, the two operators showed relatively significant differences. The first operator received a high score in four questionnaires, and the four experts who participated in the review considered the operator’s response to be correct. In post-test interviews, the operator said he was familiar with the process of the accident, and can recall the accident process and direction after a brief observation of the abstract display. The second operator received a low score on the situational awareness question in the system state, especially the state of CMT component is poorly understood. In post-test interviews, the operator said he was not familiar with the process of the accident. As we can see, the abstract auxiliary display has a better effect when operators are more familiar with the situation.
-
Workload. Both operators selected moderate workloads in the workload scales.
-
Non-design task completion. Both operators raised question regarding CMT loading alarm in interview.
3.5 Operators’ Feedback
In terms of usefulness, both operators considered the current abstract auxiliary display to include all the components, parameters, and procedural operations required for the emergency operation. And system abnormal is easy to notice using this display.
In terms of usability, the operators offered some improvement suggestions.
First, the connection relationship of internal RCS system components is better to be displayed intuitively.
Second, we can combine the auxiliary display with the original display where detailed system components and all parameters are shown, since the auxiliary works better in obtaining situation status in a short time, but more detailed information need to be provided using original system displays.
Finally, in terms of degree of computerization, it is desirable that the system can recommend the next operation in the procedure, eliminating the need for the operator’s comparison and judgment steps so that the operator only needs to finalize and confirm the recommended operation from the system.
4 Results and Discussion
4.1 Results and Suggestions
From the operators’ performance and interview we can that the current abstract auxiliary display design can meet the basic operation of the chosen emergency operation procedures. The future direction of improvement is to achieve the navigation connection between abstract auxiliary display and the original display, and involve all the relevant parameters from the original system flow diagram display in the abstract auxiliary display.
After the evaluation, it was found that the operators and the experts basically recognized the function of the success in procedure operation support of the abstract auxiliary display, and hoped to use the display as part of the comprehensive function display to help the operator complete the procedure operation and understand the system status.
The abstract auxiliary display can be used as a part of the comprehensive function display, facilitating the operator’s procedural operations. It can be applied in two ways.
-
One is to reduce the display size and embed it into the original system flow diagram display, to help the operator detect the overall status of the system. To make this happen, we need to adjust the current size of the corresponding parts in the display to ensure that each part and their status are still recognizable after reducing the display size.
-
The second is to involve all the relevant parameters from the original system flow diagram display in the abstract auxiliary display, which can ensure that the operator can rely on this one screen to complete all the procedures operation. Considering the large number of parameters, we will need to add a new layer, and the operator can freely choose which part of the display parameters to be shown.
4.2 Limitations and Future Works
First, due to constraints of time, equipment and personnel, we were not able to carry out sufficient usability testing after completing the design and implementation of the abstract auxiliary display. Thus, the design also requires follow-up engineering experiments and further improvements before being introduced in the nuclear power plant system.
Second, when applying this design to the whole system beyond the chosen emergency operation procedure, the method of our study can be used, which is, work analysis based on work domain, display design using original connections and various coding methods, and implementation on the design-support DCS system.
Finally, to fully prove the help of the abstract auxiliary display to the operator and the integration with the original display, we need to carry on the engineering experiment after systematic application of the picture, and obtain the feedback from the operators and make the next iteration.
References
Baddeley, A.D.: Selective attention and performance in dangerous environments. Br. J. Psychol. 63(4), 537–546 (1972)
Burns, C.M., Skraaning, G., Jamieson, G.A., Lau, N., Kwok, J., Welch, R., Andresen, G.: Evaluation of ecological interface design for nuclear process control: situation awareness effects. Hum. Factors J. Hum. Factors Ergon. Soc. 50(4), 663–679 (2008)
Endsley, M.R., Garland, D.J. (eds.): Situation Awareness Analysis and Measurement. CRC Press, Boca Raton (2000)
Kim, J.H., Seong, P.H.: Human Factors Engineering in Large-Scale Digital Control Systems, pp. 163–195. Springer, London (2009)
Niwa, Y., Hollnagel, E.: Integrated computerisation of operating procedures. Nucl. Eng. Des. 213(2), 289–301 (2002)
Rasmussen, J.: The role of hierarchical knowledge representation in decision making and system management. IEEE Trans. Syst. Man Cybern. 15(2), 234–243 (1985)
Acknowledgment
This study was supported by the National Natural Science Foundation of China (Project No. 71671102).
Author information
Authors and Affiliations
Corresponding author
Editor information
Editors and Affiliations
Rights and permissions
Copyright information
© 2017 Springer International Publishing AG
About this paper
Cite this paper
Ma, Y., Jiang, X., Gao, Q., Lian, H., Wang, Q. (2017). Design and Evaluation of an Abstract Auxiliary Display for Operating Procedures in Advanced NPP Control Rooms. In: Harris, D. (eds) Engineering Psychology and Cognitive Ergonomics: Performance, Emotion and Situation Awareness. EPCE 2017. Lecture Notes in Computer Science(), vol 10275. Springer, Cham. https://doi.org/10.1007/978-3-319-58472-0_25
Download citation
DOI: https://doi.org/10.1007/978-3-319-58472-0_25
Published:
Publisher Name: Springer, Cham
Print ISBN: 978-3-319-58471-3
Online ISBN: 978-3-319-58472-0
eBook Packages: Computer ScienceComputer Science (R0)