
Abstract
This research has adopted eye movement technique to study the influence of warning character on the information processing, which involves in two experiments. With our study, we have made our focus of research on the warning position, warning icon and warning border as a visual stimulus means. In our investigation, we have been keeping on with such commonly-made eye-movement recording parameters, such as the Fixation Count, the First Fixation and Duration by using an Eye Link II eye tracker, which is in a position to reflect the subject’s attention and conversion of the attentions. What is more, we have done a single factor variance analysis (ANOVA) in hoping to work out the experimental data due to the kinds of eye movement parameters, and the following conclusions were drawn: (1) The warning position on the warning interface affects the machining process of the warning. When the warning is embedded in text, the warning is more noticeable and the perceived hazard level is higher. (2) Consistent with the results of the relevant studies on warnings on product labels, there are also icon effects on the warning interface, and the icon can improve the salience of the warning itself and the level of perceived danger. (3) There are also border effects on the warning interface. The appearance of the border makes the warning more significant and the perceived hazard level can be improved. The research results of this paper can also be adopted as the warning message design reference, which has had a great significance in improving the identification of warning message and reducing the rate of visual accidents on interface.
You have full access to this open access chapter, Download conference paper PDF
1 Introduction
Warning sign is an important part of safety signs and widely used in industrial production, transportation, life and other fields in the past [1]. With the rapid development of technology and the Internet, more and more user interfaces are replaced by digital interfaces. These interfaces contain a large number of dynamic, complex information. Man identify and perceive danger information conveyed by warning information to guide their behavior, so as to effectively avoid possible accidents. The process of the warning information has an effect on human behavior can be divided into four stages: discovery (attention stage), recognition (recognition stage), information judgment and decision (judgment stage), and compliance operation (behavior stage) [2]. In the whole process, the discovery stage is the prerequisite to comply with the operation, that is, the visual attention level of the warning information directly affects the human observance behavior of safety. Therefore, it is important to study the visual attention feature of the warning information, which can improve the recognition of the warning information and reduce the occurrence of the accident.
2 Background
2.1 Warning Information Processing Model
Wogalter and Laughery (1996) [3] have also applied the general information Communication Theory model to the field of warning research and proposed Human Information Processing, which considers warnings processing includes the following five cognitive processes: attention, understanding, attitudes and beliefs, Motivation, compliance behavior. Wogalter et al. (1999) [4] extended this information processing model, fitting communication components such as information sources, transmission channels, and receiver characteristics into the model, and proposed Communication-Human Information Processing model (C-HIP). Laughery (2006) [5] proposed an information communication model in the field of warning, and improved the C-HIP model. Laughery believed that the information communication model consists of four parts: the sender of the warning message, the warning message, the media, the recipient of the information, and discussed the influence factors of warning effectiveness from three aspects: the characteristics of the warning itself, the individual characteristics and the scene characteristics. Wu Xiaoli (2015) [6] proposed Error-Cognition Mapping from the perspective of the error factor and bring it into the complex information interface design. Figure 1 is a review and reorganization of warning information processing model.

The warning information processing model
2.2 Eye Movements and Warning Research
When individuals are browsing visual information, the visual information will be passed to the brain through visual system, the brain through the control of human eye movement to express interest in visual information, and this process is known as visual perception [7]. Individuals usually express their interest in visual objects or areas through initiative, frequent gaze. In cognitive psychology, the concept of gaze is called “selective attention”. Visual selective Attention use an information processing bottleneck mechanism, which allows only a small part of the information into the human eye to reach the short-term memory and visual attention area. Significant enough visual stimulus can be highlighted from the entire complex scene, and this significance has nothing to do with the purpose of observation, it occurs quickly in a bottom-up manner [8]. This mechanism of visual selection of attention can enable individuals to quickly locate objects or regions of interest in complex visual environments [9]. Test data of eye movement reflects individual attention and the conversion of attention. Therefore, the attention degree of visual stimuli can be obtained by collecting and analyzing the corresponding eye movement data.
3 Study 1: Effect of Warning Position and Warning Icon on the Warning Information Processing
Based on the previous research, experiment 1 will study the characteristics of the individual reading warning interface under different presentation characteristics of the warning using a 2-level factorial design. Variable 1: the warning position, including warning information embedded in the text and located at the bottom of the text. Variable 2: the warning icon, including warning information with icon and without icon.
3.1 Participates
A total of 14 male and 26 female graduate students aged between 23 and 27 years (M = 23.8, SD = 2.1) who used computer almost every day were recruited. All participants had normal or corrected vision without color blindness or color weakness. The participants would get a gift after the experiment.
3.2 Experimental Materials
The experiments were conducted in the ergonomics lab of Southeast University under normal lighting condition (about 300 lux). The stimuli were generated by one computer with a 2 GHz Intel Core i7 processor. The computer was running under the Mac OS operating system. The display used was a 23.8-inch LCD monitor (Dell u2414 h). The graphics adapter was used at a resolution of 1920 × 1080 pixels and a frame rate of 60 Hz. The viewing distance used was 50 cm.
First of all, according to the principle that the experimental material should be similar to the real environment as much as possible to ensure the external validity and extensibility of experimental results, the experimental materials used in this study were selected from a number of control systems which include warning interfaces. The interfaces included a section of reading material, which contained warning information (Fig. 2). Contents of the reading material covered many areas, including driving, flight control, scheduling, organization and management. A total of 10 interfaces was selected.

Experimental material (embedded text, icon) & (bottom of text, no icon)
Next, some modifications were made to the raw material to ensure that when participants viewed each warning interface, the familiarity and reading time is roughly the same. All warning interfaces layouts used the same format——the outline paragraph structure. Each experimental material had approximately 3–4 paragraphs and there was only one warning message on each interface. Word number of each material was also roughly the same, being controlled between 158 and 172. In order to avoid different brands affected the participants reading the experimental material, the material’s brand was hidden. All factors of the warning information (fonts, spacing, etc.) were controlled to be consistent except for the warning position and warning icon. Experiment 1 was designed to examine the influence of warning position and warning icon on the warning information processing, adopting 2 (layout: embedded text, bottom of text) × 2(icon: yes, no) two factors within subjects design. The layout refers to the location of the warning information in the warning interface. “Embedded text” means that the warning information is presented near the text associated with the warning information, “bottom of the text” means the warning information is separated from the text and presented separately at the bottom of the page. The icon refers to whether a warning icon is displayed in the warning information, see Fig. 2. In this study, a triangle with an exclamation mark is used as a warning icon, see Fig. 3.

Warning icon
Finally, 2 warning interfaces were selected randomly from the 10 warning interfaces using as exercise materials and the remaining 8 warning interfaces were used as the formal experimental materials for the participants to read. In order to ensure that each participant observed each warning interface and read each alarm format, the content of the warning interface and the appearance order of the warning format were carried out (latin squares) balanced design.
3.3 Procedure
The task of the subject was to read the theme carefully and try to remember the contents of the warning interface. The participants were presented the 8 warning interfaces one by one. The “Space” button was used to turn the pages after each material had been read. Inform the participants that after the reading was complete, they need to fill out a paper questionnaire and determined the sentence in the questionnaire right or wrong according to the contents they had read. Before the start of the formal experiment, the participant first performed an exercise. Before the formal experiment began, the participants were given an exercise. Exercise was to read 2 warning interfaces continuously and judge four sentences which had been show to the participants right or wrong after the reading is complete.
In order to balance the reading material and warning feature sequence effect, the experiment will be randomly divided into 8 groups, so that each material can only be read once, participants can also read all the warning features. In order to ensure that the similarity between the experiment and the real environment, after reading all the materials, participants were presented an interference task to detect whether the warning information into the long-term memory before memory test.
4 Results
4.1 Memory Performance
The correct rate of the questionnaire part was compared, the results in Table 1.
-
1.
Main effects of warning position showed no significant (F(1,39) = 0.291, P > 0.05). Warning information embedded in text and at the bottom of text had no significant effects on the correct rate.
-
2.
Main effects of warning icon showed no significant (F(1,39) = 0.291, P > 0.05). Having icon and no icon had no significant effects on the correct rate.
-
3.
There was no significant interaction effect of warning position and warning icon (F(1,39) = 0.053, P > 0.05). It showed that there is no significant difference between warning position and warning icon in the correct rate.
4.2 Time of Entering the AOI
The time of entering the area of interest (AOI) when the participants read the warning interface was compared. The results are shown in Table 2.
The analysis of variance (ANOVA) method was used to analyze the data. The results showed as follows:
-
1.
Main effects of warning position showed significant (F(1,30) = 61.422, P < 0.001). Warning information embedded in text and at the bottom of text had significant effects on the participants’ time of entering the AOI. Warning information embedded in text had a significantly shorter entry time than it at the bottom of the text.
-
2.
Main effects of warning icon were significant (F(1,30) = 4.298, P < 0.05). Having icon and no icon had significant effects on the participants’ time of entering the AOI. Having icon had a significantly shorter entry time than no icon.
-
3.
There was no significant interaction effect of warning position and warning icon (F(1,30) = 0.047, P < 0.05). It showed that there is no significant difference between warning position and warning icon in the participants’ time of entering the AOI.
4.3 The Number of Fixations in the AOI
The number of fixations in the AOI when the participants read the warning interface was compared. The results are shown in Table 3.
The analysis of variance (ANOVA) method was used to analyze the data. The results showed as follows:
-
1.
Main effects of warning position showed significant (F(1,30) = 18.461, P < 0.01). Warning information embedded in text and at the bottom of text had significant effects on the participants’ time of entering the AOI. The number of fixations in embedded text was significantly greater than it at the bottom of the text.
-
2.
Main effects of warning icon were significant (F(1,30) = 7.869, P < 0.01). Having icon and no icon had significant effects on the participants’ time of entering the AOI. The number of fixations in having icon was significantly greater than it in no icon.
-
3.
There was a significant interaction effect of warning position and warning icon (F(1,30) = 6.799, P < 0.05). Further analysis found that when the warning information was embedded in the text, there was a significant difference in the number of the participants’ fixation in having warning icon and no icon. The number of fixations in having icon was significantly greater than it in no icon under this conditions. When the warning information was located at the bottom of the text, there was no significant difference in the number of the participants’ fixation in having warning icon and no icon. Regardless of whether the warning information has an icon, the participants had significant differences in the number of fixations in embedded text and bottom of text. Warnings embedded in text have significantly more fixations than warnings at the bottom of text. see Fig. 4.
Fig. 4. 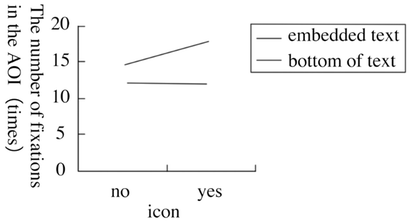
The number of fixations in the AOI under different warning characteristics

4.4 AOI Total Residence Time
AOI total residence time when the participants read the warning interface was compared. The results are shown in Table 4.
The analysis of variance (ANOVA) method was used to analyze the data. The results showed as follows:
-
1.
Main effects of warning position showed significant (F(1,30) = 15.080, P < 0.01). Warning information embedded in text and at the bottom of text had significant effects on the participants’ time of entering the AOI. The number of fixations in embedded text was significantly greater than it at the bottom of the text.
-
2.
Main effects of warning icon were significant (F(1,30) = 4.575, P < 0.01). Having icon and no icon had significant effects on the participants’ time of entering the AOI. The number of fixations in having icon was significantly greater than it in no icon.
-
3.
There was a significant interaction effect of warning position and warning icon (F(1,30) = 4.647, P < 0.05). Further analysis found that when the warning information was embedded in the text, the participants had a significant difference in the AOI total residence time between the icon warning and no icon warning. The AOI total residence time for the icon warning was significantly longer than the no icon warning. When the warning information was located at the bottom of the text, there was no significant difference in the AOI total residence time between the icon warning and no icon warning. Regardless of whether the warning information has an icon, the participants’ AOI total residence time had no significant differences in the warning position. See Fig. 5.
Fig. 5. 
The AOI total residence time under different warning characteristics

4.5 The Percentage of the AOI Residence Time Occupies Total Reading Time
The percentage of the AOI residence time occupies total reading time when the participants read the warning interface was compared. The results are shown in Table 5.
The analysis of variance (ANOVA) method was used to analyze the data. The results showed as follows:
-
1.
Main effects of warning position showed significant (F(1,30) = 19.685, P < 0.01). Warning information embedded in text and at the bottom of text had significant effects on the percentage of the residence time occupies total reading time. The percentage of the embedded text residence time occupies total reading time was significantly more than the bottom of text residence time occupies total reading time.
-
2.
Main effects of warning icon were significant (F(1,30) = 4.285, P < 0.05). Having icon and no icon had significant effects on the percentage of the embedded text residence time occupies total reading time. The percentage of having icon residence time occupies total reading time was significantly more than no icon residence time occupies total reading time.
-
3.
There was no significant interaction effect of warning position and warning icon (F(1,30) = 1.401, P > 0.05). It showed that there is no significant difference between warning position and warning icon in the percentage of the AOI residence time occupies total reading time.
5 Discussion
Experiment 1 results showed that the position of warnings affected the warnings information processing. According to the Gestalt Psychology, individuals in life are perceived according to certain organizational rate experience. Continuity is a good organizing principle. The parts which are close to each other are more easily formed into the whole body for processing.
When the warning information was embedded in the text, the warning interface could be read more fluently, individuals could better perceive the specific content and point of the warning information. They could be aware of the danger would happen in which specific step of the operation and how it should be prevented directly and clearly. But when placed at the bottom of the text, the warning message has no explicit directivity, resulting in individual underestimating the importance of the warning, and the warning is not deep-level processing.
Similarly, a warning icon can also enhance the significance of the warning information and the danger degree of the warning message individual perceived. The presence of the icon in the warning made the participant notice the warning faster and longer. From the perspective of the choice mechanism of attention, the vast majority of warning information on warning interface was text, the emergence of icon stimulus could quickly attract people’s attention, made people aware of the warning. At the same time, attention not only includes bottom-up processing, as well as top-down processing. The knowledge and experience individual already have as well as the expectations of the stimulus will also affect individual attention processing process. Warning icons are often associated with dangerous information, which has existed in individual long-term memory. When individual saw the warning icon again, the level of risk perception can be raised.
6 Study 2: Effect of Warning Position and Border on the Eye Gaze Warning
In this study, we investigated the characteristics of the individual reading warning interface under different presentation characteristics of the warning using a 2-level factorial design. Variable 1: the warning position, including warning information embedded in the text and located at the bottom of the text. Variable 2: the warning border, including warning information with border and without border.
6.1 Participates
A total of 15 male and 25 female graduate students aged between 23 and 27 years (M = 23.3, SD = 2.6) who used computer almost every day were recruited. All participants had normal or corrected vision without color blindness or color weakness. The participants would get a gift after the experiment.
6.2 Experimental Materials
The source of the experimental material is the same as the experiment 1. The content of the warning interface and the appearance order of the warning format were also carried out balanced design. Experiment 2 was designed to investigate the effect of warning position and border on the eye gaze warning, adopting 2 (layout: embedded text, bottom of text) × 2 (border: yes, no) within subjects design. The border refers to whether a border is displayed in the warning information, see Fig. 4.
6.3 Procedure
Experimental procedure is the same as experiment 1.
7 Results
7.1 Memory Performance
The correct rate of the questionnaire part was compared, the results in Table 6.
-
1.
Main effects of warning position showed no significant (F(1,28) = 0.375, P > 0.05). Warning information embedded in text and at the bottom of text had no significant effects on the correct rate.
-
2.
Main effects of warning border showed no significant (F(1,28) = 0.191, P > 0.05). Having icon and no icon had no significant effects on the correct rate.
-
3.
There was no significant interaction effect of warning position and warning border (F(1,28) = 0.415, P > 0.05). It showed that there is no significant difference between warning position and warning border in the correct rate.
7.2 Time of Entering the AOI
The time of entering the area of interest (AOI) when the participants read the warning interface was compared. The results are shown in Table 7.
The analysis of variance (ANOVA) method was used to analyze the data. The results showed as follows:
-
1.
Main effects of warning position showed significant (F(1,28) = 51.642, P < 0.001). Warning information embedded in text and at the bottom of text had significant effects on the participants’ time of entering the AOI. Warning information embedded in text had a significantly shorter entry time than it at the bottom of the text.
-
2.
Main effects of warning border were significant (F(1,28) = 4.335, P < 0.05). Having border and no border had significant effects on the participants’ time of entering the AOI. Having border had a significantly shorter entry time than no border.
-
3.
There was no significant interaction effect of warning position and warning border (F(1,30) = 0.013, P < 0.05). It showed that there is no significant difference between warning position and warning border in the participants’ time of entering the AOI.
7.3 The Number of Fixations in the AOI
The number of fixations in the AOI when the participants read the warning interface was compared. The results are shown in Table 8.
The analysis of variance (ANOVA) method was used to analyze the data. The results showed as follows:
-
1.
Main effects of warning position showed significant (F(1,28) = 11.114, P < 0.01). Warning information embedded in text and at the bottom of text had significant effects on the participants’ time of entering the AOI. The number of fixations in embedded text was significantly greater than it at the bottom of the text.
-
2.
Main effects of warning border were significant (F(1,28) = 11.663, P < 0.01). Having border and no border had significant effects on the participants’ time of entering the AOI. The number of fixations in having border was significantly greater than it in no border.
-
3.
There was a significant interaction effect of warning position and warning icon (F(1,28) = 0.090, P > 0.05). It showed that there is no significant difference between warning position and warning border in the number of fixations in the AOI.
7.4 AOI Total Residence Time
AOI total residence time when the participants read the warning interface was compared. The results are shown in Table 9.
The analysis of variance (ANOVA) method was used to analyze the data. The results showed as follows:
-
1.
Main effects of warning position showed significant (F(1,28) = 9.441, P < 0.01). Warning information embedded in text and at the bottom of text had significant effects on the participants’ time of entering the AOI. The number of fixations in embedded text was significantly greater than it at the bottom of the text.
-
2.
Main effects of warning border were significant (F(1,28) = 8.793, P < 0.01). Having border and no border had significant effects on the participants’ time of entering the AOI. The number of fixations in having border was significantly greater than it in no border.
-
3.
There was a significant interaction effect of warning position and warning border (F(1,28) = 0.442 P > 0.05). It showed that there is no significant difference between warning position and warning border in the AOI total residence time.
7.5 The Percentage of the AOI Residence Time Occupies Total Reading Time
The percentage of the AOI residence time occupies total reading time when the participants read the warning interface was compared. The results are shown in Table 10.
The analysis of variance (ANOVA) method was used to analyze the data. The results showed as follows:
-
1.
Main effects of warning position showed significant (F(1,28) = 14.586, P < 0.01). Warning information embedded in text and at the bottom of text had significant effects on the percentage of the residence time occupies total reading time. The percentage of the embedded text residence time occupies total reading time was significantly more than the bottom of text residence time occupies total reading time.
-
2.
Main effects of warning border were significant (F(1,28) = 5.233, P < 0.05). Having border and no border had significant effects on the percentage of the embedded text residence time occupies total reading time. The percentage of having border residence time occupies total reading time was significantly more than no border residence time occupies total reading time.
-
3.
There was no significant interaction effect of warning position and warning border (F(1,28) = 0.794, P > 0.05). It showed that there is no significant difference between warning position and warning border in the percentage of the AOI residence time occupies total reading time.
8 Discussion
From the results of Experiment 2, it can be deduced that the warning information and the border can attract the individual attention quickly, and last the attention to the warning information longer. It is worth noting that the results of the two experiment showed that participates’ memory performance was no significant difference, which is inconsistent with previous studies. It may be due to the fact that the average reading time of the warnings in this study is long, which leads to no difference in memory scores. The three features of position, icon and border may only affect the phase of perceiving and understanding in the warning information processing, while no effect on the subsequent long-term memory stage. It is also possible that, because there are few experimental materials in this study, the subjects only need to read the eight warning interfaces without time limit, and the memory score test adopts the form of recognition, the task is simple, memory performance no difference.
9 Conclusion
In this study, two experiments were conducted to investigate the effect of warning features on the warning process, and the following conclusions were drawn:
-
1.
The warning position on the warning interface affects the machining process of the warning. When the warning is embedded in text, the warning is more noticeable and the perceived hazard level is higher [6].
-
2.
Consistent with the results of the relevant studies on warnings on product labels, there are also icon effects on the warning interface, and the icon can improve the salience of the warning itself and the level of perceived danger.
-
3.
There are also border effects on the warning interface. The appearance of the border makes the warning more significant and the perceived hazard level can be improved.
Some suggestions for the warning interface designer:
The warning information should be presented in the description text. The study found that when the warning is embedded in the text, the warning reading time is significantly longer, providing greater possibilities for the following individual observance behavior of safety. At the same time, warnings on the warning interface should use features such as borders and icons to improve the significance of warnings.
References
Guoqing, N., Caicai, C., Kun, Z.: An eye movement study of auxiliary words effect to safety signs’ recognition. J. Henan Polytech. Univ: Nat. Sci. 33(4), 410–415 (2014)
Yicheng, H., Xiaohong, Z., Liang, W.: Evaluating effectiveness of safety signs on building site. China Saf. Sci. J. 22(8), 37–42 (2012)
Wogalter, M.S., Laughery, K.R.: WARNING! Sign and Label Effectiveness. Cwrre. Dir. Psychol. Sci. 5(2), 35–37 (l996)
Wogalter, M.S., DeJoy, D.M., Laughery, K.R.: Warnings and Risk Communication. Taylor and Francis, Philadelphia (1999)
Wogalter, M.S., VigiIante J.W.J.: Attention Switch and Maintenanct. Handbook of Warnings, pp. 245–265. Lawrence Erlbaum Associates, Mahwah (2006)
Xiaoli, W.: Complex Information Task Interface Error-cognitive Mechanism. Southeast University (2015)
Mingru, H., Zheming, S., Yongjian, L.: Increasing availability of knowledge map based on eye movement experiment of cognitive load. Chin. J. Manage. 9(5), 753–757 (2012)
Yanlan, S., Rui, Z., Cheng, Z., et al.: Visual attention based image classification. J. Image Graph. 10, 1886–1889 (2008)
Nong, S., Zhenglong, L., Tianxu, Z.: Applications of human visual attention mechanism in object detection. Infrared Laser Eng. 33(1), 38–42 (2004)
Acknowledgments
This work was supported by the National Nature Science Foundation of China (Grant No. 71471037, 71271053).
Author information
Authors and Affiliations
Corresponding author
Editor information
Editors and Affiliations
Rights and permissions
Copyright information
© 2017 Springer International Publishing AG
About this paper
Cite this paper
Lin, Y., Xue, C., Guo, Q., Zhang, J., Peng, N., Niu, Y. (2017). The Study of Presentation Characteristics of the Warning Information and Its Influence on User’s Cognitive Process Based on Eye Tracking. In: Harris, D. (eds) Engineering Psychology and Cognitive Ergonomics: Cognition and Design. EPCE 2017. Lecture Notes in Computer Science(), vol 10276. Springer, Cham. https://doi.org/10.1007/978-3-319-58475-1_7
Download citation
DOI: https://doi.org/10.1007/978-3-319-58475-1_7
Published:
Publisher Name: Springer, Cham
Print ISBN: 978-3-319-58474-4
Online ISBN: 978-3-319-58475-1
eBook Packages: Computer ScienceComputer Science (R0)