
Abstract
This paper discusses a collaboration between the Army Research Laboratory (ARL) and the United States Military Academy at West Point in teaching the fundamentals of human factors engineering through assessment and experimentation. To facilitate this, the cadets engage in a year-long capstone project where an ARL scientist serves as a mentor, often in conjunction with departmental faculty. This paper discusses a five-phase teaching process to assist in training the fundamentals of research. The five phases are: 1. Identification of research questions and background research. 2. The development of research protocols and their associated training, 3. The selection and understanding of appropriate assessment techniques, 4. The coordination and execution of data collection, and 5. Statistical analysis and reporting. This process uses an existing research experiment at ARL focusing on the impact of different types of display surfaces to support military tactical decision-making to serve as a case study. The research experiment used a hybrid of two research platforms: the Augmented REality Sandtable (ARES) and the Generalized Intelligent Framework for Tutoring (GIFT). An examination of the process as well as perspectives from the cadets assisting with the Perspectives from The ARL/USMA research and the cadets assisting with the research. These perspectives can help with the development of other similar programs aimed at combining research laboratories and academic institutions.
You have full access to this open access chapter, Download conference paper PDF
Keywords
- Military tactics
- Assessment
- Capstone
- Augmented reality sandtable
- Generalized intelligent framework for tutoring
- Cadets
- USMA
1 Introduction
Bridging the gap between theoretical classroom learning and applied experimental research using technology is essential to the education of military cadets [1]. The department of Behavioral Sciences and Leadership (BS&L), engineering psychology program at the United States Military Academy at West Point (USMA) uses human factors engineering to make the classroom-applied connection. The relationship between organizations such as the USMA and the Army Research Laboratory (ARL) provide opportunities for interdisciplinary teams that can contribute to the development of simulation and training systems and the teaching of human factors engineering to cadets supporting the research [2]. Human factors engineering has several different areas of military relevance such as:
-
Human-agent teaming [3]
-
User interface design for command and control [4]
-
Cyber defense [5] and
-
Situation awareness [6].
Human factors engineering, with its challenging and exciting problems, is diverse enough to meet any interest that a cadet may have. During the Fall of 2016, researchers at ARL and USMA decided to put together a capstone project with two cadets, a USMA faculty member, and an ARL researcher, who are the authors of this paper. This paper contributes to the existing literature by providing an Army-specific application to cadet training, guiding proper research techniques during capstone projects.
The capstone has specific requirements such as proposal development, oral presentations, and final reports. This research focuses on additional requirements that target the relationship between the researcher and the cadets while maintaining experimental rigor. These additional requirements sparked the development of a five-phase process that would provide different teaching moments throughout the capstone project. The five phases are: 1. Identification of research questions and background research. 2. The development of research protocols and their associated training, 3. The selection and understanding of appropriate assessment techniques, 4. The coordination and execution of data collection, and 5. Statistical analysis and reporting. Although these phases appear to be self-explanatory, it is the communication and interaction that provide and support positive outcomes.
Examples can assist in solidifying the understanding of a theoretical process. The example for this process is a research experiment involving the Augmented REality Sandtable [ARES, 7] and the Generalized Intelligent Framework for Tutoring [GIFT, 8] to provide an assessment of military tactics knowledge at the squad and platoon level. The experiment assesses the impact of surface projection on the accuracy, time on task, engagement, and physiological responses as cadets answer questions. This research is a follow-up to a pilot study [9] involving Reserve Officers’ Training Corps (ROTC) cadets. There was also a replication study using USMA cadets, which was led by one of the co-authors as a part of another capstone [10].
The structure of this paper is organized as follows: Sect. 2 talks about the specific method used to support the capstone project in two different ways. The first is through the teaching process phases, and the second is the more traditional description of the method of the experiment. Section 3 will cover the effectiveness of the process by discussing the positives and negatives for each one of the phases. Section 4 is a discussion written by the cadet coauthors talking about their experience during the capstone project and working with ARL researchers. Section 5 provides a conclusion with potential recommendations for similar types of programs on the integration of the process and assessment into a military student population.
2 Method
2.1 Teaching Process Phases
Identification of Research Questions and Background Research
The first step in helping the cadets formulate research questions to support the capstone project is to investigate into related literature and find the underlying principles which potentially guide the experimental design. The result of this investigation is a literature review on topics the cadets found interesting as well as the metrics or assessment tools that they can potentially use. The first obvious topic that they wanted to examine was the issue of time on task for decision making. Specifically, do different types of surface projection combinations lead to varying effects on time on task? Past research about different types of projected displays (i.e. 3-D perspective views versus 2-D views) has shown differential effects of task performance based on the specifics of the task and the display [11,12,13,14].
The cadets were also interested in examining areas of human factors engineering where standardized metrics for assessment exist. The two topics they chose were cognitive workload and system usability. The task was to research the various metrics associated with these topics so that they can make an educated decision on which metrics they thought were appropriate. The research question is: do the different display surfaces change the perceived usability of displays or workload of the participants? Existing research has performed comparisons across workload measures [15,16,17] and subjective usability metrics [18, 19]. It is from these three areas (time on task, workload, and usability) that the research protocol was created (Phase 2).
The Development of Research Protocols and their Associated Training
Since the research has an ARL principle investigator (Boyce), the ARL Institutional Review Board (IRB) will serve as the IRB of record. In addition to the required Collaborative Institutional Training Initiative (CITI) Basic Course for Social & Behavioral Research Investigators, which ensures a foundational understanding of human subject protection, the cadets were also familiarized with the various sections of the ARL Protocol template such as background, equipment and apparatus, stimuli, and experimental design. It is from the experimental design that the selection of assessment techniques occurred (Phase 3).
The Selection and Understanding of Appropriate Assessment Techniques
For the evaluation of time on task, the metric used was the amount of time it took a cadet to answer a question, a straightforward calculation. This was in contrast to workload and usability, where new metrics arise on a daily basis, with each one having its strengths and weaknesses.
As a part of their capstone project, the cadets had to submit a report explaining their study and the methods that they were planning to use. When assisting the cadets with the metric selection and reasoning for that selection, consistency and validation of the metrics were essential. The metrics chosen were:
User Engagement Scale (UES)
The UES is a 31-item survey which measures engagement across six dimensions: Perceived Usability, Aesthetics, Focused Attention, Felt Involvement, Novelty, and Endurability [20]. The UES is a modified version with questions reworded to meet the specifics of the military tactics domain.
System Usability Scale (SUS)
The SUS is a 10 item survey that provides participants five response options ranging from strongly disagree to strongly agree. Analysis across ten years of research indicated that the SUS demonstrated strong reliability, Cronbach’s α = .91 [21]. A modified version of the SUS is a part of the experiment with questions reworded to specifically refers to the displays.
Self-Assessment Manikin (SAM)
The SAM is a picture-oriented scale to assess the affect dimensions of valence, arousal, and dominance. SAM is composed of three sets of five figures (manikins), which stand for the three major affective dimensions [22].
NASA-Task Load Index (NASA-TLX)
NASA-TLX uses a six-dimension scale to assess subjective perception of workload. The six dimensions are: mental demand, physical demand, temporal demand, performance, effort, and frustration. After completing a task, participants are asked to rate each factor on a scale from low to high, which is followed by a series of pairwise comparisons to compare how individual dimensions relate to one another [23]. The scale could assist in accounting for variance in performance scores. It has over a 20 year period of research experiments and applications [24, 25].
The Coordination and Execution of Data Collection
Asignificant component of the relationship between ARL and USMA is the actual collection of the data. Data collection requires an identification of the appropriate subject population, the recruitment of that population, the setup of the experiment, and standardizing the execution of the experiment. Then, once the data collection is complete, it consists of backing up data to ensure safe storage.
-
A:
Identification of Appropriate Subject Population – To make sure that the questions that the experiment was asking the cadets were of appropriate difficulty, the second author of this paper (Rowan), performed informal pilot testing with cadets from various class years as well as from instructors who taught tactics content. Instructors that validated the content of the questions taught tactics to a range of military personnel from cadets at USMA to mid-career officers at the US Army Command and General Staff Officer Course. This ensured subject matter expertise validated each question and answer through iterative design. Once the correct population was established, the recruitment can begin through the USMA SONA System. The portion of the SONA system used was the population of cadets enrolled in a general psychology course at West Point.
-
B:
Setup of the Experiment – USMA worked very closely with ARL personnel to ensure that the setup represented an identical setup to that which is in the protocol. It required setting up the appropriate structural supports and technology components as well as ensuring proper alignment of the ARES projection technology (Fig. 1).
Fig. 1. 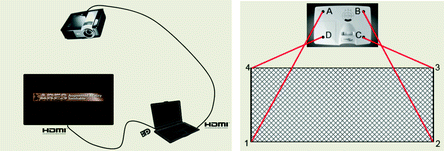
Hardware setup and projection alignment
-
C:
Standardizing the Execution of the Experiment – To keep consistency across the entire research team, the protocol included an experimental script. The script is important in training the cadets how to follow the experimental procedure.

Below is a small example of content from the script:
When the participant comes in:
-
1.
Put up the signs
-
2.
Read the following to the participant
“Thank you for taking the time to participate in this study. Please have a seat so we can fill out the Informed Consent form. An informed consent explains the study and makes sure you understand what you’re going to be doing. Please read through it carefully and let me know if you have any questions. You’ll sign three consent forms: one for your records, one for the Army Research Laboratory (located in Orlando, FL and assisting with the research), and one for the department.”
-
3.
Make sure they sign in the appropriate places also make sure you sign as well. Make sure to give them a copy and put the participant number in the upper right.
-
4.
Start the GIFT Control Panel (desktop shortcut)
The script was also updated as needed to make it easier to follow the instructions (excluding actionable items).
-
D:
Saving and Backing Up Data/Storage Procedures for Personally Identifiable Information (PII) – Since the experiment had hard copies of consent forms as well as the electronic data which was collected by GIFT, the data had to be stored in secure places at all times. With the assistance of the second author (Rowan), the cadets developed a process in which, after participants were finished, they would ensure that the data was in safe and locked storage.
Statistical Analysis and Reporting.
At the time of this writing, statistical analysis is still underway. The method which allows ARL/USMA to work together on statistical analysis is regularly scheduled meetings to discuss research findings based on the hypotheses of the ARL experiment and the USMA capstone.
The structure of these meetings are as follows:
-
1.
Before the meeting, ARL runs the analysis and creates syntax files using SPSS. The cadets also assisted with data entry and cleaning.
-
2.
During the meeting, the ARL/USMA team will address one hypothesis or piece of data, which allows for the focus to be on the rationale behind the technique and the associated data assumptions.
-
3.
For the hypotheses that the cadets are interested in, the role of ARL is to serve as a guide, by having them click the buttons and do the analysis along the way.
-
4.
The cadets can then use the pre-generated syntax files to check their answers.
The hope with an approach like this is that at an undergraduate level, the cadets are receiving applied instruction on the techniques that they learned in their research methods and statistics classes.
2.2 Experimental Method
Brief Summary.
This experiment assessed how displaying information onto different surfaces (flat vs. raised) can influence the performance (i.e. time on task and accuracy) and engagement (i.e. self-report surveys and electrodermal activity) of cadets in answering questions on military tactics.
Experimental Conditions.
There are two experimental conditions: the flat condition consists of questions projected onto a flat white painted board, and the raised condition consists of one of four raised terrain boards which corresponds to the maps of the tactics questions (Fig. 2).

Example of flat projection surface versus a raised projection surface
Participants.
A total of 65 participants provided data for the experiment. The participants were cadets at USMA, West Point in their first or second year of studies at the academy. The reason for the selection of cadets is to support experiment goals of conducting research to support squad and platoon military instruction. The criteria for participation was that the participants were above 18 years of age.
Apparatus and Materials
ARES (Augmented REality Sandtable)
ARES proof-of-concept is a traditional sand table, filled with play sand, augmented with a commercial, off the shelf (COTS) projector, LCD monitor, laptop, and Microsoft Kinect and Xbox Controllers. For this experiment, the ARES projection technology combined with terrain boards was used rather than the actual sand table.
GIFT (Generalized Intelligent Framework for Tutoring)
GIFT is an open source adaptive tutoring engine which can provide tailored learning experiences based on learner attributes. GIFT has recently moved online and is now completely accessible via the web at https://cloud.gifttutoring.org. For this research experiment, GIFT served as a content delivery and data aggregation tool (see Fig. 3 for the combination of ARES and GIFT).

Our team showing the ARES/GIFT combination (Left to Right: Dr. Boyce, CDT Yoshino, CDT Baity, MAJ Rowan)
Microsoft Band 2 Physiological Sensor
The physiological variable of electrodermal activity (EDA) was monitored to analyze physiological response associated with arousal during the answering of the tactics questions. The EDA sensor used for the experiment was the Microsoft Band 2. The Microsoft Band 2 is a wearable, wireless biosensor that measures emotional arousal via skin conductance, a form of EDA that grows higher during states such as excitement, attention, or anxiety and lower during states of boredom or relaxation.
Procedure.
Before their arrival, the participants were randomized and counterbalanced into one ordering of conditions, with either the flat condition presented first or the raised condition presented first, followed by the opposite condition. Upon arrival, participants received a brief overview of the study and were asked to fill out a paper informed consent form. Next, GIFT administered a demographics survey and the Self-Assessment Manikin survey. Following this, participants were asked to wear the Microsoft Band 2, which is an electrodermal sensor that is like a wrist watch.
Next, the participant was given a short introduction via GIFT explaining the scenario and the concepts to be covered in the lesson. This introduction leads into a series of training example slides. It is at this point that the participant was able to ask questions for clarification. They then were placed in the experimental scenario which consisted of military tactics questions followed by self-report surveys for each condition.
3 Effectiveness of the Process
With data analysis still underway, a way of looking at results is to examine the positives and negatives of each of the phases of the process. This provides insight into improvement and awareness of where things went wrong.
Phase 1: Identification of Research Questions and Background Research
Apositive output of this collaboration was the background research in the areas of display design, human performance, and system usability. The combination of sources from ARL, the USMA faculty members, as well as the literature review performed by the cadets, led to a solid understanding of the problem space. However, there were some negatives in Phase 1. ARL, who had already documented research in this area, primarily handled the creation of the research questions. Those predefined research questions narrowed the input that the cadets could have into this phase.
Phase 2: The Development of Research Protocols and Their Associated Training
Building a protocol is essential for performing human-subjects research, and the cadets appeared to do this very well for their class. They understood all the necessary sections to be built into their protocol. They went through the mandatory training, as well as additional discussions with the research team related to looking out for a participant’s well-being. A challenge during this phase was that, since the ARL IRB was the IRB of record, most of the dealings with the protocol were handled by ARL, and, in the end, it was an ARL protocol that was used to run the study. It would have been an interesting experience for the cadets to be interacting with IRB board members/personnel.
Phase 3: The Selection and Understanding of Appropriate Assessment Techniques
The cadets research into the appropriate assessment techniques highlighted this phase. They examined the literature, expanding where they did not have enough sources, and began to understand the need to collect from multiple sources of data to understand the state of the participant. On the downside, this phase suffered from the fact that there were already specific measures in consideration and the cadets might not have wanted to go against the ARL design and bring in more innovative measures.
Phase 4: The Coordination and Execution of Data Collection
This phase was by orders of magnitude the most successful phase from all perspectives. Once the cadets gained familiarity with the experiment, the team could do up to six participants per day. Considering that the target number was 65, it goes to show how productive this relationship can be to gather scores of subject data (with the caveat that the classes have a limited enrollment, so it is a possibility to run out of available participants). On the downside, the number of participants in a brief period led to the potential for errors by the experiment team. Generally speaking, when errors did occur, they were system related.
Phase 5: Statistical Analysis and Reporting
This phase had some positives regarding making the conceptual connections between what the cadets were learning in class and its application to research. It also exposed them to different types of analyses that they may not have seen in class. However, the geographic separation between ARL and USMA forced all of these conversations to occur over the phone. It could have been done in smaller, more frequent sessions if the ARL researchers and the cadets were not so far apart.
Overall the process, while needing some adjustment, was successful at achieving its primary goals: to teach cadets and to produce quality research.
4 Discussion
Cadet Experience – Cadets Michael Yoshino and Devonte Baity
In developing and executing the capstone project for the engineering psychology major at USMA, the opportunity was presented to collaborate with researchers from ARL on existing research efforts, supported by the first author of this paper from ARL. The capstone project for West Point seniors is integrated into our Human Factors Engineering (PL485) and Colloquium in Engineering Psychology (PL488E) capstone courses. The overarching goal is to apply the knowledge and skills learned throughout the major.
In PL485 (Human Factors Engineering) during the first semester of senior year, a literature review was created via a topic paper. This framed our project specifics—research questions, hypotheses, method, experimental design and project outlook—in a proposal paper, and ultimately presented progress both in an oral report and via a final paper. The most involved aspect of the project has been data collection, which required 60 h in the laboratory. ARL collaborated with us on-site at USMA for the bulk of this endeavor, during which there was an emphasis on sound, productive research. From the informed consent form to backing-up data, the proper handling of participants, and troubleshooting the study during a trial, this was a very informative experience. Additionally, the importance of following a script for consistency was stressed early on, and it was certainly a learning process to develop a proper, comprehensive script for the study. Overall, the team was able to make the most out of the time provided as well as participants’ time with efficient, yet proper procedures that were well-rehearsed and executed.
Cadets are provided a substantial statistical background in our curriculum, with Probability and Statistics (MA206) and Applied Statistics (MA376) core courses, yet exposure to data on this scale is rather limited. ARL has been a valuable resource in helping to comprehend findings from data analysis in SPSS and making ties to the existing knowledge from statistics courses. From this, independent conclusions can be drawn from the data to present in the discussion and conclusion of the final capstone paper.
Regarding reservations, the only shortcoming we can identify about this process is the state in which we received it—largely refined and ready for data collection. Moving forward, we will seek further opportunities to play roles in the formative, developmental phases of a research experiment including the determination of theoretical and applied rationales derived from real-world problems as well as the generation of research questions and hypotheses.
5 Conclusion
This paper described a teaching process implemented through experimentation and collaboration with the United States Military Academy at West Point. The process assisted in discussing many of the relevant topic areas in human factors engineering such as proper statistical techniques, method selection, targeted research questions and human-subjects protection. In the end, the findings are producing promising results as well, which only makes the success of the capstone project even stronger.
A few recommendations that may help in the development of future collaborations:
-
Find a way to spend as much time with the cadet as reasonably possible. One of the reasons that this team had such success is because there were many discussions in and out of the classroom related to metrics, human factors engineering, and performing an effective study.
-
For areas like statistical analysis, build in extra time (co-located if possible) to allow for the cadets to understand the techniques and why they are doing them.
-
Help them feel ownership of the project. Project ownership is very important, especially if the researcher has already created their experiment design. However, it is still possible to train cadets to speak confidently and knowledgeably about the research.
Following these recommendations can lead to successful collaboration, use of assessment, and teaching human factors engineering all at the same time!
References
Alexander, A.L., Brunyé, T., Sidman, J., Weil, S.A.: From gaming to training: a review of studies on fidelity, immersion, presence, and buy-in and their effects on transfer in pc-based simulations and games. DARWARS Train. Impact Group 5, 1–14 (2005)
Welch, R.W., Estes, A.C.: Project-based independent study capstone course. In: Structures Congress 2005: Metropolis and Beyond, pp. 1–12 (2005)
Chen, J.Y., Barnes, M.J.: Human–agent teaming for multirobot control: a review of human factors issues. IEEE Trans. Hum.-Mach. Syst. 44, 13–29 (2014)
Hall, D.S., Shattuck, L.G., Bennett, K.B.: Evaluation of an ecological interface design for military command and control. J. Cogn. Eng. Dec. Making 6(2), 165–193 (2012)
Vieane, A., Funke, G., Mancuso, V., Greenlee, E., Dye, G., Borghetti, B., Miller, B., Menke, L., Brown, R.: Coordinated displays to assist cyber defenders. Proc. Hum. Factors Ergon. Soc. Ann. Meet. 60, 344–348 (2016)
Clasing, J.E., Casali, J.G.: Warfighter auditory situation awareness: effects of augmented hearing protection/enhancement devices and TCAPS for military ground combat applications. Int. J. Audiol. 53, S43–S52 (2014)
Amburn, C.R., Vey, N.L., Boyce, M.W., Mize, J.R.: The augmented reality sandtable (ARES) (No. ARL-SR-0340). Army Research Laboratory (2015)
Sottilare, R.A., Brawner, K.W., Goldberg, B.S., Holden, H.K.: The Generalized Intelligent Framework for Tutoring (GIFT). Army Research Laboratory, Orlando, FL (2012)
Boyce, M.W., Reyes, R.J., Cruz, D.E., Amburn, C.R., Goldberg, B., Moss, J.D., Sottilare, R.A.: Effect of Topography on Learning Military Tactics - Integration of Generalized Intelligent Framework for Tutoring (GIFT) and Augmented REality Sandtable (ARES) (ARL-7792). Army Research Laboratory (2016)
Rowan, C., Dustin, M., Peasley, E.: ARES sandtable: the effects on topography on learning military tactics. In: 7th Annual Applied Human Factors and Ergonomics International Conference
Tory, M., Moller, T., Atkins, M.S., Kirkpatrick, A.E.: Combining 2D and 3D views for orientation and relative position tasks. In: Proceedings of the SIGCHI Conference on Human Factors in Computing Systems, pp. 73–80. ACM, Vienna (2004)
St. John, M., Smallman, H.S., Bank, T.E., Cowen, M.B.: Tactical routing using two-dimensional and three-dimensional views of terrain. In: Proceedings of the Human Factors and Ergonomics Society Annual Meeting, vol. 45, pp. 1409–1413 (2001)
St. John, M., Cowen, M.B., Smallman, H.S., Oonk, H.M.: The use of 2D and 3D displays for shape-understanding versus relative-position tasks. Hum. Factors: J. Hum. Factors Ergon. Soc. 43, 79–98 (2001)
Dixon, S., Fitzhugh, E., Aleva, D.: Human factors guidelines for applications of 3D perspectives: a literature review. In: Display Technologies and Applications for Defense, Security, and Avionics III, pp. 73270K-73270K-73211. SPIE
Matthews, G., Reinerman-Jones, L.E., Barber, D.J., Abich, J.: The psychometrics of mental workload multiple measures are sensitive but divergent. Hum. Factors: J. Hum. Factors Ergon. Soc. 57, 125–143 (2015)
Mracek, D.L., Arsenault, M.L., Day, E.A., Hardy, J.H., Terry, R.A.: A multilevel approach to relating subjective workload to performance after shifts in task demand. Hum. Factors: J. Hum. Factors Ergon. Soc. 56, 1401–1413 (2014)
Hill, S.G., Iavecchia, H.P., Byers, J.C., Bittner, A.C., Zaklade, A.L., Christ, R.E.: Comparison of four subjective workload rating scales. Hum. Factors: J. Hum. Factors Ergon. Soc. 34, 429–439 (1992)
O’Brien, H.L., Lebow, M.: Mixed-methods approach to measuring user experience in online news interactions. J. Am. Soc. Inf. Sci. Technol. 64, 1543–1556 (2013)
Hornbæk, K., Law, E.L.-C.: Meta-analysis of correlations among usability measures. In: Proceedings of the SIGCHI Conference on Human Factors in Computing Systems, pp. 617–626. ACM
O’Brien, H.L., Toms, E.G.: The development and evaluation of a survey to measure user engagement. J. Am. Soc. Inf. Sci. Technol. 61, 50–69 (2010)
Bangor, A., Kortum, P.T., Miller, J.T.: An empirical evaluation of the system usability scale. Int. J. Hum.-Comput. Interact. 24, 574–594 (2008)
Bradley, M.M., Lang, P.J.: Measuring emotion: the self-assessment manikin and the semantic differential. J. Behav. Ther. Exp. Psychiatry 25, 49–59 (1994)
Hart, S.G., Staveland, L.E.: Development of NASA-TLX (task load index): results of empirical and theoretical research. Adv. Psychol. 52, 139–183 (1988)
Hart, S.G.: NASA-task load index (NASA-TLX); 20 years later. In: Proceedings of the Human Factors and Ergonomics Society Annual Meeting, pp. 904–908. Sage Publications
Grier, R.A.: How high is high? A meta-analysis of NASA-TLX global workload scores. Proc. Hum. Factors Ergon. Soc. Ann. Meet. 59, 1727–1731 (2015)
Acknowledgements
The research described herein has been sponsored by the U.S. Army Research Laboratory. The statements and opinions expressed in this article do not necessarily reflect the position or the policy of the United States Government, and no official endorsement should be inferred.
Author information
Authors and Affiliations
Corresponding author
Editor information
Editors and Affiliations
Rights and permissions
Copyright information
© 2017 Springer International Publishing AG
About this paper
Cite this paper
Boyce, M.W., Rowan, C.P., Baity, D.L., Yoshino, M.K. (2017). Using Assessment to Provide Application in Human Factors Engineering to USMA Cadets. In: Schmorrow, D., Fidopiastis, C. (eds) Augmented Cognition. Enhancing Cognition and Behavior in Complex Human Environments. AC 2017. Lecture Notes in Computer Science(), vol 10285. Springer, Cham. https://doi.org/10.1007/978-3-319-58625-0_30
Download citation
DOI: https://doi.org/10.1007/978-3-319-58625-0_30
Published:
Publisher Name: Springer, Cham
Print ISBN: 978-3-319-58624-3
Online ISBN: 978-3-319-58625-0
eBook Packages: Computer ScienceComputer Science (R0)