
Abstract
Several methods are available to converge ideas, choosing concepts more suitable for the problem to be solved. Relations between concepts and combination of ideas are limited to time constraints and designers’ cognition during decision-making meetings, let some possible choices not available for discussion. Understanding those constraints, is paramount to propose approaches that take advantage of current technology advances. Nowadays, computers can storage high amount of data and computational algorithms may infer combinations not considered before by humans. Taking this perspective, this text investigates the computational generative design as a tool to evaluate patterns emerged in the ideation phase of a design team creation. Designers can benefit of our approach in the ideation phases of the design process to have insights, unusual and disrupted ideas facilitated by technology.
You have full access to this open access chapter, Download conference paper PDF
Keywords
1 Introduction
Designer teams face creativity challenges when starting a new project. Deciding what is the suitable approach to generate ideas and possible concepts to choose alternatives for a product is one of those challenges. Designers usually question themselves: How to look at known facts with diverse point of views? How to find new answers to old problems? How to escape from obvious solutions and have unusual and original ideas? (Löbach 2001 [15]; Bonsiepe 1984 [2]; Baxter 2000 [1]). In the preliminary stages of the design process, divergent ideas emerge and choices should be taken to converge proposals into design concepts. Several methods are available to converge ideas, choosing concepts more suitable for the problem to be solved. Relations between concepts and combination of ideas are limited to time constraints and designers’ cognition during decision-making meetings let some possible choices not available for discussion. Understanding those constraints, is paramount to propose approaches that take advantage of current technology advances. Nowadays, computers can storage high amount of data and computational algorithms may infer combinations not considered before by humans. Taking this perspective, this text investigates the computational generative design as a tool to evaluate emerged patterns during the ideation phase of a team in the early stages of design process.
2 Design Process and Creativity
Usually design projects consist of more than one person. Even if a project has only one designer, he/she interacts with stakeholders, clients or other project owners. Design process methodologies intent designers to explore ideas with others and communicate results in a set of stages. Following a design process approach facilitates designers to find solutions for problems and builds confidence to justify the solutions chosen giving a rational of why such alternatives would not solve the project problematics. Therefore, there are no optimal solutions to design problems but rather a whole range of acceptable solutions (Lawson 2006) [14] the project team should be aware and discuss.
In traditional design process, designers explore the solution space combining requirements, stakeholder priorities, users and context characteristics, materials, technologies, and processes when generating ideas. New elements can be aggregated by the process in an iterative mode, shaping the solution. Theoretical references have already proposed design process phases: Defining the problem; Ideation; Solution and Materialization and Assessment phase (Bonsiepe 1984 [2]; Löbach 2001 [15]; Baxter 2000 [1]; Bürdek 2006 [5]; Frascara 2004 [8]; Plomp 2007 [18], Brown 2009 [3]). The generating alternative phase is also known as Creativity; Generating ideas and concepts; and Ideation phase. In this phase, several methods and techniques help designers “to think out of the box”, e.g. Brainstorming, Mind mapping, Role playing, Morphological analysis, Reverse thinking, Metaphors and Analogies.
Several designers and researches documented their experiences adopting ideation methods and techniques that might help other designers to follow the design process. Bulley (2013) [4] proposes a technique called Triad. This technique helps teams to explore the identity of a project (e.g. service, product). First the project team brainstorm a list of key words that they would like the product to incorporate. The team chooses combos of three words that would describe the product experience. The team in groups selects combos that are interesting for them and brainstorm for which combo related nouns, verbs and adjectives. According to the author:
-
Nouns help the team think about actors or objects that you might have in the system;
-
Verbs help the team think about actions that the system should support;
-
Adjectives help you think about look, feel and what design principles should be considered
The facilitator, a designer, asks people to exemplify products experiences that people would have illustrated by those words.
In another research, Shi et al. (2017) [21] presents an ideation tool, called Idea Wall, supported by cognitive strategies to facilitate idea generation. It consists of a real-time system that extracts keywords from verbal discussions and augments the discussion with web-search materials. This research extracts information from group conversation, does not have any machine learning intelligence or algorithms to automatic generate ideas.
The use of analogies to assist on creative process during the design process was also explored by researchers (Tomko 2015 [22]; Casakin 1999 [6]; Goel 1997 [10]). According to Gentner and Markman (1997) [9] and Chan et al. (2014) [7] not all analogies strategies result on creative outcomes. Chan et al. (2014) describes that:
Not all analogies are thought to be equally productive for creative outcomes. Many theorists argue that, when considering the analogical distance of sources, far analogies—that is, from sources that have a low degree of overlap of surface elements with the current problem domain—hold the most potential for generating very new concepts. (2014: 2) [7]
Therefore, generating alternatives that not overlap with known concepts have more potential to generate new concepts and innovation. In this paper, we focus on the Ideation phase, using techniques based on analogies, empowered by generative design techniques explained in the next session.
3 A Computational Generative Design Approach
A generative approach consists in design rationale explanations constructed, in response to information requests, from background knowledge and information captured during design process (Gruber and Russell 1996) [11]. Computational generative design applies certain strategies to incorporate the system dynamics into the production of the artefact and experience, such as: permutation, randomness, iterative and feedback looping are the usual ones in a complex field of possibilities. According to McCormack, Dorin and Innocent (2004) [17] the key properties of generative systems are:
-
the ability to generate complexity by database amplification and generate aggregates from existent components;
-
the connection between organism and environment often with feedback loops;
-
the ability to self-maintain and self-repair being adaptable to maintain stable configurations in a changing environment;
-
the ability to generate novel structures, behaviors, outcomes or relationships.
Designers are usually looking for unusual alternatives, novelty in the sense of being new, original and different from anything else before it (McCormack et al. 2004) [17]. Therefore, generative design allows designers to change not only elements by elements but characteristics of elements (e.g. color, composition, forms) and system rules to generate not expected combinations. With the advent of new programming and script languages, designers can codify parametric conditions to search data from WEB, for example, defining how those rules will work to achieve new outcomes and sources.
4 Our Approach
For the phase of generation alternatives and concepts, we have used the transformation method (Bonsiepe 1984) [2], in which the design team members create and suggest analogies of project elements (e.g. keywords, images, sketches, logical operators). The main objective of this technique is the broadening of meaning to assist in generating ideas, by progressively differentiating from the original term based on team members’ subjectivity and personal references. Broadening is a type of semantic change by which the meaning of a word (concept or idea) becomes broader or more inclusive than its earlier meaning. It is an adaptive procedure – combining, recomposing, reversing, replacing – from the obvious to unusual ideas, which can be paradigmatic or not (Kuhn 2013) [13].
We illustrate a scenario to describe how computational generative design is applied to assist design teams in the ideation phase. The visual diagram (Fig. 1) describes the features of a client toolbox, responsible to manage the iterative process of generating ideas.

Visual Diagram
During the search (number 1) the designer team can investigate terms by searching for logic operators (keywords, images) in different databases and getting as results the building blocks (images, videos, texts). After, in the build & share phase (number 2), panel nodes are developed and compose the idea paths in an iterative process; both are saved in a specific collective database (number 6), which manages all searches from different groups. The access to the groups database (number 6) gives the possibility of mapping (number 3) nodes and paths and verifying the similarities/approximations among the searches (images or panel nodes with structural and/or semantic high coincidences). Finally, all mappings and searches are going to be visualized (number 4) as image and text clusters (panels) or tree maps. Possible alternatives can emerge from the connections between searches and idea paths. The actions and iterative resources (number 1, 2, 3, 4) are updated on an interface (toolbox) available for the client level. The actions 5 and 6 are server features.
5 Gathering Data Relations: Ideation Phase with Design Students
Firstly, two words, a noun and a verb – memory and to invent – were proposed to start the process of transformation (the broadening of meaning). There were three groups with two participants in each, and every round those students could only see the last two words, proposed by the previous one, and discuss before writing their ideas. Because of that strategy we had some synonyms and repeated terms, as shown in the Table 1 bellow.
From that part of the design process, some concepts were chosen (in bold) and after a discussion with all participants involved keywords were defined as: imprint and to access, inventory and singularity, to live and mutant – for the second stage of ideation phase.
During the second stage, students search on the web, specifically on the Pinterest photo sharing website (Fig. 2), for visual references connecting concrete objects and concepts based on keywords. The proposal was to put together unusual ideas or thoughts and everyday things, as for example clip, button, clothespin, that could represent actions as to attach, to staple, to congregate, to compose, to assemble, and to organize different parts and diverse materials.

(a) paper clips (Source http://melissaeastondesign.com/paper-clips/); (b) clothespins (Source http://collectionaday2010.blogspot.com.br); (c) buttons (Source http://lemerg.com/data/wallpapers/8/728544.jpg).
After creating an inventory of objects, the proposal for the group was to look at things and to think of contours and shapes and their “relational elements”, as Wong (1972) [23] wrote about form and structure. From that interrelationship “unit forms” were defined and when regrouped it was possible to explore other complex arrangements. The association of repeated forms and their relational placements – “similarity, gradation, radiation” (Wong, 1972: 7–8), gradually structure regular forms, as shown in the Fig. 3. Repetition defines rhythm and ‘encourages our eyes to dance. Controlling repetition is a way to choreograph human eye movement’ (Reas, McWilliams and Barendse 2010: 49) [19], and it is used to construct the visual complexity asked for students.

Objects and forms – lines, circles – formulate patterns.
The form-making process can evoke the formulation of patterns, since they carry formal synthesis potentially. For Hall (1990: 116) [12] ‘patterns are those implicit cultural rules by means of which sets are arranged so that they take on meaning’. For the author, patterns are related to concept model, able to encode data collected into visual expressions and to be later decoded for people when reading and signifying the visual narratives (Fig. 4). It starts from literal and figurative configurations to an unclear set of forces, from physical requirements to diagrams, to structure and to invent forms. Variations, irregularities, and deviations are desired practices to deform and conform not only regular compositions, by including different exercises of elements’ concentration and distribution.

Potential forms and visual configurations.
From that point, the visual proposals have been developed properly thinking about textures and colours to the final composition, and, at the end, defining formats, materials and technical processes of information circulation and distribution, as printed and digital context.
6 Design Interface
The system counts on a range of interfaces which enable the stages of the interactive process. As previously shown, the toolbox system for ideation has two essential phases and responsible for the construction of the cognitive network: Search and Build & Share. Next, we will describe the main interfaces and also the tasks involved in this cycle.
In order to respond for functions that integrate the means of search, construction, selection and network sharing of texts and images, we have segmented the interfaces in three integrated panels: Search Visualization, Image Inspector e Visual Grid (Fig. 5).

Interface Set: Search, Build and Share.
In the Search Visualization panel (Fig. 6), these groups can manage and visualize the construction of an associative network of images extracted from the web. This interface's main purpose is to visualize the brainstorming activity's semantic through keywords input. According to our proposal in offer methods to stimulate creative solutions based on connections between concepts and visual references, the insertion of textual structures serves as a starting point for searching and as a sampling of images references available on public databases online. The algorithmic principle of this interface defines a web crawler type application that browses specific content domains searching for images which metadata and tags matches keywords input. In this process, the application can use the features of several public publishing platform APIs such as Twitter, Pinterest, Flickr, and features offered by Googles engine. In fact, browsing the web and associating content with social tagging contribute to achieving one of the goals of the project which is the semantic expansion based on visual stimuli.

User can load, save and share searching sessions.
Searching
-
(a)
Initially, each group of users has a login identification by which allow them to save and share multiple sessions of searching and results. Each group can make numerous researches and filter/select an unlimited amount of images, since these images are hosted on distributed servers. The constructions of network nodes and associations arise from the text search and also the series of locations (URLs) and the images in form of metadata can be saved and shared hereafter among the process of other’s group (Fig. 6)
-
(b)
The search operation starts on the input field with the insertion of: keywords, operators, regular expressions, URLs or even full block of texts. In the example, we have inserted two keywords (memory, invent) selecting the AND operator. The image content associated with the textual input can be searched in specifics domains by the user (e.g.: memory AND invent IN: URL) or in categories formed by tags organized in social platforms (Fig. 6).
Visualizing
-
(c)
the visual results of search are organized in an interface that groups the images according to their domain’s inception. On the central part of the panel, the application generates interactive diagram that represent a hierarchical structure containing the search description, domains and images. In the example, the circle with dashed black border represents the whole search and inside it, each coloured circle corresponds to a certain search domain (e.g. Twitter) and their grouped contents into clusters of found images. For each conducted search, a new circle will be generate like a cellular structure that can be enlarged through the zooming function. The diagrams can be located or be deleted from the central panel through labeled buttons placed at the panel's bottom (Fig. 7).
Fig. 7. 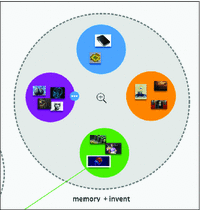
Each search operation is represented by a diagram that encapsulates domain and image clusters.
-
(d)
the visualization of each image and the verification of their metadata can be triggered by direct selection at the domain's cluster. The data will be displayed on the Image Inspector panel and the follow information will be shown: location of the image (URL), the origin domain of the publishing’s feed and others tags or metadata that might be associated (Fig. 8a). On the this panel, the set of tags related to images is represented by buttons. The activated buttons in red (+) symbolize new possibilities of searching and when they are activated they generate a new diagram of search in the central panel. On implementing this feature enables the creation of new searches and associative connections as we will see in the next stage of Broadening.
Fig. 8. 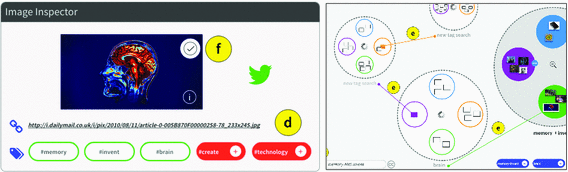
(a) Image Inspector panel represents associated metadata and tags; (b) Broadening process is represented as a network of searching and association paths (Color figure online)


Broadening
-
(e)
In this task, the expansion of the meanings is articulated to the combinatory process of sources, tags and domains extracted from each interaction cycle. Besides the initially text inserted by the user, the semantic context of the results is enlarged by external social tagging, domain content or embedded metadata. In the Image Inspector panel, the activation of a certain tag button connects the reference image to a new search whose keyword is the associated tag itself. In the example, the brain tag has been associated with an image and is used as the input source for a new search (Fig. 8a and b). The interaction of this process can create an interactive network composed by nodes (image clusters) and links (associative connection). The navigation through this network and inside the clusters allows the user to select and to group images that will be part of his repertoire.
Combining
-
(e)
The images selected by the user can be added to a visual matrix formed in the Visual Grid panel. Each selected image in cluster, checked at the Image Inspector panel will be automatically added to a visual matrix. The set of images built during all the processes could be downloaded for use in contexts of subsequent creations (Fig. 9).
Fig. 9. 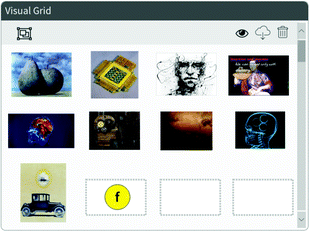
Visual matrix of selected and suitable images.

7 Conclusion and Further Research
The contribution of this paper for a design collaborative process is threefold. First, amplify the semantic field of design possibilities. Second, converge similar alternatives and transformation paths of designer’s insights. Third, a tool for designers manipulate and generate ideas in a visualization system. We are interested on the emergence of unusual ideas, pointing out the process of interconnecting iteratively the logic keys (the path of feedback looping) more than on the standard visual results. It is the protocols process – the formulating patterns structuring that will generate more ideas and concepts for group ideation phase.
It is important to say that the process was proposed for the creation of the visual identity of Anpap (National Association for Fine Arts Researchers) (Fig. 10), and since the idea is to construct a inventory of forms, it will change each month till the annual congress, in September this year. It was designed a visual grid to be shared among Design students, since the creation process was meant to be collaborative with each one creating a visual composition.

(Source: http://anpap.org.br).
Anpap’s first visual identity
We plan to do test our tool with more potential users and other designers to understand better this collaborative generative design tool will assist in generating designer’s ideas and discussions.
References
Baxter, M.: Projeto de Produto. Guiaprático para o design de novos produtos. Blücher, São Paulo (2000)
Bonsiepe, G., Kellner, P., Poessnecker, H.: Metodologia Experimental: Desenho Industrial. CNPq/Coordenação Editorial, Brasília (1984)
Brown, T.: Change by Design: How Design Thinking Transforms Organisations and Inspires Innovation. Harper-Collins Publishers, New York (2009)
Buley, L.: The user Experience of Team of One. Rosenfeld Media, New York (2013)
Bürdek, B.: Design: História.Teoria e Prática do Design de Produtos. Blücher, São Paulo (2006)
Casakin, H., Goldschmidt, G.: Expertise and the use of visual analogy: implications for design education. Des. Stud. 20(2), 153–175 (1999)
Chan, J., Dow, S.P., Schunn, C.D.: Do the best design ideas (really) come from conceptually distant sources of inspiration? Des. Stud. 36, 31–58 (2014)
Frascara, J.: Communication Design – Principles, Methods and Practice. Allworth Press, New York (2004)
Gentner, D., Markman, A.B.: Structure mapping in analogy and similarity. Am. Psychol. 52(1), 45 (1997)
Goel, A.K.: Design, analogy, and creativity. IEEE Expert 12(3), 62–70 (1997)
Gruber, T.R., Russell, D.M.: Generative design rationale: beyond the record and replay paradigm. In: Moran, T.P., Carroll, J.M. (eds.) Design Rationale: Concepts, Techniques, and Use, pp. 323–349. Lawrence Erlbaum, Mahwah (1996)
Hall, E.T.: The Silent Language. Anchor Books Editions, Garden City, New York (1990)
Kuhn, T.S.: Aestrutura das revoluçõescientíficas. Perspectiva, São Paulo (2013)
Lawson, B.: How Designers Think. Architectural Press, Oxford (2006)
Löbach, B.: Design Industrial: bases para a configuração dos produtos industriais. Blücher, São Paulo (2001)
Maeda, J.: Design by Numbers. The MIT Press, Cambridge (2001)
McCormack, J., Dorin, A., Innocent, T.: Generative design: a paradigm for design research. In: Proceedings of Futureground. Design Research Society, Melbourne (2004)
Plomp, T.: Educational design research: an introduction. In: Plomp, T., Nieveen, N. (eds.) An Introduction to Educational Design Research. Proceedings of the seminar conducted at the East China Normal University, Shanghai (PR China), 23–26 November. SLO, Netherlands Institute for Curriculum Development The Netherlands (2007)
Reas, C., McWilliams, C., Barendse, J.: Form + Code in Design, Art, and Architecture. Princeton Architectural Press, New York (2010)
Schunn, C., Chan, J.: The impact of analogies on creative concept generation: lessons from an in vivo study in engineering design. Cognitive Sci.
Shi, Y., Wang, Y., Qi, Y., Chen, J., Xu, X., Ma, K.L.: IdeaWall: improving creative collaboration through combinatorial visual stimuli. In: Proceedings of the 2017 ACM Conference on Computer Supported Cooperative Work and Social Computing, pp. 594–603. ACM, New York (2017)
Tomko, M., Lucero, B., Turner, C., Linsey, J.: Establishing functional concepts vital for design by analogy. In: 2015 IEEE Frontiers in Education Conference (FIE), pp. 1–8 (2015)
Wong, W.: Principles of Two-dimensional Design. Van Nostrand Reinhold Company, New York (1972)
Author information
Authors and Affiliations
Corresponding author
Editor information
Editors and Affiliations
Rights and permissions
Copyright information
© 2017 Springer International Publishing AG
About this paper
Cite this paper
Paraguai, L., Candello, H., Costa, P. (2017). Collaborative System for Generative Design: Manipulating Parameters, Generating Alternatives. In: Marcus, A., Wang, W. (eds) Design, User Experience, and Usability: Theory, Methodology, and Management. DUXU 2017. Lecture Notes in Computer Science(), vol 10288. Springer, Cham. https://doi.org/10.1007/978-3-319-58634-2_52
Download citation
DOI: https://doi.org/10.1007/978-3-319-58634-2_52
Published:
Publisher Name: Springer, Cham
Print ISBN: 978-3-319-58633-5
Online ISBN: 978-3-319-58634-2
eBook Packages: Computer ScienceComputer Science (R0)