
Abstract
With the development of e-commerce, the business competition has risen significantly. Moreover, the channel of retail in Taiwan has evolved from single channel to multiple channels. Nowadays, customers’ loyalties are not easy to retain due to a large number of choices of chain stores, warehouses, and e-commerce in the market. When a desired product is not available in one place, customers can still easily obtain it or choose the substitution by visiting other physical locations or the Internet, which results in loss of customer loyalty for a business. Therefore, as customer can easily change his mind in the multiple channels, how to rapidly understand customer needs is very important. This paper focuses on a development of omni-channel analytics solution platform using the field in cosmetics business as a demonstration. The platform provides business solutions to help corporations better understand their own brands and products sensibility in different merchandised channels, what customers really see and how they react. We provide a spectrum of techniques including data matching, aspect sentiment analysis, an integration and analysis of online auctions, online forums and social networks and other sources of data, such as real-time detection of sales trends or customers’ evaluation and response of the goods. With these valuable information, an advantage of understanding market trends in order to immediately develop market strategies and advanced knowledge of various events influenced by positive and negative effects can all be expected to help the industries prevail against competitors and win public opinions.
You have full access to this open access chapter, Download conference paper PDF
Keywords
1 Introduction
If marketing has one goal, it’s to reach the moments that’s most influential to consumers’ decisions. Every day, impressions of brands awareness developed from physical and digital touch points such as TV radio advertisements, social media, and conversations with friends and family (word of mouth), etc. These accumulated impressions then shape into initial consideration, which becomes a potential auction. Along with interested products in mind, consumers turn to social media for more researches or visiting in-store to have a clear visualization. In modern society, social network websites have become one of the major conduit for people to communicate, comment and interact with each other; potential buyers can share or learn about consumer products through platforms and online reviews. After acquisition, consumers then share experiences and opinions toward the product as a reference for other future potential consumers.
Within the path of consumer journey (Fig. 1), consumers have enlarged its contact point of brands through different advertisement, yet a possibility loss in brand loyalty from competition might occurred. When a big interest hits a specific product, some channels faced an inventory shortage, which results in a possibility of consumers buying alternative products. For example, some portion of customers turn to Panasonic EH-NA65-K hair dryer when its competitor, Dyson Supersonic, was out of stock. Besides the issues of inventory shortage, competitive pricing also plays a big role in possible loss of brand loyalty. Due to uncertain market trends and easy access to various channels, brands have difficulty in pricing control and sales condition; therefore, some services have been proposed to help solve this challenge. For instant, Google Shopping [1] provides buyers a commodity parity analysis, but lack in sales and competitive analysis; 生意參謀 [2], a Chinese business analysis platform developed by Alibaba, provides business solution of sales, competitive products, and sentiment analysis for a single channel, yet information of multi-channel is missing. Therefore, So Fashion [3], an omni-channel commerce solution is developed to aids corporations enhance their sensibility towards the features of different merchandised channel in the market. It collects various retail channel transactions and consumers’ reviews from multiple e-commerce platforms. Because dealing with inter-access road between the various commodity names are inconsistent, a proposal of data matching method is developed to help solving this problem.

An example of Path of consumer journey
Given that millions of products are sold, reviewed, and discussed on the internet, social media and shopping websites are important sources to collect sales information and user opinion. However, an issue of same item with different names sold by different merchants within different websites rise. Furthermore, such data is mostly not well structured and often contains missing or wrong values. For integrating and utilizing this kind of information on the internet, matching entities from heterogeneous data sources is an importance task. There are many studies aimed to overcome the entity matching challenge, such as Kannan et al. [5], Li et al. [8], and Zhang et al. [9]. There are also surveys of entity matching methods, such as Elmagarmid et al. [4], Köpcke and Rahm [6], and Köpcke et al. [7]. The difficulty of entity matching is varied among different types of entity. The difficulty levels of matching different entities evaluated according to related works and our experience are shown in Fig. 2.

Difficulty levels of matching different entities
The rest of the paper is organized as follows: Sect. 2 defines the overall architecture of omni-channel merchandising analytics solution and Sect. 3 proposes So Fashion, a big data analytics solution for Omni-Channel Merchandising, using the field in cosmetics business as a demonstration. Concluding remarks are given in Sect. 4.
2 Proposed Framework
In this chapter, we describe our omni-channel merchandising analytics solution. Figure 3 shows the overall architecture of this solution. The solution is decomposed into three parts: data gathering, data matching method and analytics as a service. First, by using crawler technique, we implement our solution on real datasets in cleansers domain containing data from three auctions platform, i.e., Yahoo! Auction, Ruten Auction, and Taobao Auction and one forum, i.e., Urcosme. Second, we utilize data matching technique to deal with the product names inconsistencies problem on different channels. Then, by using some analysis methods, i.e., regression, principal component analysis, data mining, sentiment analysis etc., we provide three analytics as a service. We will describe data matching technique in detail in the following paragraphs.

Overall architecture for omni-channel merchandising analytics solution
Data matching, also called entity resolution, entity matching, duplicate identification, record linkage, or reference reconciliation, is the technique identifying different manifestations of the same real world object from different data source. The example of framework matching beauty products among auction sites in this paper is shown in Fig. 4. In this framework, we first generate a duplicate-free standard product list with a reference beauty website. For each offer in the auction sites, we estimated the total similarity between this offer and each product in the standard product list. We first match an offer to the most similar product in the standard product list, and then verify this matching with a classifier.

The example of framework of data matching
There is an example of the standard product list in Fig. 5. We choose Urcosme (www.urcosme.com), a beauty product review website in Taiwan, as our reference website. For each beauty product in Urcosme, we collected the category, brand, and product name to generate a standard product list.

An example of standard product list
Assume o i is the i th offer in the auction sites, and sp j is the j th product in the standard product list. TS(o i , sp j ), the similarity between o i and sp j , is estimated by:
where EBS(o i , sp j ), CBS(o i , sp j ), EPS(o i , sp j ), and CPS(o i , sp j ) are similarities of English brand, Chinese brand, English product, and Chinese product between o i and sp j , respectively which can be calculated by edit distance approaches. Different from traditional data matching tasks, the corresponding brand and product name of an offer in an auction website reside in an unstructured text and does not have attribute values with these offers. We used sliding windows to segment the title for each offer. An example is shown in Fig. 6. In this example, The Chinese brand of sp 4236 is “蜜妮”, and the title of o 9566 is “Biore蜜妮 抗痘調理洗面乳 100 g”. To evaluate CBS(o 9566, sp 4236), the similarity of Chinese brand between sp 4236 and o 9566, a sliding window with window size two is applied on the title, and generated segments “io”, “or”, “re”, …, and “0 g”. The similarity between each segment and “蜜妮” is calculated respectively, and the biggest one is the value of CBS(o 9566, sp 4236). The value of EBS(o i , sp j ), EPS(o i , sp j ), and CPS(o i , sp j ) are calculated likewise.

An example of the similarity estimation
3 System Implementation
In this paper, we proposed So Fashion, a big data analytics solution for Omni-Channel Merchandising, using the field in cosmetics business as a demonstration. So Fashion collected various retail channel transactions and consumers’ reviews from multiple e-commerce platforms and social networks. Through data analysis technique, So Fashion aids brand corporations enhance their sensibility towards the features of different merchandised channel in the market, supply and demand of the goods, as well as the competitions from the market. In this platform, it provides five analysis modules to help corporations better understand their own brands and products sensibility in different merchandised channels, what customers really see and how they react. Next, we introduce these analysis modules, respectively.
-
Sales Ranking: Through integration and analysis of cross-border trading platform, this analytic service helps the business immediately manipulates the sale transactions, based on brand and category, of different channel. Figure 7 shows the variety of sales ranking. Moreover, an issue of different volume size of a same product can impact significantly in sales ranking. Therefore, we utilize a conduct of parser enable to separate and calculate the sales according to its volume, which provide the information about consumers purchasing trend in different trading platform. In the example of Fig. 7, due to selling 93 pieces of product samples, “全效活膚潔面乳” receives its second place in this week’s ranking. In addition, we realize that product samples are most popular within C2C trading platform.
Fig. 7. 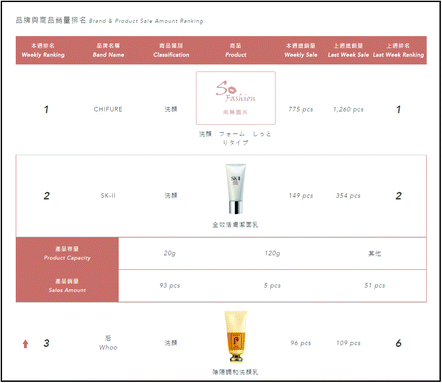
An example of sales ranking
-
Competitor Analysis: Based on consumer evaluation of commodity, this module explores the representative characteristics of products or brand competition. The competitor analysis module consists of two parts, Aspects of Competitor Comparison and Perceptual Bubble Chart. Certain types of documents, such as customer feedback or reviews, may contain fine-grained sentiment about different aspects of the entities (e.g. a product or brand) that are mentioned in the document. For instance, a review about a facial cleanser may contain opinionated sentences about its cleansing, moisturizing, price, ingredients, odor and other functionalities. This information can be highly valuable for understanding customers’ opinion about a particular brand or product. Using the comparison of Aspect-based Sentiment Analysis, industry can better monitor their reputation, understand the needs of the market and comprehend the competitive advantage. Figure 8 shows the example of Aspects of Competitor Comparison. The radar chart shows evaluated aspects scores of each brand or product. The donut chart shows the percentage of particular aspect from different sources. In the Fig. 9, each of three colored bubbles represents three different competitors, and the grey bubbles means the representative characteristics of a brand or a product. There are three different connections within these bubbles. First, the closer concentration between colored and grey bubbles indicates the characteristics of each user’s comments which are frequently discussed. The distance relationships between grey bubbles represents the correlation of numbers of time that are mentioned in comments. Last, the closer the colored circles are, the stronger associates and characteristics they have in common.
Fig. 8. 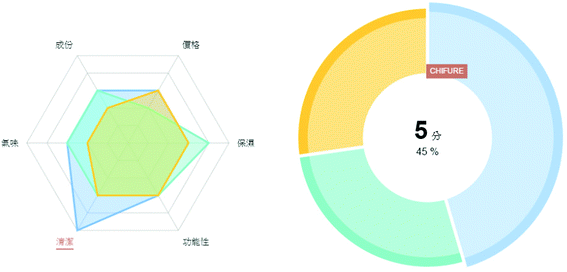
An example of aspects of competitor comparison
Fig. 9. 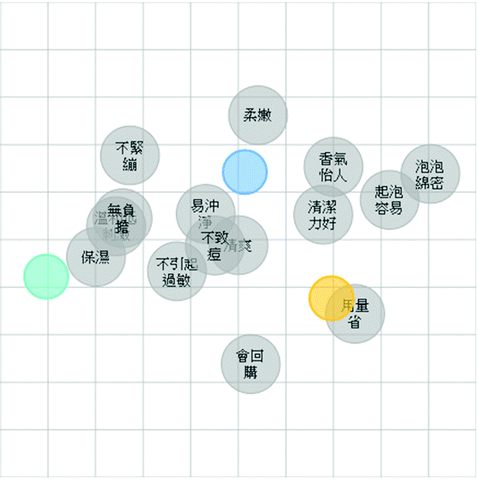
An example of the representative characteristics of products or brand competition
-
Sales Overview: In this analysis module, it provides the different level of transactions from brand, category to commodity and understands business position in various time interval by integrating and analyzing the cross-border large-scale e-commerce platform information. The information of brand’s or commodity’s historical sales and sales prediction is shown in Figs. 10 and 11, respectively. Figure 12 shows the association analysis of commodities, outer circle lists of commodities indicate what consumers also discussed along with acquisition. Figure 13 presents socio-demographic information about reviewers along with the reviews. It provides three types of reviewers’ statistical information, i.e., age, skin and sign, for specific brand or merchandise.
Fig. 10. 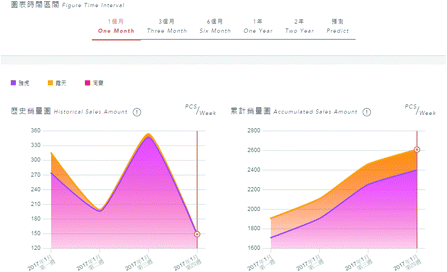
An example of the information of brand’s or commodity’s historical sales
Fig. 11. 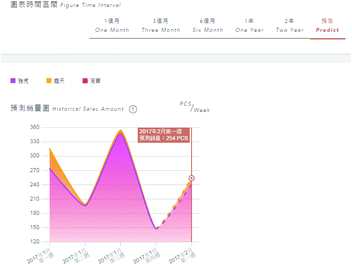
An example of the information of brand’s or commodity’s sales prediction
Fig. 12. 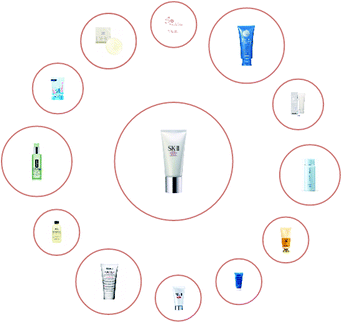
An example of association analysis of commodities
Fig. 13. 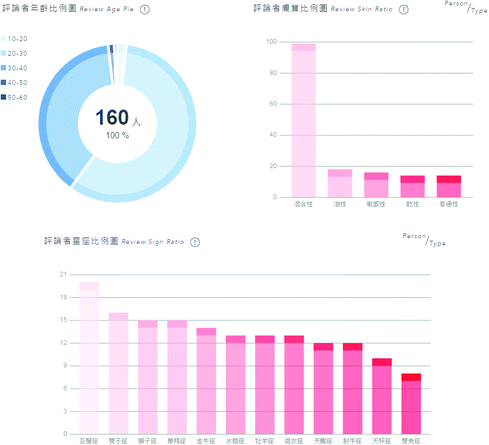
An example of socio-demographic statistical information
-
Price Comparison Analysis: In this analysis service, it provides users to search for products on online shopping websites and compare prices between different vendors. The example of price comparison result is shown in Fig. 14. Figure 15 presents the distributions of stores and sales by integrating the price information of commodity.
Fig. 14. 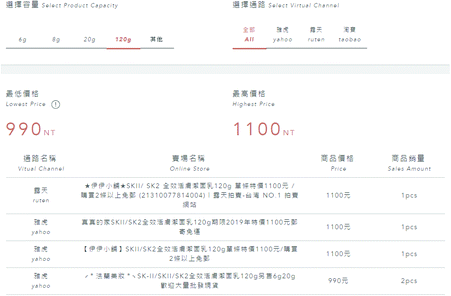
An example of price comparison
Fig. 15. 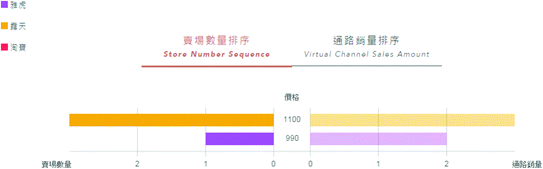
An example of distributions of stores and sales
-
Opinion Mining: Mining and summarizing opinions from users’ reviews about specific brands or products and their aspects- can help brand industry decide what to businesses to better monitor their reputation and understand the needs of the market. Therefore, in this service, it provides three analysis results, product keywords, product aspect radar chart and the frequencies of commodity discussion. Tag clouds visualization application (Fig. 16) is the text-based visual representations of a set of tags shows the product keywords based on consumer experience posts/reviews from social network. Figure 17, product aspect radar chart, shows evaluated aspects scores of each brand or product. Moreover, it can list three positive and negative polarity representative sentences, respectively. Figure 18 shows the product discussion trend based on different time interval.
Fig. 16. 
An example of product keywords
Fig. 17. 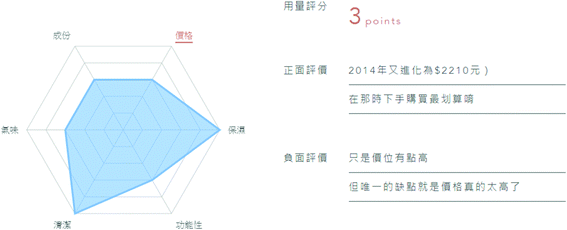
An example of product aspects analysis
Fig. 18. 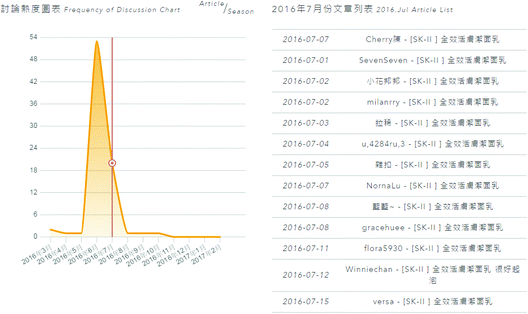
An example of product discussion trend


4 Conclusions
In conclusion, the paper summarizes some important highlights. Our omni-channel merchandising solutions provide a better way for brand industries to maximize sales and shopper loyalty. In order to solve the problem of product names inconsistencies, we utilize data matching technique to identify different manifestations of the same real world object from different data source. Therefore, we propose a development of omni-channel analytics solution platform using the field in cosmetics business as a demonstration.
References
Google shopping. https://www.google.com/shopping
So Fashion. http://sofashion.com.tw/cosmetic/login.html
Elmagarmid, A.K., Ipeirotis, P.G., Verykios, V.S.: Duplicate record detection: a survey. IEEE Trans. Knowl. Data Eng. 19(1), 1–16 (2007)
Kannan, A., Givoni, I.E., Agrawal, R., Fuxman, A.: Matching Unstructured Product Offers to Structured Product Specifications (2011)
Köpcke, H., Rahm, E.: Frameworks for entity matching: a comparison. Data Knowl. Eng. 69, 197–210 (2010)
Köpcke, H., Thor, A., Rahm, E.: Evaluation of entity resolution approaches on real-world match problems. Proc. VLDB Endowment 3(1), 484–493 (2010)
Li, L., Li, J., Gao, H.: Rule-based method for entity resolution. IEEE Trans. Knowl. Data Eng. 27(1), 250–263 (2015)
Zhang, D., Rubinstein, B.I.P., Gemmell, J.: Principled graph matching algorithms for integrating multiple data sources. IEEE Trans. Knowl. Data Eng. 27(10), 2784–2796 (2015)
Author information
Authors and Affiliations
Corresponding author
Editor information
Editors and Affiliations
Rights and permissions
Copyright information
© 2017 Springer International Publishing AG
About this paper
Cite this paper
Liao, CY., Wu, CC., Hsu, YL., Chen, YC. (2017). Analytics Solution for Omni-Channel Merchandising. In: Antona, M., Stephanidis, C. (eds) Universal Access in Human–Computer Interaction. Human and Technological Environments. UAHCI 2017. Lecture Notes in Computer Science(), vol 10279. Springer, Cham. https://doi.org/10.1007/978-3-319-58700-4_37
Download citation
DOI: https://doi.org/10.1007/978-3-319-58700-4_37
Published:
Publisher Name: Springer, Cham
Print ISBN: 978-3-319-58699-1
Online ISBN: 978-3-319-58700-4
eBook Packages: Computer ScienceComputer Science (R0)