
Abstract
Complex diseases are typically caused by joint effects of multiple genetic variations, rather than a single variant. Multiple single nucleotide polymorphism (SNP) interactions, epistatic interactions, potentially provide information about the causes of complex diseases, building on studies that focus on the association between single SNPs and phenotypes. However, execution of epistatic methods on desktop computers is not practical, owing to the huge number of interactions that have to be calculated. These models have tended to be command line based, presenting a barrier for users such as biologists that are not comfortable with this environment. To overcome this, we present a framework with a front-end GUI deployed on a cluster that allows users to analyse genotype/phenotype correlations using computationally accelerated epistatic models. The parallel processing of the data results in a typical epistatic analysis taking a few days, presenting a feasible approach for the analysis of genetic variants associated with disease.
You have full access to this open access chapter, Download conference paper PDF
1 Introduction
Technological advancements in the last decade have led to a remarkable increase in the amount of biological data produced. These data can be used to investigate human disease, with one particular data type, single nucleotide polymorphisms (SNPs), widely used to uncover genetic variations that are associated with phenotypes of interest. By comparing the frequency of variants between cases and controls in genome wide association studies (GWASs), SNPs have been linked to a number of diseases, such as breast cancer [1] and hypertension [2]. However, it is widely agreed that complex diseases are due to the joint effects of multiple genetic variations, rather than a single variation [3], and this might explain why numerous studies have only uncovered alleles with a low genotype risk. As such, epistatic interactions, interactions between SNPs, can potentially provide insight about the causes of complex diseases, and build on GWASs that investigate the association between single SNPs and phenotypes.
A number of models have been proposed to search for epistasis e.g. [4, 5]. However, implementation of these methods on typical desktop computers is generally not practical, as a large number of interactions have to be calculated. For example, a relatively small GWAS dataset with 100,000 SNPs has 5 × 10⁹ pairwise interactions. Using the FaST-LMM method [5], the search for these pairwise interactions would take approximately two years on a desktop computer. This does not present a viable approach for researchers. In order to overcome this, high performance computing (HPC) and cloud computing facilities can be taken advantage of, and the analysis can be deployed across multiple cores or instances. By splitting the analysis into various tasks, these can be executed in parallel, resulting in a significant speedup in the execution time. As a result, the exhaustive search for epistasis can be carried out in a relative short time span, presenting a feasible analysis tool.
It should also be noted that the majority of these epistatic models are deployed using command line interfaces. One of the main challenges facing bioinformatics is to ensure that experts from across all biomedical domains are able to process biological data via user-friendly solutions [6]. In response to this, there has been an increase in recent years in the popularity of workflow management systems (WMSs) that allow the deployment of workflows that piece together separate analyses often carried out by different software packages. Workflows are becoming increasingly important in the area of bioinformatics, allowing complex analyses to be carried out and shared. A number of WMSs have gained prominence, with Chipster [7], and Galaxy [8] amongst those widely used. By offering increased usability and accessibility typically via a GUI, they allow users that do not possess specialist programming skills to run tools and workflows that would otherwise require command line operation or competence in programming language skills. Additionally, as users are able to publish and share their analyses via the internet, WMSs offer robustness, transparency, re-usability, and reproducibility [9, 10].
In this work, we present a prototype implementation of a Galaxy-based framework that uses a HPC cluster in order to reduce the time needed to analyse the data, and Spotfire for creating Galaxy-embedded visualisations that allow the user to interactively explore the results. Galaxy has been chosen due to its wide user base and active developer community; thereby allowing tools and workflows to be easily shared with other researchers via tool sheds. These tools sheds are open resources that function in a similar way to “app stores”, and allow resources such as Galaxy tools and workflows to be shared amongst researchers. The main Galaxy tool shed is found at: https://toolshed.g2.bx.psu.edu/. In addition, the creation of a custom instance avoids issues such as long wait times for job execution, storage quotas, and bottlenecks uploading and downloading data associated with the main server. The custom instance offers a standardised, easy-to-use interface, allowing users such as clinicians and biologists that are not comfortable with command line and programming language environments to easily deploy epistatic analysis tools. In addition, these tools in the framework have already been configured to run on the HPC cluster, thereby enabling the analysis to be carried out with the required computational power. Furthermore, a number of pre-defined execution options are provided, removing the need for the end user to configure resource allocation scripts, and the authentication step is also simplified through the use of certificates. More details about the underlying infrastructure can be seen in Figs. 2 and 3 in the Infrastructure section, whilst further details about the framework are provided in the following section.
Finally, it should be noted that the HPC facilities at the University of Malaga have been used to validate the cluster-based deployment of the framework, and that the framework can be easily adapted to other computational resources. In the same vein, the use of the epistasis tools also provides a means by which to validate the ‘generic’ framework of Galaxy with Amazon S3 for data storage, and Spotfire for visualisation and exploration.
2 Galaxy Implementation
Two widely used epistatic analysis tools are implemented in the custom Galaxy instance; the linear regression based method BOOST [4], and the linear mixed model based FaST-LMM [5]. These two models have been chosen as they both test all pairs of SNPs in the dataset for association with phenotypes, typically case and control, returning a p-value for each tested pair. Therefore, they both require substantial computational power. In addition, they are both deployed via the command line, and have also been used in a number of previous studies, such as those by Lippert et al. [11] and Tao et al. [12]. An all-in-one easy-to-use workflow is also available for end users seeking a complete analysis protocol. This workflow is shown in Fig. 1, starting with data in the raw .CEL format. Subsect. 2.1 details the steps that make up this workflow, as well as detailing the software that would typically be used for each step, thereby highlighting the advantages of an all-in-one approach, rather than multiple software steps required.

Steps in the workflow

Underlying infrastructure for single association and epistatic analysis

Infrastructure for visualisations created by Spotfire

Manhattan plot and network visualisations created by Spotfire Web Player
2.1 Workflow Steps
The workflow above also incorporates single association analysis. This has been incorporated as it is probable that the end user will be interested in comparing the single association results with the epistatic results, and also in case the user has the data in raw format. The main advantage of carrying out the workflows using Galaxy is that the end-user can perform all these steps in just one click, instead of having to use different programming languages and command line tools. The individual steps involved are detailed below.
-
(1)
The first step is for the end user to upload raw .CEL files, and apply the birdseed v2 algorithm, using Affymetrix Power Tools. The first two steps that take the .CEL files and convert them to .VCF format is a Galaxy implementation of genCloud [13], a pipeline for converting .CEL to .VCF files suitable for analysis. This has been provided as it is likely that a number of researchers will have raw data, but will not be comfortable with the computational steps required to convert this to a suitable analysis format. By taking advantage of the facilities offered by the cluster, this step can be greatly speeded up by processing each of the .CEL files in parallel, rather than serially.
-
(2)
The next step is to convert the birdseed output to .VCF format. Along with the previous step, this step is also part of the genCloud pipeline [13].
-
(3)
It is also possible that the end user might already have the data as .VCF files. The next step is to convert this to PLINK [14] binary format, using PLINK.
-
(4)
Next, a number of quality control procedures are carried out on the data. Various procedures are implemented; these include call rate >98%, and minor allele frequency >0.05.
-
(5)
Single SNP association analysis is carried out using the default PLINK settings, that compares allele frequencies between cases and controls. The output is a list of all the SNPs that passed the previous quality control steps with various fields, including the p-value for each SNP for the case-control test.
-
(6)
Epistatic analysis of the data is then carried out using HPC facilities, due to the computationally intensive nature of the operation. The end-user can select from two available epistatic analysis methods; BOOST, and FaST-LMM. The default setting is for the analysis to be split into 400 tasks, and deployed on the HPC Picasso facilities at the University of Malaga.
-
(7)
The next step is to join the results from the tasks together, and remove interactions between SNPs located within 1 Mb of each other. This step is taken to remove potential false positives possibly due to proximity [15].
-
(8)
SNPs involved in significant interactions after Bonferroni correction and filtering are mapped to the closest protein-coding gene within a flanking distance of 500 Kb. This is performed using Spotfire, with the information about the closest protein coding gene generated from the R library Postgwas [16].
-
(9)
The final step is to visualise the results from both the single association, and epistatic analysis. This is done using the TIBCO Spotfire Web Player [17]. Single association results are typically displayed on a Manhattan plot; this plots the genomic co-ordinates of the SNPs on the X axis, and the negative log10 value of the single association p-values for each SNP on the Y axis. Figure 5 shows a Manhattan plot obtained from a previously published dataset. This interactive Manhattan plot allows the end user to specify a threshold based on −log10 p-value, and in addition to displaying the SNPs that have a p-value greater than this threshold, will also display additional information such as the closest protein coding gene to the SNP. The interactions of the protein-coding genes that the SNPs map to is visualised using the D3 JavaScript library [18], and displayed in a Galaxy frame with the Manhattan plot underneath. This enables the user to easily compare the single association and epistatic analysis results visually.
Fig. 5. 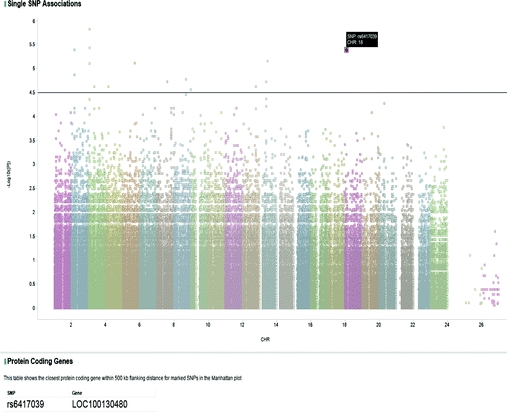
TIBCO Spotfire Web Player Manhattan Plot

3 Infrastructure
In order to carry out steps 1–7 shown in Fig. 1, a number of underlying infrastructure processes have to be carried out. These are shown in the diagram below.
-
(1)
Galaxy executes a Web-Service client with the tool to execute (must be in pre-configured white-list) and the parameters (files).
-
(2)
The client uploads the parameters to an Amazon S3 compatible storage. This could be Amazon S3 instance or any of the many S3 API compatible data storages (e.g. OpenStack). Client requests a temporary URL which is valid for a specified time-frame.
-
(3)
The client invokes the Web-Service Frontend (pre-configured) with the tool to invoke and a list of URLs where the data is available. Before accepting the job, the WS Frontend confirms that the tool is in the white-list of available tools and that the parameters are valid. If so, the Frontend places the job in a queue and returns a job identifier which the client will use to check for status and retrieve the results (status polling not shown in this figure).
-
(4)
The Frontend downloads the parameters specified from the S3 data storage.
-
(5)
When the job is in the front of the queue, the Frontend executes the tool. Note that the execution could be local or remote (e.g. in a HPC machine).
-
(6)
Once ready, Frontend uploads results to an S3 Data Storage. Depending on the configuration, could be a different storage than used by the client. Once uploaded, the Frontend requests temporary URL and sets job-status to ready.
-
(7)
Once the client has determined that the job has finished, it requests the Result(s) URL(s) generated in step 6.
-
(8)
Client downloads data from the S3 Data Storage using temporary URL(s).
-
(9)
The client finishes the execution and reports the results to Galaxy.
Galaxy can be extended with visualisations for specific datatypes. In this case, we configured Galaxy to visualise the single association and epistatic analysis results using the Spotfire WS API. The Spotfire WS API is a flexible component, developed as part of the Mr. SymBioMath project, which extends the Spotfire visualisation platform with automatisation features; specifically it allows the remote, programmatic control of Spotfire using IronPythonscripts. The communication between Galaxy and Spotfire is through a restful web-service where the requests are saved in a queue and Galaxy (through a JavaScript page) periodically checks for the progress. Spotfire has been used here, as it allows rapid prototyping, integration with D3, and additional information to be loaded for the visualisation that offers added value to the end user. The procedures needed for steps 8 and 9 in Fig. 1 are shown in Fig. 3 below.
-
(1)
Galaxy requests the visualisation from the Spotfire WS API, with the URL of the single associations from PLINK and the multiple SNP associations, i.e. epistatic analysis from FaST-LMM, together with the name of a pre-configured script which will generate the visualisation. This script performs steps 2–6 below.
-
(2)
The script loads a prepared visualisation from the Spotfire Server.
-
(3)
Data are then loaded from Galaxy using specified URL into the visualisation.
-
(4)
Once the data are available, the script replaces the data table in the visualisation with the new data.
-
(5)
The new visualisation is saved in the Spotfire Server.
-
(6)
The Spotfire WS returns a URL to a Spotfire Web-Player document. This document can be loaded in standard Web-Browsers in most platforms (Windows, Linux, Mac OSX).
4 Validation
In order to test the implementation of the Galaxy tools, two testing stages are employed, each with a different dataset. First, in order to measure speedup of the epistatic analysis obtained by using the epistatic tools deployed on the cluster that are accessed via Galaxy, a simulated dataset of 10,000 SNPs much lower than typically found is used. This reduced dataset permits the epistatic analysis to be carried out in a reasonable time frame using a single core on the cluster, providing a benchmark figure against which to compare the execution times with multiple cores, and also simulating the performance of a single core desktop computer. This implementation is compared against 50, 100, 200, and 400 cores for both epistatic methods. Table 1 below shows FaST-LMM and BOOST execution times for this 10,000 SNP dataset for the different configurations on the HPC facilities, with speedup shown in brackets.
Note that a maximum speedup of 390 for FaST-LMM execution is obtained with 400 cores compared to the single core execution, with almost linear speedups for all of the different FaST-LMM configurations. This is not the case for BOOST, possibly due to the time taken for data transfer, and also the short execution time of the method using a single core. This is reflected in the noticeably different execution times of the epistatic methods, due to the different underlying models used by both; linear regression compared to a linear mixed model. Having obtained considerable speedups for the simulated dataset, particularly for FaST-LMM, the next step is to test the tools with a typical dataset. For this, we will repeat the analysis of a previously published epistatic study [19]. After carrying out quality control procedures, as detailed in step 4 in Subsect. 2.1, 764,537 SNPs remain. One of the advantages of using a dataset from a previously published study is that it is possible to compare the results obtained with those published. In this case, it is possible to validate the results obtained for the single association analysis from the original study [20]. As there are 764,537 SNPs, the association for 2.92 × 10¹¹ SNP pairs will have to be calculated. The execution times for the epistatic analysis for this dataset are shown in Table 2 below. As oppose to the previous dataset, a comparison will only be made for single core execution against 400 cores due to the time this would take with all of the core configurations.
From Table 2 above, almost linear speedups are obtained for both methods. Note that epistatic analysis for this dataset using FaST-LMM is not carried out due to the estimated execution time, highlighting the need for HPC. Having verified that the implemented epistatic analysis tools are capable of analysing a previously published dataset in a reasonable timeframe, the final verification is to compare the visualisation against a previously published example. The Manhattan plot in the paper by Xie et al. [20], will be compared to the Manhattan plot produced by the workflow. Figure 4 shows the single association and epistatic analysis visualisations. Figure 5 shows the Manhattan plot above in more detail. Note the similarity of this plot with the Manhattan plot from the original Clarkson study; minor differences in the two plots are due to slightly different quality control procedures used in the workflow compared to the original study, resulting in 764,537 SNPs passing quality control compared to 875,967 for the original study.
As can be seen in Fig. 4, information on the closest protein coding gene for the SNP selected is presented to the end user underneath the plot within Galaxy. Information on the closest protein coding genes for all the SNPs above the threshold, in Fig. 5 those with −log10 p-value > 4.5, is automatically loaded by Spotfire from the values returned by the Postgwas R library. This provides added value to the end user by providing additional information about the markers in the plot, thus aiding in downstream analysis such as gene set enrichment analysis as the end user does not have to manually annotate SNPs of interest. In addition, clicking the gene name takes the end user to the NCBI gene record, providing additional information of interest.
5 Conclusions and Future Work
This work has detailed the development and subsequent implementation of an epistatic framework on the HPC cluster at the University of Malaga, accessed using a custom instance of the easy-to-use Galaxy workflow manager. By doing so, this has resulted in shorter execution times compared with a single core execution designed to simulate a desktop environment, and greater accessibility for users who are not comfortable with command line and programming language environments. As a result, this has the potential to lead to an uptake in the use of epistatic analysis methods to analyse genotype data. The increased usage of epistatic analysis has the potential to provide further insights into the underlying causes of complex diseases, considering that these are likely due to multiple genetic variations. This impacts both new datasets, and also existing datasets that have been previously analysed using single association methods. This is particularly important considering that epistasis has been proposed as a possible explanation for the missing heritability in GWASs [21, 22], i.e. why other studies, such as twin studies, find higher heritability.
It should be noted that the benchmarking of the framework was carried out using the HPC cluster at the University of Malaga, and in order to access these facilities, an account is required. However, the use of a custom instance of Galaxy means that the framework can easily be adapted and deployed on other computing infrastructures. Due to the use of SLURM as the resource manager, the scripts for the epistatic analysis could easily be adapted to run on other HPC facilities. In future, it is also feasible to adapt the tools presented to run on a cloud computing platform. The Mr.SymBioMath project, which supported parts of the work reported in this paper, has a cloud computing test platform based on OpenStack [23], and developments in this test platform should be easily transferable to run on commercial cloud computing providers such as Amazon. Furthermore, we are planning to make the tools and workflow presented in the paper available via the Galaxy toolshed once further testing has been carried out, thereby allowing their incorporation into existing Galaxy instances.
Moving forward, added functionality could be offered through the implementation of both other epistatic analysis methods, and the implementation of enrichment analyses of the results, through the extension of the Spotfire integration to include OmicsOffice [24], and take advantage of the annotation manager feature, allowing enrichment results obtained to be directly displayed within Galaxy. By carrying this out, it would be possible to offer an all-in-one workflow that starts with raw data, and finishes with enrichment analysis results all from within one easy-to-use platform, thus providing a more complete tool-set for analysis of genotype data. A promising area of research is the detection of higher order epistasis, i.e. third order and higher; as methods for this are developed and become available, their incorporation potentially offers further insights into the underlying genetic architecture of human disease.
References
Low, S.-K., Takahashi, A., Ashikawa, K., Inazawa, J., Miki, Y., Kubo, M., Nakamura, Y., Katagiri, T.: Genome-wide association study of breast cancer in the Japanese population. PLoS ONE 8, e76463 (2013)
Adeyemo, A., Gerry, N., Chen, G., Herbert, A., Doumatey, A., Huang, H., Zhou, J., Lashley, K., Chen, Y., Christman, M., Rotimi, C.: A genome-wide association study of hypertension and blood pressure in African Americans. PLoS Genet. 5, e1000564 (2009)
Upton, A., Trelles, O., Cornejo-García, J.A., Perkins, J.R.: Review: high-performance computing to detect epistasis in genome scale data sets. Brief. Bioinform. 17, bbv058 (2015)
Wan, X., Yang, C., Yang, Q., Xue, H., Fan, X., Tang, N.L.S., Yu, W.: BOOST: a fast approach to detecting gene-gene interactions in genome-wide case-control studies. Am. J. Hum. Genet. 87, 325–340 (2010)
Lippert, C., Listgarten, J., Liu, Y., Kadie, C.M., Davidson, R.I., Heckerman, D.: FaST linear mixed models for genome-wide association studies (2011)
Kouskoumvekaki, I., Shublaq, N., Brunak, S.: Facilitating the use of large-scale biological data and tools in the era of translational bioinformatics. Brief. Bioinform. 15, 942–952 (2013)
Kallio, M.A., Tuimala, J.T., Hupponen, T., Klemelä, P., Gentile, M., Scheinin, I., Koski, M., Käki, J., Korpelainen, E.I.: Chipster: user-friendly analysis software for microarray and other high-throughput data (2011)
Giardine, B., Riemer, C., Hardison, R.C., Burhans, R., Elnitski, L., Shah, P., Zhang, Y., Blankenberg, D., Albert, I., Taylor, J., Miller, W., Kent, W.J., Nekrutenko, A.: Galaxy: a platform for interactive large-scale genome analysis. Genome Res. 15, 1451–1455 (2005)
Wolstencroft, K., Haines, R., Fellows, D., Williams, A., Withers, D., Owen, S., Soiland-Reyes, S., Dunlop, I., Nenadic, A., Fisher, P., Bhagat, J., Belhajjame, K., Bacall, F., Hardisty, A., de la Hidalga, A.N., Balcazar Vargas, M.P., Sufi, S., Goble, C.: The taverna workflow suite: designing and executing workflows of web services on the desktop, web or in the cloud. Nucleic Acids Res. 41, W557–W561 (2013)
Goecks, J., Nekrutenko, A., Taylor, J.: Galaxy: a comprehensive approach for supporting accessible, reproducible, and transparent computational research in the life sciences. Genome Biol. 11, R86 (2010)
Lippert, C., Listgarten, J., Davidson, R.I., Baxter, S., Poon, H., Poong, H., Kadie, C.M., Heckerman, D.: An exhaustive epistatic SNP association analysis on expanded Wellcome Trust data. Sci. Rep. 3, 1099 (2013)
Tao, S., Feng, J., Webster, T., Jin, G., Hsu, F.C., Chen, S.H., Kim, S.T., Wang, Z., Zhang, Z., Zheng, S.L., Isaacs, W.B., Xu, J., Sun, J.: Genome-wide two-locus epistasis scans in prostate cancer using two European populations. Hum. Genet. 131, 1225–1234 (2012)
Heinzlreiter, P., Perkins, J.R., Tirado, O.T., Karlsson, J., Ranea, J.A., Mitterecker, A., Blanca, M., Trelles, O.: A cloud-based GWAS analysis pipeline for clinical researchers. In: Proceedings of the Fourth International Conference on Cloud Computing and Services Science, pp. 378–394 (2014)
Purcell, S., Neale, B., Todd-Brown, K., Thomas, L., Ferreira, M.A.R., Bender, D., Maller, J., Sklar, P., de Bakker, P.I.W., Daly, M.J., Sham, P.C.: PLINK: a tool set for whole-genome association and population-based linkage analyses. Am. J. Hum. Genet. 81, 559–575 (2007)
Wood, A.R., Tuke, M.A., Nalls, M.A., Hernandez, D.G., Bandinelli, S., Singleton, A.B., Melzer, D., Ferrucci, L., Frayling, T.M., Weedon, M.N.: Another explanation for apparent epistasis. Nature 514, E3–E5 (2014)
Hiersche, M., Rühle, F., Stoll, M.: Postgwas: advanced GWAS interpretation in R. PLoS ONE 8, e71775 (2013)
Anonymous: TIBCO Software Inc releases new version of Spotfire. Telecomworldwire (2008)
Bostock, M., Ogievetsky, V., Heer, J.: D3; Data-Driven Documents. IEEE Trans. Vis. Comput. Graph. 17, 2301–2309 (2011)
Upton, A., Trelles, O., Perkins, J.: Epistatic analysis of clarkson disease. Procedia Comput. Sci. 51, 725–734 (2015)
Xie, Z., Nagarajan, V., Sturdevant, D.E., Iwaki, S., Chan, E., Wisch, L., Young, M., Nelson, C.M., Porcella, S.F., Druey, K.M.: Genome-wide SNP analysis of the systemic capillary leak syndrome (clarkson disease). Rare Dis. (Austin Tex) 1, e27445 (2013)
Manolio, T.A., Collins, F.S., Cox, N.J., Goldstein, D.B., Hindorff, L.A., Hunter, D.J., McCarthy, M.I., Ramos, E.M., Cardon, L.R., Chakravarti, A., Cho, J.H., Guttmacher, A.E., Kong, A., Kruglyak, L., Mardis, E., Rotimi, C.N., Slatkin, M., Valle, D., Whittemore, A.S., Boehnke, M., Clark, A.G., Eichler, E.E., Gibson, G., Haines, J.L., Mackay, T.F.C., McCarroll, S.A., Visscher, P.M.: Finding the missing heritability of complex diseases. Nature 461, 747–753 (2009)
Cho, J.H.: Genome-Wide association studies: present status and future directions. Gastroenterology 138, 1668–1672 (2010)
Sefraoui, O., Aissaoui, M., Eleuldj, M.: OpenStack: toward an open-source solution for cloud computing. Int. J. Comput. Appl. 55, 38–42 (2012)
OmicsOffice (2014). https://www.integromics.com/omicsoffice-suite/
Acknowledgment
This work has been partially supported by the Mr. SymBioMath IAPP (project code: 324554), the ‘Plataforma de Recursos Biomoleculares y Bioinformaticos (ISCIII-PT13.0001.0012)’ and ‘Proyecto de Excelencia Junta de Andalucía (P10-TIC-6108)’.
Author information
Authors and Affiliations
Corresponding author
Editor information
Editors and Affiliations
Rights and permissions
Copyright information
© 2017 Springer International Publishing AG
About this paper
Cite this paper
Upton, A., Karlsson, J., Trelles, O., Hernandez, M., Elvira, J. (2017). A Framework for Accessible Cluster-Enabled Epistatic Analysis. In: Desprez, F., et al. Euro-Par 2016: Parallel Processing Workshops. Euro-Par 2016. Lecture Notes in Computer Science(), vol 10104. Springer, Cham. https://doi.org/10.1007/978-3-319-58943-5_35
Download citation
DOI: https://doi.org/10.1007/978-3-319-58943-5_35
Published:
Publisher Name: Springer, Cham
Print ISBN: 978-3-319-58942-8
Online ISBN: 978-3-319-58943-5
eBook Packages: Computer ScienceComputer Science (R0)