
Abstract
While basic Web analytics tools are widespread and provide statistics about website navigation, no approaches exist for merging such statistics with information about the Web application structure, content and semantics. Current analytics tools only analyze the user interaction at page level in terms of page views, entry and landing page, page views per visit, and so on. We show the advantages of combining Web application models with runtime navigation logs, at the purpose of deepening the understanding of users behaviour. We propose a model-driven approach that combines user interaction modeling (based on the IFML standard), full code generation of the designed application, user tracking at runtime through logging of runtime component execution and user activities, integration with page content details, generation of integrated schema-less data streams, and application of large-scale analytics and visualization tools for big data, by applying both traditional data visualization techniques and direct representation of statistics on visual models of the Web application.
You have full access to this open access chapter, Download conference paper PDF
Keywords
These keywords were added by machine and not by the authors. This process is experimental and the keywords may be updated as the learning algorithm improves.
1 Introduction
In recent years, the software language engineering community has put more and more emphasis on the design and experimentation of languages that cover the requirement specification [5, 6], design [30], and verification/validation [10, 14,15,16, 19] of software artifacts. Some of these experiences have also spawned commercial products and thus have been applied in industrial settings, with excellent results.
On the other side, a completely different line of work is ongoing regarding the usage analysis of Web applications with the aim of extracting leads to optimizing the user experience. Indeed, with the increasing need to meet customer preferences and to understand customer behavior, Web analytics has become the tool of choice towards taking informed business and interaction design decisions. Several tools exist that support analysis of Web server logs and extract information on application usage (based on data mining, machine learning, and big data analysis; or simpler pragmatic approaches in the UX field, like A/B split testing). However, those tools are unaware of the design structure and the actual content managed by the application. Therefore, understanding the relation between the output of the quantitative log analysis, the structure of the application, and the displayed content is not an easy task, especially for large and complex systems. Some analytics tools, like Google Analytics [22], can take into account the page content but this implies a high development overhead which yields to high risk of errors and maintainability.
In this paper we propose a model-driven engineering approach that combines user interaction models with user tracking information and details about the visualized content in the pages. Our claim is that integration of appropriately designed modeling languages for user interaction development and Web log analytics approaches has high potential of delivering valuable insights to designers and decision makers on the continuous improvement process of applications. We show our full development cycle from visual application modeling (through the OMG’s standard Interaction Flow Modeling Language, IFML [8, 24]), to full code generation, user interaction log collection and integration with content and semantics of visualized data, down to display of results both through traditional data visualization techniques and with direct representation of statistics on visual models of Web applications represented with the OMG’s IFML standard. Our proposal can be applied to applications developed using any model-driven development approach and generating runtime usage logs containing references to the conceptual model elements.
The paper is organized as follows: Sect. 2 introduces some background on model-driven development of Web applications, the IFML language and the WebRatio toolsuite; Sect. 3 describes our method for merging logs, enriching them with information coming from models, and applying analysis over them. Section 4 presents a case study that demonstrate the approach at work; Sect. 5 reviews the related works; and Sect. 6 summarizes the results and concludes.
2 MDD of User Interaction with IFML and WebRatio
This work focuses on the general concept of model-driven integration of user interaction designs with user navigation logs. However, to make things working in practice, we exploit as background: a specific modeling language, namely IFML, and a specific toolsuite, called WebRatio.
2.1 The IFML Language
The Interaction Flow Modeling Language (IFML) [24] is an international standard adopted by the Object Management Group (OMG) that supports the platform independent description of graphical user interfaces for applications accessed or deployed on such systems as desktop computers, laptop computers, PDAs, mobile phones, and tablets. An IFML model supports the following design perspectives:
-
The view structure specification, which consists of the definition of view containers, their nesting relationships, their visibility, and their reachability;
-
The view content specification, which consists of the definition of view components, i.e., content and data entry elements contained within view containers;
-
The events specification, which consists of the definition of events that may affect the state of the user interface. Events can be produced by the user’s interaction, by the application, or by an external system;
-
The event transition specification, which consists of the definition of the effect of an event on the user interface;
-
The parameter binding specification, which consists of the definition of the input-output dependencies between view components and between view components and actions; and
-
The reference to actions triggered by the user’s events.
IFML concepts can be stereotyped to describe more precise behaviours. For instance, one could define specific stereotypes for describing web pages (a specific kind of view container); forms, lists and details (specific kinds of view component); submission or selection events; and so on. By exploiting this extensibility feature, we defined custom extensions of IFML for covering Web [2] and mobile [3, 9, 28] applications.

WebRatio architecture: design time, generation time, and runtime environments.

Example of IFML diagram.
Figure 2 shows an example of an IFML diagram: the Home Page ViewContainer contains a ViewComponent displaying a list of book categories. The user can click on the books event and thus selects a category in order to see the books belonging to it in the Book List ViewComponent. By clicking on a book (through details event) the user navigates to the Book Details page, where he can see the details of the selected book.
2.2 WebRatio Implementation of IFML
WebRatio Web Platform [1] is a model-driven development tool which implements the Web-extended version of IFML. The tool supports developers in the specification of the domain model and of the interaction flow model for web applications. The tool features model checking and full code generation that produces application code executable on top of any platform conforming to the J2EE specifications. Figure 1 represents an high level view of the WebRatio architecture, which supports developers ad design time, code generation time, and execution time.
Design time. WebRatio provides four main integrated modeling and development environments, supporting respectively: the modeling of IFML diagrams for the specification of the user interaction; the modeling of UML class diagrams (or ER diagrams) for the content design; the graphical layout template and style design environment; and the specification and development of the modeling level and execution level of custom IFML elements defined as extensions of IFML. The WebRatio models are saved as XML documents.
Code generation. Based on the input provided through the modeling and development environments, WebRatio provides code generators which transform the specifications of the application into concrete, executable implementations. The code generators are implemented using ANT, XSLT, and Groovy. The generated code consists of a Java EE code covering both front-end of back-end of web applications. The generated components include:
-
The configuration file of the Controller which contains the navigation control flow logic;
-
The action classes which are invoked by the Controller and, in turn, invoke the runtime services;
-
The XML configuration files (called runtime descriptors) of the runtime services. In particular, every IFML ViewComponent in the the model produces one runtime descriptor configuring the behavior of a generic runtime service. For example, a specific List ViewComponent generates a runtime descriptor containing, among other things, the SQL code for extracting the content of the index from the data repository;
-
The server-side templates for dynamically building the actual pages of the application.
Execution time. The WebRatio run-time framework consists of object oriented components and services for organizing the business tier, clustered in three main layers: the service layer, the application layer, and the logging layer.
The service layer is deployed once and for all for every application and does not actually need code generation, because it comprises general purpose services. Therefore, at runtime one single service class is deployed for each type of component, which is then instantiated with the smart service creation approach described next. The deployed services are:
-
a Page Service, that is in charge of calculating the whole page structure for every page of the site;
-
a set of ViewComponent Services (one for each component type), in charge of executing the logic of each view component;
-
a set of Action Services (one for each action type), in charge of executing the business logic of each IFML action;
These services get configured based on the XML configuration files (descriptors) allocated at the application layer: the code generator produces one JSP template and XML descriptor for each Page in the IFML model; and one XML descriptor for each IFML Action and ViewComponent. The execution logic features a emphsmart service creation policy: services that implement ViewComponents or business actions are created upon request, cached, and reused across multiple requests, i.e., for evey designed IFML element, which gets configured through the XML descriptors. Access to the information stored in the XML ViewComponent descriptors is granted by standard parsing tools. This behaviour is tracked by the Activity log: a set of pre-built functions for logging each service is provided. The logging service can be extended with user-defined modules, so as to log the desired data.
In our approach, we are more concerned with the logging service. It represents a valuable asset, as it allows the logging of the execution of all application objects and shows the queries executed to fulfill the HTTP page requests. This information, along with the HTTP access log data available on the Web server, and information from conceptual models are the inputs of the proposed user interaction analysis framework.
3 Modeling, Integration, Analysis, and Visualization
In this section we describe the steps of our method, as summarized in Fig. 3.

Architectural overview of the approach and flow of artifacts.
3.1 Application Modeling and Generation
The first phase of our approach consists on modeling the Web application using a visual modeling editor (Fig. 3(a)) supporting the IFML standard presented in Sect. 2. A code generator (Fig. 3(b)) takes in input the IFML application models and deploys the web application on a web server (Fig. 3(c)), ready to be executed.
3.2 Analysis
The second phase (Fig. 3(d)), is concerned with two main aspects: (i) the integration of the website log, the database containing the information displayed in the site pages, and the Web application models specified in IFML; and (ii) the analysis of the resulting schema-less enriched stream. The outcome is a rich analytics able to provide deep insights regarding the behavior the user visiting the website. Since this phase is the core step of our approach, we provide full details about inputs, process and output.
Inputs. Four pieces of information are consumed in this phase:
-
1.
The Application Model: The IFML model of the deployed web application, as designed in the first step of the process (see Sect. 2.1).
-
2.
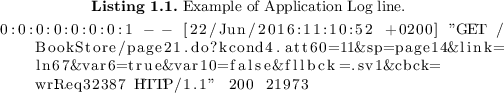
The Application Server Log: The common access log produced by the server where the website is deployed. The access log records all the requests processed by the application server in the standard Extended Common Log Format. Listing 1.1 shows an example of a Web server log line.
-
3.
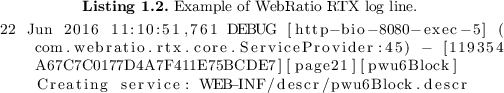
The Runtime Components Log: The runtime component log (RTX) that stores events and data produced and consumed by the application runtime for serving page requests. It traces the history of the ViewContainers, ViewComponents, and operations that are executed, along with the executed queries. Moreover, the RTX log contains the data about the requested pages and their contents. Furthermore, all logged information contains a reference to the relevant application model elements and to the consumed data in the database. Each log line has the following structure (exemplified in Listing 1.2):
-
Timestamp, the time when the logged instruction is written in the log;
-
Log Level, the level to which the log line belongs;
-
Host, the host sending the request, i.e., the IP address of the client computer used by user to navigate the application;
-
Java class, the Java class executed;
-
Session ID, the User session identifier;
-
Model element, the model element executed;
-
Message, the log message.
Listing 1.2 shows an example of RTX log line.
-
-
4.
Database: Detailed reference to the database used to populate the requested pages.


While the application model is given at design time and we can assume it as persistent, the information contained in the logs and in the database changes as the users visit the website. The model can be changed in order to add or evolve features in the web application, but in that case the whole analysis process will be restarted.
Process. The analyzer (Fig. 3(d)) integrates the logs with the IFML model and database content. More precisely the following steps, summarized by Fig. 4, are performed:
-
The logs, the models and are transformed in a tabular format in order to be easily queried and manipulated (Fig. 4(a)).
-
The domain instances are imported from the database of the web application (Fig. 4(a)). In order to be domain independent and support any type of data, our process takes all the tables present in the database and create a unique table with the structure: table_name,attribute_name,value.
-
The Runtime Component Log is joined with the Application Server Log using the session id and the timestamp (Fig. 4(b)). This Enriched Log shows, for each page requested by a user, the corresponding model element computed for serving the page content. Moreover it contains information regarding the link (if any) used for navigating the website. At this stage of the process we know all the elements involved in the users navigation, but only limited to their id. For instance, by imaging a possible user navigation in the model shown in Fig. 2, we may know that a user went to page2 from page1 through link ln66 and he was shown elements with oid 3 of table t1 by the component d2.
-
The EnrichedLog is joined with the Application Model using the id of the model elements present in both inputs to obtain a GlobalLog (Fig. 4(c)). This allow to add to the EnrichedLog information regarding to the model elements involved in the user interaction. For instance now we may know that the user went to the Book Details page from the Home Page through link named Details and he was shown the elements with oid 3 of table book by the component Details.
-
Finally the GlobalLog is joined wit the DatabaseInstances using the name of the tables and the oid of the instances (Fig. 4(d)). With this final step we are able to assign an actual value to the oids present in the GlobalLog. To continue with the previous example, in addition with the information regarding the navigation, we know that the users looked the book Lord of the Rings.

Steps for the integration of the logs with the models and the database instances
From this global, denormalized view one can generate any desired behaviour analysis. In particular every statistics is computed with one or more SQL-like queries on the FinalLog. We describe in details how the analytics are computed in Sect. 4.
Output. With our approach we can compute three kinds of user behaviour analytics:
-
1.
Navigation-based analytics: comprehends information regarding how the users navigate the website (e.g., average time spent on a page, number of requests for a page, links followed, and so on). These are the typical metrics computed also by other tools.
-
2.
Content-based analytics: comprehends information regarding the domain entities involved in the user interaction, their types and their semantics. For example, in the case of an e-commerce website for selling books, these metrics may include the top-k visualized books, the top-k clicked authors and so on.
-
3.
Structure-based analytics: comprehends information regarding the kind of widget, visualization, or even navigation pattern used in the user interaction model. For instance, analytics may include metrics like: top-k elements clicked by users when shown in a map throughout the site, or top-k elements clicked when shown in the first three positions of a list, or top-k elements clicked when an attribute of type image is shown in the page versus an attribute of type currency.
Notice that each analytics result may refer to global statistics for the whole website, or to one or more model elements (e.g., ViewCompoment, ViewContainer and InteractionFlow).
3.3 Visualization
The results of the analyses can be visualized in two ways:
-
Using a canonical data visualization tool (Fig. 3(e)), which shows traditional charts like pie charts, bar charts, navigation flow charts and so on;
-
Showing the data directly on the visual model (i.e., on the IFML diagrams), thus providing direct feedback of the users’ behavior to the interaction designer (Fig. 3(f)).
Our main contribution on the visualization side focuses on the latter; in particular we devised three means of visualization:
-
Color: the analytics is shown through the change of color of the corresponding model element (e.g., ViewComponent or ViewContainer) based on some quantitative analysis result associated to it. This is useful for statistics that refer to many model elements and provides a immediate bird’s-eye view of the user behavior for the whole website: for instance, one may color the pages in the IFML diagram based on the number of page views achieved by each of them. For instance, Fig. 6(a) shows an IFML diagram with colored pages based on the number of visits per page (from green to red, where green means higher number of visits);
-
Label: the analytics is shown with a label on the corresponding model element. For instance, one may display the number of clicks that a widget or a link has received; or the most clicked content instance(s) in a list, such as the top clicked book;
-
Properties: the analytics is shown in a separate property panel, detailing the data about the corresponding model element. This is useful when many statistics or multi-valued results need to be displayed for the same element. For instance, Fig. 6(b) shows the list of top-10 visited elements in a list.
4 Case Study
In order to validate our approach we conducted a case study where we modeled mall e-commerce-like website selling books. The application (the IFML model is shown in Fig. 5) provides information on books such as their title, authors, price, category, description, reviews, comments and rating, and allows to navigate and purchase goods (the actual payment phase is not covered).

IFML model of the application used in our case study
In our implementation, we rely on the code generators of WebRatio (www.webratio.com) which produces Java EE applications and deploys them on any servlet container. We simulated the behavior of users visiting the website and then we computed statistics related to their interaction. The entire process of analysis is performed on the Microsoft Azure platform, using an Apache Spark Cluster as processing engine and technology for the processing and computation of the required analysis. Scala was used as a programming language to write the Spark application. We computed both navigation based and content based statistics. In the following we describe how the statistics are computed starting from the data obtained with the analysis step described in Sect. 3 Footnote 1.
4.1 Navigation-Based Statistics
Number of Visits. The Number of Visits indicate the number of times a page was visited. Listing 1.3 shows the query used for compute this statistic. From the FinalLog we select each page and count the number of time it appears.

Entrance Rate: We define as Entrance Rate the average times, expressed as percentage, that a page is the starting point of the navigation of a user. At first we select all the pages that appear as first in the log for each users. Then we count the number of time a page appears.
Bounce Rate: We define as Bounce Rate the average times, expressed as percentage, that a page is the ending point of the navigation of a user. Similarly to the previous case, we select all the pages that appear as last in the log and then count the occurrences.
Outgoing Link Ratio. The Outgoing Link Ratio statistic of a link refers to the ratio of users clicking on that link with respect to the others present in the same page. As first step we select the couples sourcePage,linkId, that indicate that a specific linkId was clicked on a specific sourcePage. Then we count the occurrence grouped by page and divide the value by the total number of outgoing navigation.
Incoming Link Ratio. The Incoming Link Ratio statistic of a link refers to the ratio of user that uses that link to come in a specific page. Similarly to the previous statistic, at first we compute the couples requestedPage,linkId, that indicate that a specific linkId was clicked in order to arrive on a specific requestedPage. Then we count the occurrence grouped by page and divide the value by the total number of incoming navigation.
Average Staying Time: The Average Staying Time indicate the number of milliseconds that the users, in average, spent on a given page. The computation of this statistic is composed by four steps: (1) we select all the tuples in the form time,sessionId,sourcePage,requestedPage ordered by time. (2) Next, for each sessionId we identified the timestamp of the next request of a different page (e.g., sourcePage!=requestedPage). (3) Then the residence time is computed by making the difference of the two timestamps. (4) Finally the average is computed.
4.2 Content-Based Statistics
Top 10 Visualized Instances. For each ViewComponent we compute the top 10 visualized instances as follows: for each visualized instance (from the FinalLog) we assign value 1 as occurrence to the pair ViewComponent,Instance. Then, we compute the sum of occurrences of each pair. The results are grouped by ViewComponent and ordered in a descendant order on the number of occurrences.
Top 10 Clicked Instances. For each ViewComponent of type List we computed the top 10 clicked instances. This statistic was extracted as follows: for each clicked instance (from the FinalLog) we assign value 1 as occurrence of the instance. Then, we compute the sum of occurrences of each instance. The results are grouped by ViewComponent and ordered in a descendant order on the number of occurrences.
4.3 Visualization
As stated in Sect. 3 we focused on a novel type of visualization, that is showing the analytics information directly on the model. Figure 6 shows some examples: Fig. 6(a) show the Average Staying Time as background color of the pages (green means high staying time, red low), Fig. 6(b) shows the Top 5 displayed books on a ViewCompent, while Fig. 6(c) show the Outgoing Link Ratio of the HomePage link.

Example of model-based statistics visualization: (a) heat-map of user behavior on the IFML diagram; (b) fine grained statistics related to a selected model element; (c) user navigational behavior on the IFML model as percentage of users clicking on each outgoing navigation flow. (Color figure online)
5 Related Works
At the best of our knowledge this work is the first one which attempts to combine the information coming from the application models with runtime Web logs of the application execution, at the purpose of deepening the understanding of how the users consume the provided content. The works we found closer to our approach are: (i) a Web Quality Analyzer proposed by Fraternali et al. [17], a framework which integrates the design-time conceptual schemas of the application and the usage data collected at runtime to analyze the quality of website. Their approach focuses on quality analysis while ours studies the user interactions; (ii) in [25], Salini et al. proposed an approach that exploits the data coming from web usage analytics of existing web applications to generate the mobile navigation model of their corresponding mobile applications; and (iii) a model-driven approach for tracking information concerning the user navigation over websites proposed by Marco Winckler and Florence Pontico [32].
Web Log Analysis. Web Analytics is the measurement, collection, analysis and reporting of Internet data for the purposes of understanding and optimizing Web usage [11]. The Web analytics process relies on defining goals, defining metrics, collecting data, analyzing data and implementing changes [31]. So far, several tools which support that process have been proposed. Among them we can cite Google Analytics, Yahoo Web Analytics, Compete, and ClickTale. All those tools provide the most important metrics: Unique Visitors, Visits/Sessions and Page Views [11].
However, those tools provide analysis mainly at web page level and they do not take into account the content of the visited pages. There exist some analytics tools, like Google Analytics [22], which provide a way to track the user interactions at content level but at a high cost of hard coding which yields to high risk of errors and maintainability of the web application. Furthermore, those event tracking mechanisms support a small subset of user interactions. Our approach combines the application models with runtime Web logs of the application execution, at the purpose of deepening the understanding of how the users consume the provided content and thus help analysts and decision makers to take more informed decisions on the website design and evolution.
The log analysis field in general, and Web log analysis in particular, has attracted the research community due to several advantages offered by the tracking the interactions of the users with an information access systems. Agosti et al. [4] have presented the current challenges and trends of this field.
Conceptual Modeling of WebApplications. This work is widely related to a large corpus of researches that address conceptual modeling of Web applications. Among them we can cite: (i) Araneus [23], a modeling proposal for Web applications that allows one to represent the hypertext organization, with nested relations and inter-page links; (ii) W2000, formerly HDM [7], which introduced a notion of model-based design, clearly separating the activities of authoring in-the-large (hypertext schema design) and authoring in-the-small (page and content production); (iii) OO-HDM [26], a UML-based approach for modeling and implementing Web application interfaces; (iv) OO-HMETHOD [20], based on UML interaction diagrams; (v) Hera [29], a model-driven design approach and specification framework focusing on the development of context-dependent or personalized Web information system; (vi) Web Application Extension for UML (WAE) [13], a UML extension for describing Web application interfaces and the client-server interactions; (vii) WebDSL [21], a domain-specific language consisting of a core language with constructs to define entities, pages and business logic, plus extensions.
Tools for Conceptual Modeling. Several design tools has been developed in the past. In the work [18] the authors developed Papyrus, a open-source graphical modeling tool for building UML models. This tool also allows the definition of DSLs through a very advanced implementation of UML profiles. In [12] the authors proposed beContent, a model-driven framework for developing and maintaining rich web applications. It allows to design the application, to deploy it on different platforms and to co-evolve it in order to adapt its components according to changes performed on the model. Syriani et al. [27] proposed a web framework that allows the definition, management and transformation of models. It runs entirely on the cloud and does not require any installation.
6 Conclusion
The main contribution of this work is to show the feasibility and advantages of a model-driven approach that blends design-time information and runtime execution data of websites for generating insightful analyses of user behavior. Thanks to the proposed information fusion, new kinds of analysis can be performed, which highlight the role and meaning of visualized data in the Web pages. New analytics results can be generated based on the displayed objects, their categorization and their properties. Results of the analysis can be immediately displayed directly on the visual models of the applications, thus making it immediate for a designer to spot possible problems or advantages of a given user interaction design choice. As a future work, we plan to: experiment scalability aspects on a cloud-based distributed solution; study additional Web-specific analyses (for instance, by combining the analysis with variant-based approaches such as A/B testing for checking how users react to different versions of the interface or of the rendered content); and explore a different tool to enhance the visualizations. As a limitation, this method cannot be applied to every existing web application, the web application must have been created using the WebRatio platform. A more general way to cover a wider range of web applications can be used through covering more modeling languages. Another point is that all the steps from analyzing to visualizing can be automatized to enable obtaining results easily, so that users who are not familiar with big data analysis technologies can obtain results easily.
Notes
- 1.
The actual queries are omitted since they are quite long and do not fit in the paper.
References
WebRatio. http://www.webratio.com
Acerbis, R., Bongio, A., Brambilla, M., Butti, S.: Model-driven development based on omg’s ifml with webratio web and mobile platform. In: Cimiano, P., Frasincar, F., Houben, G.-J., Schwabe, D. (eds.) ICWE 2015. LNCS, vol. 9114, pp. 605–608. Springer, Cham (2015). doi:10.1007/978-3-319-19890-3_39
Acerbis, R., Bongio, A., Brambilla, M., Butti, S.: Model-driven development of cross-platform mobile applications with WebRatio and IFML. In: 2nd ACM International Conference on Mobile Software Engineering and Systems, MOBILESoft 2015, Florence, Italy, 16–17 May 2015, pp. 170–171 (2015). http://dx.doi.org/10.1109/MobileSoft.2015.49
Agosti, M., Crivellari, F., Di Nunzio, G.M.: Web log analysis: a review of a decade of studies about information acquisition, inspection and interpretation of user interaction. Data Min. Knowl. Discov. 24(3), 663–696 (2012)
Ameller, D., Franch, X., Gómez, C., Araujo, J., Svensson, R.B., Biffl, S., Cabot, J., Cortellessa, V., Daneva, M., Fernández, D.M., et al.: Handling non-functional requirements in model-driven development: an ongoing industrial survey. In: 2015 IEEE 23rd International Requirements Engineering Conference (RE), pp. 208–213. IEEE (2015)
Amyot, D., Mussbacher, G.: User requirements notation: the first ten years, the next ten years. J. Softw. 6(5), 747–768 (2011)
Baresi, L., Garzotto, F., Paolini, P.: From web sites to web applications: new issues for conceptual modeling. In: Liddle, S.W., Mayr, H.C., Thalheim, B. (eds.) ER 2000. LNCS, vol. 1921, pp. 89–100. Springer, Heidelberg (2000). doi:10.1007/3-540-45394-6_9
Brambilla, M., Fraternali, P.: Interaction Flow Modeling Language Model-Driven UI Engineering of Web and Mobile Apps with IFML. The OMG Press, Morgan-Kaufmann, Burlington (2014)
Brambilla, M., Mauri, A., Umuhoza, E.: Extending the interaction flow modeling language (IFML) for model driven development of mobile applications front end. In: Awan, I., Younas, M., Franch, X., Quer, C. (eds.) MobiWIS 2014. LNCS, vol. 8640, pp. 176–191. Springer, Cham (2014). doi:10.1007/978-3-319-10359-4_15
Breu, R., Chimiak-Opoka, J.: Towards systematic model assessment. In: Akoka, J., Liddle, S.W., Song, I.-Y., Bertolotto, M., Comyn-Wattiau, I., Heuvel, W.-J., Kolp, M., Trujillo, J., Kop, C., Mayr, H.C. (eds.) ER 2005. LNCS, vol. 3770, pp. 398–409. Springer, Heidelberg (2005). doi:10.1007/11568346_43
Burby, J., Brown, A., et al.: Web analytics definitions (2007)
Cicchetti, A., Ruscio, D., Eramo, R., Maccarrone, F., Pierantonio, A.: beContent: a model-driven platform for designing and maintaining web applications. In: Gaedke, M., Grossniklaus, M., Díaz, O. (eds.) ICWE 2009. LNCS, vol. 5648, pp. 518–522. Springer, Heidelberg (2009). doi:10.1007/978-3-642-02818-2_52
Conallen, J.: Building Web Applications with UML. Addison Wesley, Boston (2002)
Cordeiro, L., Fischer, B.: Verifying multi-threaded software using SMT-based context-bounded model checking. In: Proceedings of the 33rd International Conference on Software Engineering, ICSE 2011, NY, USA, pp. 331–340 (2011). http://doi.acm.org/10.1145/1985793.1985839
Di Rocco, J., Di Ruscio, D., Iovino, L., Pierantonio, A.: Mining metrics for understanding metamodel characteristics. In: Proceedings of the 6th International Workshop on Modeling in Software Engineering, MiSE 2014, NY, USA, pp. 55–60 (2014). http://doi.acm.org/10.1145/2593770.2593774
Di Ruscio, D., Pelliccione, P.: A model-driven approach to detect faults in FOSS systems. J. Softw. Evol. Proc. 27(4), 294–318 (2015). http://dx.doi.org/10.1002/smr.1716
Fraternali, P., Lanzi, P.L., Matera, M., Maurino, A.: Model-driven web usage analysis for the evaluation of web application quality. J. Web Eng. 3(2), 124–152 (2004). http://www.rintonpress.com/xjwe3/jwe-3-2/124-152.pdf
Gérard, S., Dumoulin, C., Tessier, P., Selic, B.: 19 Papyrus: a UML2 tool for domain-specific language modeling. In: Giese, H., Karsai, G., Lee, E., Rumpe, B., Schätz, B. (eds.) MBEERTS 2007. LNCS, vol. 6100, pp. 361–368. Springer, Heidelberg (2010). doi:10.1007/978-3-642-16277-0_19
Giese, H., Tichy, M., Burmester, S., Schäfer, W., Flake, S.: Towards the compositional verification of real-time uml designs. SIGSOFT Softw. Eng. Notes 28(5), 38–47 (2003). http://doi.acm.org/10.1145/949952.940078
Gómez, J., Cachero, C., Pastor, O., Pastor, O.: Conceptual modeling of device-independent web applications, pp. 26–39 (2001)
Groenewegen, D.M., Hemel, Z., Kats, L.C.L., Visser, E.: Webdsl: a domain-specific language for dynamic web applications. In: OOPSLA Companion, pp. 779–780 (2008)
Ledford, J.L., Teixeira, J., Tyler, M.E.: Google Analytics. Wiley, New York (2011)
Mecca, G., Merialdo, P., Atzeni, P., Crescenzi, V., Crescenzi, V.: The (short) araneus guide to web-site development. In: WebDB (Informal Proceedings), pp. 13–18 (1999)
(OMG), O.M.G., Brambilla, M., Fraternali, P.: IFML: Interaction Flow Modeling Language. http://www.ifml.org
Salini, A., Malavolta, I., Rossi, F.: Leveraging web analytics for automatically generating mobile navigation models. In: 2016 IEEE International Conference on Mobile Services (MS), pp. 103–110. IEEE (2016)
Schwabe, D., Rossi, G., Rossi, G.: The object-oriented hypermedia design model, pp. 45–46 (1995)
Syriani, E., Vangheluwe, H., Mannadiar, R., Hansen, C., Van Mierlo, S., Ergin, H.: Atompm: a web-based modeling environment. In: Demos/Posters/StudentResearch@ MoDELS, pp. 21–25 (2013)
Umuhoza, E., Brambilla, M., Cabot, J., Bongio, A., et al.: Automatic code generation for cross-platform, multi-device mobile apps: some reflections from an industrial experience. In: Proceedings of the 3rd International Workshop on Mobile Development Lifecycle, pp. 37–44. ACM (2015)
Vdovják, R., Frăsincar, F., Houben, G.J., Barna, P.: Engineering semantic web information systems in Hera. J. Web Eng. 1(1–2), 3–26 (2003)
Völter, M., Benz, S., Dietrich, C., Engelmann, B., Helander, M., Kats, L.C.L., Visser, E., Wachsmuth, G.: DSL Engineering - Designing, Implementing and Using Domain-Specific Languages. dslbook.org (2013). http://www.dslbook.org
Waisberg, D., Kaushik, A.: Web analytics 2.0: empowering customer centricity. Original Search Engine Mark. J. 2(1), 5–11 (2009)
Winckler, M., Pontico, F.: A model-driven architecture for logging navigation. In: Workshop on Logging Traces of Web Activity: Workshop on the Mechanics of Data Collection, Co-located with 15th International World Wide Web Conference (WWW 2006), Edinburgh, Scotland (2006)
Author information
Authors and Affiliations
Corresponding author
Editor information
Editors and Affiliations
Rights and permissions
Copyright information
© 2017 Springer International Publishing AG
About this paper
Cite this paper
Bernaschina, C., Brambilla, M., Mauri, A., Umuhoza, E. (2017). A Big Data Analysis Framework for Model-Based Web User Behavior Analytics. In: Cabot, J., De Virgilio, R., Torlone, R. (eds) Web Engineering. ICWE 2017. Lecture Notes in Computer Science(), vol 10360. Springer, Cham. https://doi.org/10.1007/978-3-319-60131-1_6
Download citation
DOI: https://doi.org/10.1007/978-3-319-60131-1_6
Published:
Publisher Name: Springer, Cham
Print ISBN: 978-3-319-60130-4
Online ISBN: 978-3-319-60131-1
eBook Packages: Computer ScienceComputer Science (R0)