
Abstract
The altitude information of single remote sensing image may aid in detecting the natural disaster, such as landslide or debris flow. Accordingly, in this paper, an approach based on altitude is proposed to detect landslide and debris flow for a single mountain remote sensing image. Firstly, we extract the features of landslide and debris flow areas and introduce slow feature analysis (SFA) to improve the feature distinguishability. Then, machine learning and a training model are used to detect suspected landslide and debris flow areas. By using the altitude information calculated by dark channel prior, we analyze the altitude distribution of suspected areas to judge whether landslide and debris flow occur in these regions. The experimental results of multiple mountain remote sensing images with landslide or debris flow demonstrate that the proposed algorithm can accurately detect landslide debris flow areas in a single mountain remote sensing image.
You have full access to this open access chapter, Download conference paper PDF
Keywords
1 Introduction
Landslide and debris flow are two kinds of typical geological disasters, because of the most widely distribution and the most serious results. Therefore, it is necessary to detect landslide and debris flow.
With rapid development of sensors and improvement of the resolution of remote sensing images, remote sensing is becoming more and more concerned by geological hazard researchers, and it is used as a kind of landslide and debris flow investigation and detection means. To the end of the 20th century, the interpretation of stereoscopic aerial photographs was still the most common method for landslide and debris flow mapping and detection [1]. In remote sensing images, the interpretation of landslide and debris flow was mainly based on relief, hue, topography and other features [2,3,4]. In recent years, people have begun to use software platforms (such as Photoshop, ArcGIS, and CorelDraw) and combine Digital Elevation Models (DEMs) to implement human-computer interaction interpretation [5,6,7], which can enhance images and make spatial features of landslide and debris flow more intuitive. However, these methods are not as simple as the method directly analyzing real relative altitude of suspected regions.
Sheng and Chen [8] proposed an approach based on dark channel prior for altitude extraction of single remote sensing image, and the obtained altitude information can be applied to detect landslide and debris flow. Thus, in this paper, a new method based on altitude information is proposed for landslide and debris flow detection. The main contributions of our work are: (1) the relative altitude information generated from single image was utilized for landslide and debris flow detection; (2) slow feature analysis (SFA) was used to improve the feature distinguishability.
2 Landslide and Debris Flow Detection Combined with Altitude
Figure 1 shows the block diagram of our algorithm including suspected landslide and debris flow detection and refinement based on altitude information. Firstly, effective features (including RGB and image texture processed by SFA) are extracted from training data, then we use support vector machine (SVM) to detect the suspected debris flow and landslide regions. Secondly, altitude information is extracted based on dark channel prior for single mountain remote sensing image. Finally, we refine our results by analyzing the altitude information near suspected areas.

Block diagram of our algorithm (Color figure online)
2.1 Suspected Landslide and Debris Flow Areas Detection
-
(1)
Image features extraction
After observing a large number of landslide and debris flow areas, we choose the image features as follows:
The first part: RGB. The landslide and debris flow areas are always covered with a lot of mud mixture, which is showing a yellow to brown color state. Thus, RGB is a significant difference between landslide and debris flow areas and other typical surface features, such as green forests, blue-green rivers, and gray construction areas.
The second part: Image texture. Image texture represents the spatial arrangement information of color or intensities in an image or selected regions of an image. The co-occurrence matrix captures numerical features of a texture using spatial relations of similar gray tones. The contrast, correlation, energy and homogeneity computed from the co-occurrence matrix are used to classify textures.
-
(2)
Texture feature pre-processing with Slow feature analysis (SFA)
Slow feature analysis (SFA) is an unsupervised learning algorithm for extracting slowly varying features from a quickly varying input signal [9]. The learned functions tend to be invariant to frequent transformations of the input and the extracted slowly-varying signals that can be interpreted as generative sources of the observed input data. These properties make SFA suitable for many data processing applications. SFA is a one-shot algorithm, and is guaranteed to find the optimal solution (within the considered function space) in a single step.
In this paper, the slow feature analysis was used to improve the distinguishability of the extracted texture features. There are two types of data used in the experiment: landslide or debris flow areas, other areas (including green vegetation areas, rivers and buildings), and each type has about 3000 samples. The results are shown in Figs. 2 and 3, where the horizontal axis represents the number of pixels and the vertical axis represents the value of features. Figure 2 shows contrast, correlation, energy and homogeneity curves for original data. The red curve represents the feature values of landslide or debris flow areas, and the blue curve shows the features of other areas. Figure 3 shows the texture feature values processed by slow feature analysis.

Texture features before SFA (Color figure online)

Texture features after SFA (Color figure online)
By observing the original data (Fig. 2), it can be found that the two categories of the samples always have a large overlap, which is not conducive for classification. However, the distinction of the slowest feature (Fig. 3(a)) obtained after slow feature analysis is the best, indicating that slow feature analysis can improve the distinguishability. Thus, the slowest feature is selected as the input for the following model training based on support vector machine (SVM).
-
(3)
Landslide and debris flow detection based on SVM
Based on the above features, we use SVM [10] to detect suspected landslide and debris flow areas. Small areas (less than 100 pixels) are excluded as false objects. Then we used morphological closing using the structuring element 3 × 3 to remove the gap, and obtain the final suspected landslide and debris flow areas, as shown in Fig. 4(b). The white regions represent the suspected landslide or debris flow areas in Fig. 4(a). Figure 4 indicates that there are false landslides or debris flow areas in the primary detection result, such as the right parts because their image features are similar with those of the landslide or debris flow areas. To remove the false areas, the altitude information near the detected areas will be utilized.

Suspected landslide or debris flow areas detection result (b) for a remote sensing image (a).
2.2 Landslide and Debris Flow Areas Refinement Based on Altitude
To improve the detection accuracy, the altitude information generated based on dark channel prior [8] is then used for landslide and debris flow refinement. The main steps are listed as follows:
-
(1)
Extract the altitude information near suspected landslide or debris flow areas. We are interested in the periphery of these suspected landslide or debris flow regions, which can be obtained by morphological expansion. It should be noted that the periphery is not the bigger the better, because the farther the distance, the altitude of the periphery is likely to change, which means that it cannot be used to approximate the altitude of the suspected landslide or debris flow areas. By comparing experimental results, this paper determined the outward expansion of three pixels with disk-shaped structuring element, as shown in Fig. 5(a).
Fig. 5. 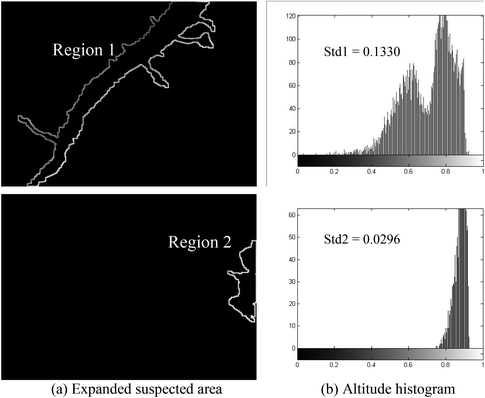
Suspected landslide or debris flow areas and the corresponding distribution of the peripheral altitude values in Fig. 4.
-
(2)
Remove false landslide or debris flow areas based on altitude distribution. Figure 5(b) shows the histogram of the altitude distribution in the peripheral areas (Fig. 5(a)). Since the altitude of the landslide or debris flow peripheral areas has a descending trend from high to low, they have a more dispersed altitude distribution than false areas. The standard deviation (Std) of the altitude histogram is used to describe the degree of dispersion, and remove false landslide or debris flow areas. From Fig. 5, we can observe that the standard deviation (0.0296) of the false landslide or debris flow area (region 2) is obviously lower than those of the real landslide or debris flow area (regions 1). Thus, we can set a proper threshold, such as 0.11, of the standard deviation to remove the false landslide or debris flow areas.

3 Experimental Results and Analysis
Due to the limitations of data sources, a landslide image, four debris flow images of Zhouqu and five debris flow images of other areas were collected. Figure 6 shows the detection result of the landslide image. Figures 7 and 8 show the detection results of two debris flow images of Zhouqu and other area, respectively.

Detection of a landslide image (Color figure online)

Detection of a debris flow image (Color figure online)

Detection of another debris flow image (Color figure online)
For quantitative analysis, three general quantitative evaluation indices are used, including precision, recall and accuracy. The greater the indices, the better the detection effect. These three indices are defined as follows:
Precision is the fraction of retrieved instances that are relevant: \( P = \frac{TP}{TP + FP} \). Recall is the fraction of relevant instances that are retrieved: \( R = \frac{TP}{TP + FN} \). Accuracy describes the ability to detect correctly of a classifier: \( A = \frac{TP + TN}{TP + FN + FP + TN} \). where TP, TN, FP and FN represent true positive, true negative, false positive and false negative, respectively.
Figures 6, 7 and 8 show the detection results of three images with landslide or debris flow, where (a) is the original images with landslide or debris flow, (b) is the suspected landslide or debris flow areas detected by support vector machine, (c) is the altitude map extracted from original images, (d) shows the manually calibrated landslide or debris flow areas that are taken as ground truth (GT), (e) is the final landslide or debris flow areas detected by our algorithm, (f) shows the deviation between our results and GT (red and blue mean the false and missing areas, respectively). From Figs. 6, 7 and 8, it can be found that the majority of false and missed areas appear in the edge of regions, and it has a certain relationship with GT. Table 1 shows the accuracy indices of landslide or debris flow detection with and without altitude information. Our algorithm can correctly detect the areas with landslide or debris flow in a single mountain remote sensing image. Meanwhile, Fig. 9 shows the comparison of two methods based on three indices, which also verifies that the landslide or debris flow detection with altitude is better than that without altitude.

Comparison of three indices
4 Conclusions
We propose a novel landslide and debris flow detection approach by combining altitude information from single mountain remote sensing image. Firstly, the effective image features of landslide and debris flow areas are extracted, and then the texture features are pre-processed by using SFA to obtain the slowest feature as input for SVM training. Secondly, the suspected landslide or debris flow areas are generated with SVM, and the altitude map is calculated by dark channel prior. Finally, we utilize the altitude information near the suspected landslide or debris flow areas to refine the primary detection results. The experimental results demonstrate that our method can accurately detect landslide or debris flow areas in a single mountain remote sensing image.
References
Graciela, M., Lorenz, H., Radu, G.: Remote sensing of landslides: an analysis of the potential contribution to geospatial systems for hazard assessment in mountainous environments. Remote Sens. Environ. 98(2), 284–303 (2005)
Tralli, D., Blom, R., Zlotnicki, V., Donnellan, A., Evans, D.L.: Satellite remote sensing of earthquake, volcano, flood, landslide and coastal inundation hazards. ISPRS J. Photogrammetry and Remote Sens. 59(4), 185–198 (2005)
Lu, H., Nakashima, S., Li, Y., Yang, S., Serikawa, S.: A fast debris flow disasters areas detection method of earthquake images in remote sensing system. Disaster Adv. 5(4), 796–799 (2012)
Wang, G., Cheng, G., Zhu, J., et al.: The effect of topography and satellite attitude parameters on early detection of regional landslides based on InSAR. In: Canadian Geothnical Conference (2016)
Liu, W., Yamazaki, F.: Detection of landslides due to the 2013 Thypoon Wipha from high-resolution airborne SAR images 2015. In: IEEE International Geoscience and Remote Sensing Symposium (IGARSS), pp. 4244–4247 (2015)
Barlow, J., Martin, Y., Franklin, S.: Detecting translational landslide scars using segmentation of landsat ETM + and DEM data in the northern cascade mountains, British Columbia. Can. J. Remote. Sens. 29(4), 510–517 (2003)
Li, C.: Detection of landslide with multi-resolution DEM. faculty of construction and environment, The Hong Kong Polytechnic University (2014)
Sheng, T., Chen, Q.: A dark channel prior based altitude extraction method for single mountain remote sensing image. IEEE Geosci. Remote Sens. Lett. 14(1), 132–136 (2017)
Wiskott, L., Sejnowski, T.: Slow feature analysis: Unsupervised learning of invariances. Neural Comput. 14(4), 715–770 (2002)
Gu, B., Sheng, V.S., Wang, Z., Ho, D., Osman, S., Li, S.: Incremental learning for v-support vector regression. Neural Netw. 67, 140–150 (2015)
Author information
Authors and Affiliations
Corresponding author
Editor information
Editors and Affiliations
Rights and permissions
Copyright information
© 2017 Springer International Publishing AG
About this paper

Cite this paper
Sheng, T., Chen, Q. (2017). An Altitude Based Landslide and Debris Flow Detection Method for a Single Mountain Remote Sensing Image. In: Zhao, Y., Kong, X., Taubman, D. (eds) Image and Graphics. ICIG 2017. Lecture Notes in Computer Science(), vol 10668. Springer, Cham. https://doi.org/10.1007/978-3-319-71598-8_53
Download citation
DOI: https://doi.org/10.1007/978-3-319-71598-8_53
Published:
Publisher Name: Springer, Cham
Print ISBN: 978-3-319-71597-1
Online ISBN: 978-3-319-71598-8
eBook Packages: Computer ScienceComputer Science (R0)
