
Abstract
Change detection in images taken from the same scene at different times is an important subtask in domains like remote sensing, medical diagnosis, or video surveillance. As human attention is limited, support by computing systems might be beneficial. In this contribution, the benefit of optimized image presentation and the availability of a change mask computed by an automated change detection algorithm is evaluated. In a user study, twelve participants performed change detection in different types of aerial images and aerial image sequences, using parallel side-by-side or alternating flicker image presentation, and performing with and without a change mask. The results show better change detection performance (higher hit rates, shorter completion time, less perceived workload) using the alternating flicker image presentation for the large majority of data sets. With an automated change mask available, the participants’ hit rates increase even more, up to 95% for image pairs and up to 84% for image sequence pairs.
You have full access to this open access chapter, Download conference paper PDF
1 Introduction
Image interpretation occurs in various domains, for example in remote sensing, video surveillance, radiology, or driver assistance systems. Detecting changes in images taken from the same scene at different points of time is an important subtask. In remote sensing, aerial photos of the same geographical region are compared, for example in order to detect changes in urban development [1, 2]. In radiology, MRI images of the same body region are compared, for example, to detect image changes for disease assessment [3, 4]. In dynamic environments, driver assistance systems must detect critical changes of environments [5], or in video surveillance [6], changes with respect to a certain static background have to be detected.
A human observer is able to perform such tasks quite well due to both visual and cognitive capabilities [7]. Particularly, the latter allows assessing visually distinguished differences in the images as task-relevant changes due to the observer’s expert knowledge. However, change blindness – not to notice that a change occurred – is a perceptual phenomenon indicating that human attention is limited [8]. Hence, support for the human observer is required and might be very beneficial. However, designing appropriate support might be challenging as stated for example by Parasuraman et al. [9].
In this contribution, two approaches for support of the human observer are investigated. One is optimized image presentation, aiming to make change perception for the human observer as easy as possible. The other one is assistance by automated change detection algorithms providing a change mask visualizing all automatically detected changes. In a user study, we evaluate the impact of the two approaches on human change detection performance when analyzing either aerial images or aerial image sequences. The remainder of this chapter describes characteristics of the two approaches and their consideration in the user study. Section 2 describes the methodology of the user study, Sect. 3 provides the results, and Sect. 4 the conclusion.
1.1 Image Presentation for Easy Perception of Changes
When doing change detection, the human observer scans the images serially, and systematically checks locations for task-relevant changes. The straightforward arrangement of two images is aligning them side-by-side, which is possible either in a printed version on a physical desktop, or on a screen. Using such parallel presentation requires repositioning of the observer’s eyes for each comparison at least once. Commercial systems like, for example, ERDAS Imagine provides side-by-side parallel presentation, in the following named “Parallel”. However, it also provides presenting the images alternately, aligned at the same position on screen, in the following named “Flicker”. Using Flicker presentation, the comparison of corresponding image areas does not require repositioning of the observer’s eyes. Furthermore, with aligned images, Flicker induces apparent motion for changes. As a result, new or vanishing objects flash and, hence, may be easier to detect; but numerous (flashing) changes might overload the observer’s visual system. In order to get insight on human performance using Parallel or Flicker image presentation both are evaluated in the user study.
1.2 Automated Change Detection in Aerial Imagery
Providing automated change detection is the first of four design principles St. John and Smallman proposed in order to support a human observer “maintaining and recovering situation awareness” [10]. In recent years, there has been much progress in this research domain [11]. Changes in aerial imagery from two flight missions (a previous and a current one) are detected automatically in three steps:
-
1.
Selection of two images of the observed scene area.
-
2.
Adaption of the image pair to each other geometrically (alignment) and radiometrically.
-
3.
Detection of changes by computing a change mask.
The main challenge consists in distinguishing between relevant changes for a certain task (e.g., persons, vehicles) and non-relevant changes (e.g., varying brightness, shadows, imaging artifacts, 3D parallax, and vegetation). In recent years, approaches of automated change detection applied to UAV video have been published which combine several image differencing methods. In this contribution, a change detection algorithm introduced by Saur and Krüger [12] is used. Using feature-based detection, directed change masks can be computed which distinguish between new and vanished objects. Such change masks might provide the human observer with a means for verification of their own change detection results. In order to get insight how change mask availability would influence human change detection performance, change masks are considered in the user study, too.
2 Methodology
Performing change detection, essentially, a binary classification task has to be accomplished. It is crucial to detect all task-relevant changes (“true positives”), and not to miss any of them (“false negatives”); furthermore, it is crucial not to include any not-task-relevant changes (“false positives”), but to disregard those as “true negatives”. Besides avoiding errors, it is also of interest to complete a change detection task in a short time. Hence, in the user study, the task instruction for the participants is to detect and frame changes in the aerial images and aerial image sequences, respectively, as fast as possible. In the following, the experimental design is described in detail.
2.1 Independent and Dependent Variables
As outlined above in the introduction, the user study aims to determine the impact of the two user interface design aspects Image presentation and Change mask to human change detection performance. Hence, there are two 2-level factors (independent variables) modified during the experiment: Image presentation with levels Parallel and Flicker, and Change mask with levels Provided and Not Provided. Combination results in four experimental conditions to evaluate:
-
Parallel + Change mask not provided (in the following abbreviated Par, Fig. 1)
Fig. 1. 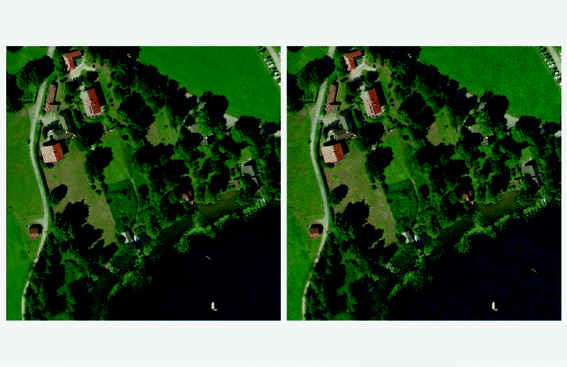
Screenshot example for Par: Parallel presentation of an aerial image pair, left: image 1, right: image 2.
-
Parallel + Change mask provided (ParCM, Fig. 2)
Fig. 2. 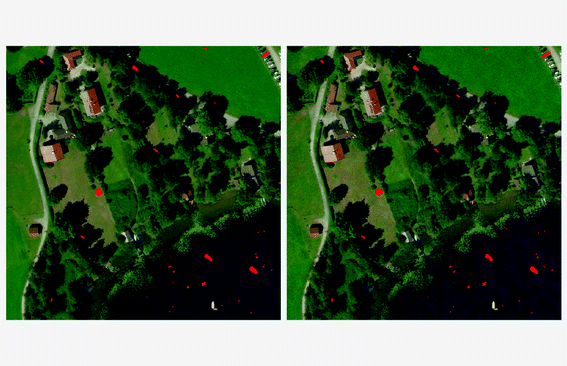
Screenshot example for ParCM: Parallel presentation with change mask provided on both images.
-
Flicker + Change mask not provided (Fli, Figs. 3 and 4)
Fig. 3. 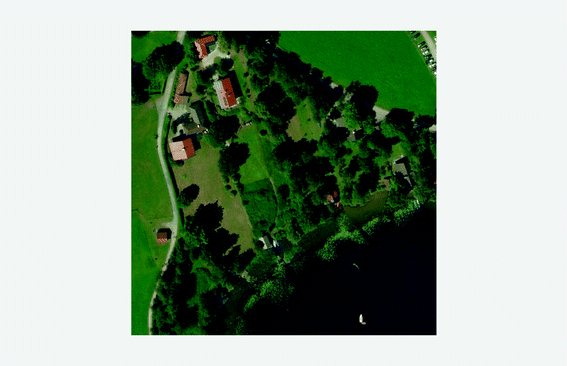
Screenshot example for Fli: Flicker presentation of image 1 from the aerial image pair.
Fig. 4. 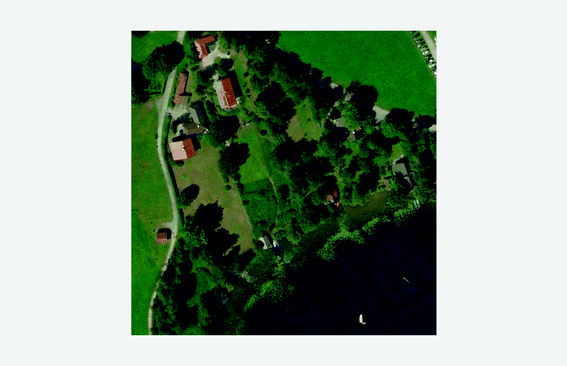
Screenshot example for Fli: Flicker presentation of image 2 from the aerial image pair.
-
Flicker + Change mask provided (FliCM, Fig. 5)
Fig. 5. 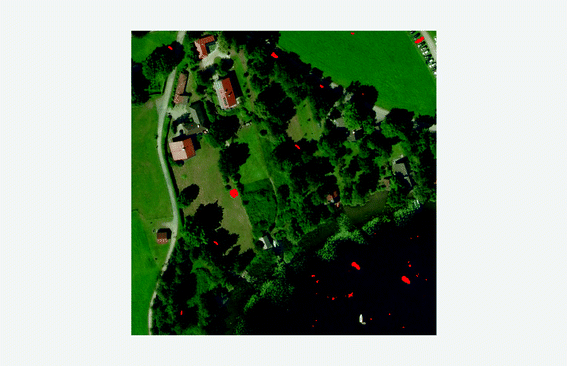
Screenshot example for FliCM: Flicker presentation with change mask provided (exemplary for image 1 from the aerial image pair).


Figures 1, 2, 3, 4 and 5 show for one exemplary aerial image pair how images are presented using the experimental system (see Sect. 2.4). Flicker presentation Fli is provided by displaying the image of Figs. 3 and 4 alternately. Figure 5 shows the FliCM condition in an exemplary way only for Image 1.
Considered dependent variables describing effectiveness are hit rate (aka recall)
and precision
with \( t_{p} \) representing task-relevant changes correctly framed, \( f_{n} \) representing not-task-relevant changes correctly not framed, and \( f_{p} \) representing not-task-relevant changes incorrectly framed.
Further considered dependent variables are efficiency as task completion time, and user workload measured using the NASA-TLX questionnaire [13, 14].
2.2 Test Tasks
Visual Stimuli (Image Data) and Task Instructions for Single Trials.
The four experimental conditions are evaluated using four different data sets. The three data sets A to C use pairs of aerial images; data set D uses pairs of aerial image sequences. In order to cover different image types occurring in image analysis, data sets A and B use orthophotos derived from data material purchased form the Agency for Digitization, High-Speed Internet and Surveying (Bavaria, Germany), and data sets C and D use UAS imagery used by Saur and Krüger [12] for investigation of automated change detection. Furthermore, the data sets differ in terms of the amount of present not-task-relevant changes like shadows.
-
Data set A, in the following named Ortho, contains pairs of orthophotos captured several years apart (Fig. 6); task instructions tell to frame changes observed for “vehicles”, “grave changes in infrastructure and vegetation (new/missing buildings, streets, electricity pylons, pieces of forest, bank building)”, and “structural modifications on buildings (roofs, solar panels)”.
Fig. 6. 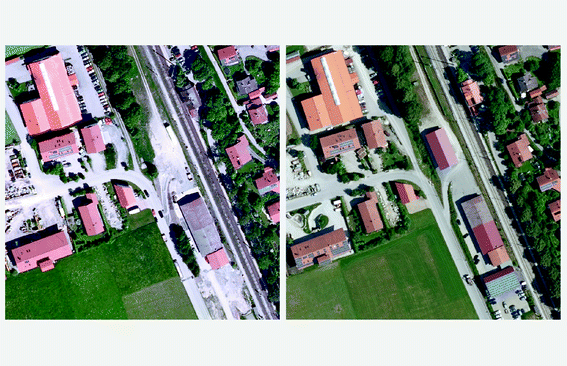
Data set A Ortho image pair as provided in Parallel presentation by the experimental system. Task instruction: please frame observed large changes in buildings (answer: one roof, one solar panel, and two complete new/missing buildings).
-
Data set B, in the following named OrthoFake, consists of image pairs of an original orthophoto and a manually modified fake version (objects added/retouched, some image noise added; Fig. 7, also Fig. 1); task instructions tell to frame changes observed for “vehicles (cars, tractors, boats)”, or “all object types (e.g., vehicles, containers, trees, hay bales, buildings)“.
Fig. 7. 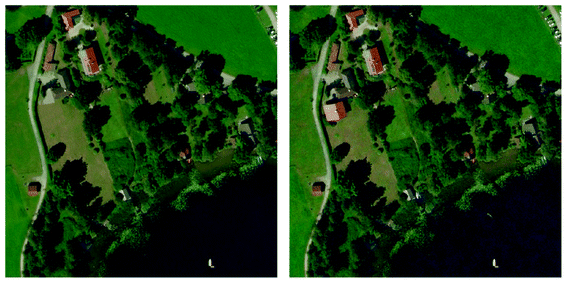
Data set B OrthoFake image pair. Task instruction: please frame observed changes in buildings and vehicles (answer: one new/missing building, two boats, one group of cars).
-
Data set C, UASimage, contains UAS image pairs captured some minutes up to several hours apart (Fig. 8); task instructions tell to frame changes observed for “vehicles”, “cars“, “trucks”, “persons”, or “persons on the street”.
Fig. 8. 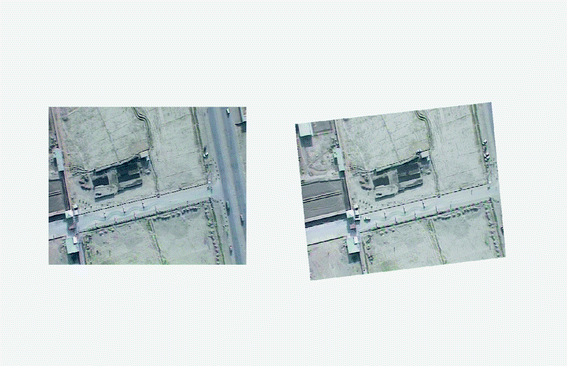
Data set C UASimage image pair as provided in Parallel presentation by the experimental system. Task instruction: frame observed changes in (new/missing) parking cars (answer: five changes).
-
Data set D, UASimSeq, consists of pairs of UAS video sequences captured several hours apart (Fig. 9); all pairs have a duration of about 4 s. Task instructions told framing changes observed for “persons”, or “parking vehicles/cars/trucks”.
Fig. 9. 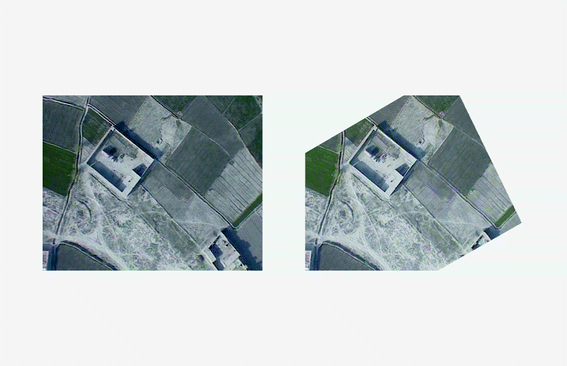
Data set D UASimSeq image pair as provided in Parallel presentation by the experimental system. Task instruction: please frame observed changes in persons (answer: three changes, one of them currently visible).


Table 1 shows the characteristics of the data sets including the numbers of task-relevant changes. The differing numbers of trials issued from the fact that there was less UAS image material than orthophoto material available. Furthermore, the image content of the UAS image material provided less options for changes which could be precisely phrased in a task instruction. In total, there were 68 test tasks, 58 single image pairs, and 10 image sequence pairs.
Presentation and Utilization of Change Mask.
There are two ways the observer may include a change mask into their change detection procedure:
-
Looking for changes autonomously and utilizing the change mask afterwards for confirmation of the determined result.
-
Displaying the change mask from the beginning and verifying all locations, the change mask marks as changes.
While the second method might be useful in certain situations, the first method appears to be the more general method with the advantage of the observer considering the image data unprejudiced. Hence, this was the method applied in the user study.
For image pair data sets OrthoFake and UASimageFootnote 1, participants were advised to first carefully search the images for changes and frame them (Fig. 10). When feeling confident having found all changes or just having inspected the images thoroughly, they ought to check their results by superimposing the change mask using a functional key (see Fig. 11 for FliCM, Fig. 12 for ParCM).

Fli presentation of image 1 from the OrthoFake aerial image pair (see Fig. 3) with framed changes.

FliCM presentation of OrthoFake aerial image 1 with framed changes and superimposed change mask (see Fig. 5).

ParCM presentation of a UASimage image pair with framed changes (Task instruction: changes in parking cars) and superimposed change mask (see Fig. 8).
For the image sequence data sets UASimSeq, using a functional key for superimposing a change mask to verify detected changes does not work as due to scene dynamics there is not enough time left. Hence, each image sequence is presented twice to the participants: the first time without change mask, and the second time immediately after with the change mask provided as a continuously displayed red transparent overlay (see Fig. 13 for ParCM, Figs. 14 and 15 for FliCM). Participants now use the change mask in the second way outlined above: they perceive the change mask’s change suggestions and confirm them by framing, or ignore them. However, due to the short image sequence duration and the relatively few changes, participants may be able to recall what they just framed in the condition without change mask. Hence, they basically utilize the change mask for confirmation of their own result, again, similar to the first way outlined above.

ParCM presentation of UASimSeq pair with superimposed change mask (currently one change visible, see Fig. 9) (Color figure online)

FliCM presentation of image 1 of a UASimSeq pair (Fig. 9, left) with superimposed change mask and frame (currently one task-relevant change visible). (Color figure online)

FliCM presentation of image 2 of the UASimSeq pair (Fig. 9, right) on top of image 1 with superimposed change mask (currently one task-relevant change visible). (Color figure online)
The change mask for each image pair or image sequence pair was calculated using the algorithm described in Sect. 1.2 [12].
2.3 Participants
Twelve subjects (3 female, 9 male, average age 27 (SD 6) years), all non-expert image analysts, participated in the user study. All had normal or corrected to normal vision (4 using glasses, 1 using contract lenses).
All participants completed each type of test data set using both Parallel and Flicker image presentation. To ensure that each participant is presented only once with each pair of images/image sequences, test trials of each test data set were divided into two equal parts I and II. Thus, each participant completed both for Parallel and Flicker presentation 8 Ortho trials, 12 OrthoFake trials, 9 UASimage trials, and 5 UASimSeq trials. Participants performed the two presentation types immediately after another; within each data set, half of the participants first performed using Parallel, the other half started using Flicker. Six participants used test sets I with Parallel presentation, and test sets II with Flicker presentation, the other six participants used test sets II with Parallel, and test sets I with Flicker. Test data set order varied using a Latin Square, resulting in four different orders, each completed by three participants:
-
Ortho – OrthoFake – UASimage – UASimSeq
-
OrthoFake – UASimage – UASimSeq – Ortho
-
UASimage – UASimSeq – Ortho – OrthoFake
-
UASimSeq – Ortho – OrthoFake – UASimage
2.4 Apparatus
For presentation of the test tasks, an experimental system was implemented (Java application). It provides both Parallel and Flicker presentation for image pairs and for image sequence pairs. For presentation, a 24 in screen with a resolution of 1920 × 1200 pixels was used. Participants were sitting with a distance of 65 cm to the screen.
Parallel presentation displays the Ortho and OrthoFake images centered and covering (width x height) 20.9° × 20.9° of visual angle; Flicker presentation is also centered and covers 23.5° × 23.5°. Switching between images can be performed manually using a functional key, however, in the user study, it was accomplished automatically every 600 ms. This decision was made to avoid additional manual load.
UASimage and UASimSeq pairs are displayed centered covering 17.1° × 13.6° of visual angle for both Parallel and Flicker presentation. Image 1 is displayed aligned with the screen (see for example Figs. 12(left), 13(left), 14, and 15 where image 1 is partially covered by image 2). Image 2 is displayed geometrically adapted to image 1 (see Fig. 12 for Parallel, Fig. 16 for Flicker). For UASimSeq data, image 2 is in addition trimmed showing only the overlapping parts with image 1 (see Figs. 13(right) and 15). This was done as the dynamic input of the UASimSeq pairs is quite loading for the visual system of the observer, particularly, for Flicker with the automated image switching every 600 ms. Only the overlapping image parts are relevant for change detection, so trimming helps reducing the dynamics by cutting off irrelevant image parts. As all UASimSeq pairs were presented with both Flicker and Parallel, the trimmed version was used for both presentations.

Flicker presentation of UASimage pairs, image 1 aligned with screen, image 2 (currently underlying) geometrically adapted to image 1.
The sizes of the target changes cover for Ortho between 0.5° × 0.26°of visual angle for the smallest targets and 7° × 3.5° for the largest targets; for OrthoFake sizes cover between 0.18° × 0.18° and 2.2° × 2.2°; for UASimage as well as for UASimSeq sizes cover between 0.18° × 0.18° to 2.2° × 0.44°.
Framing is accomplished by a point-select-operation using the gaze + key press interaction technique, performing a selection operation (NumPad-ENTER-key) on gaze pointing at the change location; frame size is 2.4° × 2.4° as a compromise for all occurring target change sizes. This interaction technique is used as it had allowed significantly faster while equally accurate performance than mouse input for moving target selection (framing) in videos [15], which happens for the data set D UASimSeq. Gaze pointing was provided using a Tobii X60 remote eye-tracking device. The manufacturer reports a 60 Hz sampling rate, a typical accuracy of 0.5° (with head movements additional 0.2°), and a head movement box of 44 cm × 22 cm (width × height) at a distance of 70 cm from the monitor; hence, no chinrest was used (as for an observer in practice). In order to reduce the measurement uncertainty arising from technical issues of gaze estimation in the eye-tracker as well as from physiological issues of the human eye, the raw gaze data provided by the eye-tracker is processed using the algorithm introduced by Kumar et al. [16]. Additional evaluation of mouse input was dispensed as this would have exceeded the recommended session duration.
2.5 Procedure
After a short introduction about the character of the test tasks, the participants performed a standard 9-point calibration for the Tobii X60 eye-tracking device. The participants repeated calibration until the average measurement uncertainty on screen was 1° of visual angle or less.
After that, the participants completed the four test data sets with Parallel and Flicker presentation. Before each test data set, the participants completed a short training using an image (sequence) pair, which was not part of the test data to get familiar with the interaction. Each trial started with a 5-s display of the task instruction provided in large keys on the screen, followed by the display of the images or image sequences. In case of the image pairs, the participants first looked for changes, and afterwards checked their result superimposing the change mask using a functional key. In case of the image sequence pairs, they first performed the trial without change mask, and right after with change mask (cf. explanations in Sect. 2.2). After each test data set, the participant answered the NASA-TLX questionnaire in order to rate their subjectively perceived workload. They rated the six subscales mental demand, physical demand, temporal demand, performance, effort, and frustration on a 21-point rating scale (the best rating is 0, the worst rating is 100, the scale uses steps of five).
Finally, the participant answered the ISO 9241-9 questionnaire [17] assessing the gaze interaction used for change framing.
3 Results and Discussion
The results are put together in Table 2 in order to show the participants’ performance using the Parallel and the Flicker image presentations at a glance for the different data sets. All results are provided as means (+ one standard deviation). The completion time (CT) for the OrthoFake and UASimage data sets give the completion time without using the change mask in the Par and Fli columns, and the overall completion time after checking the self-determined result using the change mask in the ParCM and FliCM columns.
For the Ortho image pairs, participants showed similar performance. The hit rate is on average a little higher using Fli – participants detected slightly more task-relevant changes – but a paired sample t-Test (\( \alpha = 0.05 \)) showed no significant difference. Differences are also not significant for precision, completion time and the NASA-TLX score.
For the OrthoFake image pairs, participants performed better using Fli than using Par. A paired sample t-Test (\( \alpha = 0.05 \)) showed that there is a significant difference for hit rate (p < 0.001) and completion time (p < 0.001) as well as for workload (Wilcoxon signed-rank test for paired samples (\( \alpha = 0.05 \)) revealed significant differences with p < 0.01). Precision is very high (0.99), and similar for the two presentation modes. Providing a change mask improves the hit rates significantly for the two presentation modes. The improvement is particularly high when using Parallel presentation. However, the participants performed significantly better (p < 0.01) using Fli (Flicker without a change mask) than using ParCM (Parallel with a change mask). Using FliCM, the participants achieved a very high hit rate and precision with less than half of the completion time (on average) required using ParCM. The subjective workload was also much lower for Flicker presentation.
For the UASimage image pairs, participants also performed better using the Flicker presentation. Paired sample t-Tests (\( \alpha = 0.05 \)) showed significant difference for hit rate (Fli-Par p < 0.01, FliCM-ParCM p < 0.01), for precision (Fli-Par p < 0.05), and for completion time (p < 0.001); a Wilcoxon signed-rank test for paired samples (\( \alpha = 0.05 \)) revealed significant differences for perceived workload with p < 0.01. Providing a change mask improves the hit rates significantly for the two presentation modes (Par-ParCM p < 0.001, Fli-FliCM p < 0.001). Using FliCM, the participants achieved a very high hit rate and precision with a significantly shorter completion time and perceived workload.
For the UASimSeq image sequence pairs, participants performed best using FliCM. Looking at FliCM and ParCM, precision is significantly better for FliCM (p < 0.05); the difference for the hit rates is not significant (p = 0.1089), but better on average for FliCM. For both presentation types, the change mask conditions allowed significantly better hit rates (Fli-FliCM p < 0.01; Par-ParCM p < 0.05) and precision (Fli-FliCM p < 0.001; Par-ParCM p < 0.001). Considering workload, a Wilcoxon signed-rank test for paired samples (\( \alpha = 0.05 \)) revealed significant differences for perceived workload with p < 0.01.
In summary, the participants achieved for the three datasets OrthoFake, UASimage and UASimSeq better performance using the Flicker presentation than using the Parallel presentation. They achieved not only higher hit rate and precision, but achieved those results in considerably shorter completion time and with less perceived workload. Providing a change mask improved hit rate and precision substantially for both presentation modes. Obviously, the less required gaze repositioning together with the apparent motion induced by the Flicker presentation had a beneficial impact on the overall performance.
For the data set Ortho, the participants performed similar with the two presentation modes, and the perceived workload was similar, too. As mentioned before in Table 1, the other three data sets comprised only few to several not-task-relevant changes; the Ortho data set comprised plenty not-task-relevant changes, making it more difficult to find the relevant changes within the plenty. Using the Flicker presentation, the not-task-relevant changes have a distracting impact on the observer’s attention. Hence, the Flicker presentation might not have the same beneficial effect as for cases with less not-task-relevant changes. However, all participants voted for Flicker presentation as their favorite for all data sets.
Furthermore, all participants appreciated the change mask very much. They assessed the visual presentation (opaque red for single images, transparent red for image sequences) to be well perceivable and very beneficial for their overall change detection performance.
The participants also appreciated the gaze interaction technique gaze + key press for framing the changes. Figure 17 shows the results of the ISO 9241-411 questionnaire, where several features have to be rated on a 7-point-scale (1: very bad, 7 very good). All features got a good rating. The little lower value for accuracy might come from the fact that users are used to pixel-level mouse accuracy. However, eye-tracker accuracy is not on a pixel-level (see Sect. 2.4) due to measurement uncertainty of the eye-tracker, and in addition, framing targets in an image sequence is challenging and typically not possible on pixel-level either. Overall, gaze input might be an alternative for framing changes when performing change detection using a computer system.

Results of the assessment of the gaze input technique used for change framing.
4 Conclusion
Change detection in images taken from the same scene at different times is an important subtask in various domains. As human attention is limited, human observers require support in order to increase their overall change detection performance. The presented user study investigated how two system features would affect change detection performance:
-
Image presentation (Flicker: alternating and aligned at the same position on the screen versus Parallel side-by-side), and
-
Availability of change mask calculated for the image pair by an automated algorithm.
The results show that the twelve participants performed similar with Flicker and Parallel when looking for changes in aerial image pairs comprising plenty of not-task-relevant changes; average hit rates (precision) were 85% (83%) for Flicker versus 80% (87%) for Parallel.
For image pairs containing few to several not-task-relevant changes, the participants performed substantially better using Flicker presentation. They achieved significantly higher hit rates (up to 88%) and higher precision (up to 99%), they required substantially shorter completion time (up to 50 percent less on average), and they perceived less workload. Providing the participants in addition with a change mask calculated by an automated change detection algorithm improved the overall change detection performance again substantially, enabling hit rates for Flicker up to 95% on average (up to 86% for Parallel).
For image sequence pairs, the participants performed only slightly better using Flicker presentation if no change mask was provided; achieved hit rate was 56% on average (versus 51% for Parallel), precision was 78% (versus 67% for Parallel). Providing a change mask improved hit rate and precision again substantially: for Flicker, the hit rate improved to 84% on average (precision to 90%); for Parallel, the hit rate improved to 76% (precision to 80%).
To conclude, using Flicker image presentation and providing a change mask, participants achieved the best change detection performance, with a hit rate of up to 95% for image pairs and up to 84% for image sequence pairs.
Notes
- 1.
For data set Ortho, change masks provided very many false positives due to shadows and vegetation and were hence not included in the user study.
References
Bouziani, M., Goïta, K., He, D.C.: Automatic change detection of buildings in urban environment from very high spatial resolution images using existing geodatabase and prior knowledge. ISPRS J. Photogram. Remote Sens. 65(1), 143–153 (2010)
Leichtle, T., Geiß, C., Wurm, M., Lakes, T., Taubenböck, H.: Unsupervised change detection in VHR remote sensing imagery–an object-based clustering approach in a dynamic urban environment. Int. J. Appl. Earth Obs. Geoinf. 54, 15–27 (2017)
Doi, K.: Diagnostic imaging over the last 50 years: research and development in medical imaging science and technology. Phys. Med. Biol. 51(13), R5 (2006)
Bosc, M., Heitz, F., Armspach, J.P., Namer, I., Gounot, D., Rumbach, L.: Automatic change detection in multimodal serial MRI: application to multiple sclerosis lesion evolution. Neuroimage 20(2), 643–656 (2003)
Fang, C.Y., Chen, S.W., Fuh, C.S.: Automatic change detection of driving environments in a vision-based driver assistance system. IEEE Trans. Neural Netw. 14(3), 646–657 (2003)
Hodgetts, H.M., Vachon, F., Chamberland, C., Tremblay, S.: See no evil: cognitive challenges of security surveillance and monitoring. J. Appl. Res. Mem. Cognit. 6(3), 230–243 (2017)
Spotorno, S., Faure, S.: Change detection in complex scenes: hemispheric contribution and the role of perceptual and semantic factors. Perception 40(1), 5–22 (2011)
Styles, E.: The Psychology of Attention. Psychology Press, New York (2006)
Parasuraman, R., Cosenzo, K.A., De Visser, E.: Adaptive automation for human supervision of multiple uninhabited vehicles: effects on change detection, situation awareness, and mental workload. Mil. Psychol. 21(2), 270 (2009)
John, M.S., Smallman, H.S.: Staying up to speed: four design principles for maintaining and recovering situation awareness. J. Cognit. Eng. Decis. Mak. 2(2), 118–139 (2008)
Hussain, M., Chen, D., Cheng, A., Wei, H., Stanley, D.: Change detection from remotely sensed images: from pixel-based to object-based approaches. ISPRS J. Photogram. Remote Sens. 80, 91–106 (2013)
Saur, G., Krüger, W.: Change detection in UAV video mosaics combining a feature based approach and extended image differencing. IPRS Int. Arch. Photogram. Remote Sens. Spat. Inf. Sci. XLI-B7, 557–562 (2016)
Hart, S.G.: NASA-task load index (NASA-TLX); 20 years later. In: Proceedings of the Human Factors and Ergonomics Society Annual Meeting, vol. 50, no. 9, pp. 904–908. Sage Publications, Los Angeles (2006)
NASA TLX Homepage. https://humansystems.arc.nasa.gov/groups/TLX/downloads/TLXScale.pdf. Accessed 05 Feb 2018
Hild, J., Kühnle, C., Beyerer, J.: Gaze-based moving target acquisition in real-time full motion video. In: Proceedings of the Ninth Biennial ACM Symposium on Eye Tracking Research & Applications, pp. 241–244. ACM, New York (2016)
Kumar, M., Klingner, J., Puranik, R., Winograd, T., Paepcke, A.: Improving the accuracy of gaze input for interaction. In: Proceedings of the 2008 Symposium on Eye Tracking Research & Applications, pp. 65–68. ACM, New York (2008)
ISO: 9241–411 Ergonomics of human-system interaction–Part 411: Evaluation methods for the design of physical input devices. International Organization for Standardization (2012)
Author information
Authors and Affiliations
Corresponding author
Editor information
Editors and Affiliations
Rights and permissions
Copyright information
© 2018 Springer International Publishing AG, part of Springer Nature
About this paper

Cite this paper
Hild, J., Saur, G., Petersen, P., Voit, M., Peinsipp-Byma, E., Beyerer, J. (2018). Evaluating User Interfaces Supporting Change Detection in Aerial Images and Aerial Image Sequences. In: Yamamoto, S., Mori, H. (eds) Human Interface and the Management of Information. Information in Applications and Services. HIMI 2018. Lecture Notes in Computer Science(), vol 10905. Springer, Cham. https://doi.org/10.1007/978-3-319-92046-7_33
Download citation
DOI: https://doi.org/10.1007/978-3-319-92046-7_33
Published:
Publisher Name: Springer, Cham
Print ISBN: 978-3-319-92045-0
Online ISBN: 978-3-319-92046-7
eBook Packages: Computer ScienceComputer Science (R0)