
Abstract
The gaming industry always faces the continual challenges of striking balance between real-time computing performance and graphics presentation quality. This is particularly apparent for a game with vast wildlands scenes which demands for a large number of tree models. From the visual perception perspective, this paper investigated whether people can distinguish trees with uniqueness of various features (relative orientation, density of branches, leaf color) using the same tree model in a virtual environment. During the controlled experiment, quantitative research methods were used, which measured the statistics of tree variations. The results suggested that our methods successfully contributed a strategy in saving graphic resources without user consciousness and maintaining high graphics performance.
You have full access to this open access chapter, Download conference paper PDF
1 Introduction
In real life, no two trees look alike. But in a virtual environment, it would be nice if we can replicate the richness of natural environment of the real world. Many adventure games often feature vivid and complex forest landscapes for the purpose of players’ immersion. Thousands of trees have to be rendered in real time (with less than 8 ms) for an immersive environment, which requires a significant amount of resources in the development and digital stages of production. Figure 1 gives an example of huge density of tree models rendering in a virtual environment. Currently, many games mostly employed techniques such as planar texture maps, simple tree structures, or Level of detail (LOD) for forest, which unavoidably create an unrealistic experience.

A real-time rendered forest using only two tree models.
Human perception has a limited capacity to process visual stimuli. For example, research has found that for a crowd of people in a 3D animation, which only needs three variations of human figures so that users will consider the crowds are realistic [3]. In this research, we investigated human perception of trees within a virtual environment. Our goal was to find a balance between the number of tree variations and human perception. Our objective was to identify the limits of human perception so that developers can spend less effort and minimum resources on tree construction while still producing realistic effects.
The remainder of this paper is structured as follows. In Sect. 2, we briefly review the related work on human perception and tree modeling. In Sect. 3, we describe our experiment in detail. In Sect. 4, we present our results and perform the analysis. In Sect. 5, we make our conclusions and summarize the contribution. In Sect. 6, we discuss the experiment limitations and suggestions for future work.
The assumptions of this study were: Participants responded accurately and honestly during comparing paired renderings, followed by answering the percentage of similarity based on whether they can distinguish trees according to their perception. Participants had basic knowledge of trees and spatial ability in virtual environment to accomplish the whole experiment. The number of participants was enough for the study to gain results. Global illumination, hardware, and rendering method remained the same in each scene shown to participants. The study methods were appropriate to gain results answering the research question.
The limitations of the study were: The trees models rendered within virtual environments were limited to available hardware. The study was limited to cooperation of subjects to take experiment and their availability.
The delimitations of the study were: The study focused on intuitive interactions between human and virtual environments. One months allotted to engage the participants.
2 Related Work
Investigating human perception of virtual environments, especially of computer games, or integrating the procedural modeling of trees into a virtual environment, either of two is not a new idea. However, the previous literature lacked a consolidated approach to cover both aspects simultaneously.
From human perception perspective, Boot et al. [1] designed tasks to discover the perceptual and cognitive impacts of playing entertainment games. Hoyet et al. [2] provided statistical methods for the comparison of variations. Sakaguchi and Ohya [4] proposed a modeling and animation methods for botanical trees in an interactive virtual environment, which gave “a new top-down approach in which a tree’s form is defined by volume data that is made from a captured real image set, and the branch structure is realized by simple branching rules” (p. 272). Smelik et al. [5] developed a survey on procedural modeling (PM) in virtual environments using PM tools.
The related work provided valuable reference and inspired our idea described in the paper.
3 How People Distinguish Trees in a Virtual Environment
Our approach emphasized human perception by showing participants groups of trees with uniqueness of different factors in order to measure whether they could recognize two trees using the same model under some conditions. Our experiment used quantitative methods for experiment design and data analysis. In the experiment, three parts were used separately. For the first part, we tested whether user could distinguish trees with the uniqueness of relative orientation changed. For the second part, we tested whether user could distinguish trees with the uniqueness of density of branches changed. For the third part, we tested whether user could distinguish trees with the uniqueness of leaf color changed.
We used multiple variations but let them be tested separately one by one and randomly ordered the variations for subjects to construct our control and experiment groups. The variations included relative orientation (the clockwise angle from the initiating orientation to the experimental orientation), branch density (the number of branches on a specific length of trunk), and leaf color. The experiment required one-sample t-test statistical analysis for each variation. Figure 2 provides examples of tree variations.

Left: the original tree model; Center: the tree model with relative orientation changed; Right: the tree model with both relative orientation and leaf color changed. (Color figure online)
The experiment environment was as follows: a Windows 10 home 64-bit (10.0, Build 14393) operating system, Inter(R) Core(TM) i7-6700HQ CPU @ 2.60 GHz (8 CPUs) processor, GeForce GTX 1080 graphics card, 16384 MB RAM memory, and using DirectX 12 APIs.
The paper was intended to make statistical inference about the population of all the users on Amazon Mechanical Turk. Voluntary sampling was used in experiment. Subjects were recruited on Amazon Mechanical Turk randomly and they got reward for participating the experiment.
The survey questions were posted on Amazon Mechanical Turk. Before the start of survey, subjects were given an application narrative form. If they agreed to all, then jumped into the survey questions page. If not, ended the survey. After subjects have answered the survey questions, the survey ended. The response from the subjects on all three survey questions were collected.
3.1 Effects on User Perception of Uniqueness of Relative Orientation
As in Fig. 3, a rendering of two trees was shown to subjects at the same time. Both trees used the same geometry models with only the orientation of the right one was changed by 90° compared to the left one. Subjects were given a slider to choose a percentage on how much similarity they considered between the left tree and the right tree. The scale of the slider was between 0 and 100.

Tree models with only relative orientation changed.
The null hypothesis was people could not distinguish trees using the same model with relative orientation increased by 90° (µ1 = 0). The alternative hypothesis was people could distinguish trees using the same model with relative orientation increased by 90° (µ1 ≠ 0).
The test statistics is calculated as follows:
where \( \overline{x} \) is the sample mean, s is the sample standard deviation of the sample, n is the sample size.
Set significant level α as 0.01. If the p-value of the t test was smaller than this statistical significance, then the null hypothesis was rejected. If not, we could not reject the null hypothesis.
3.2 Effects on User Perception of Uniqueness of Density of Branches
In terms of density of branches, as Fig. 4 shown, a rendering of two trees was shown to subjects at the same time Both models used the same models with only the branches of the right one was procedurally decreased by 4 compared to the left one. Subjects were given a slider to choose a percentage on how much similarity they considered between the left tree and the right tree. The scale of the slider was between 0 and 100.

Tree models with only density of branches changed.
The null hypothesis was people could not distinguish trees using the same model with branches procedurally decreased by 4 randomly (µ2 = 0). The alternative hypothesis was people could distinguish trees using the same model with branches procedurally decreased by 4 randomly (µ2 ≠ 0).
The test statistics was shown in Sect. 3.1. Set significant level α as 0.01. If the p-value was smaller than statistical significance, then the null hypothesis was rejected. If not, we could not reject the null hypothesis.
3.3 Effects on User Perception of Uniqueness of Leaf Color
For the leaf color, Fig. 5 shows rendering of two trees was shown to the subjects at the same time. Both models used the same models with only the leaf color of the right one was changed to brown while the left one was green. Subjects were given a slider to choose a percentage on how much similarity they considered between the left tree and the right tree. The scale of the slider was between 0 and 100.

Tree models with only leaf color changed.
The null hypothesis was people cannot distinguish trees using the same model with leaf color changed from green to brown (µ3 = 0). The alternative hypothesis was people can distinguish trees using the same model with leaf color changed from green to brown (µ3 ≠ 0).
The test statistics was shown in Sect. 3.1. Set significant level α as 0.01. If the p-value was smaller than statistical significance, then the null hypothesis was rejected. If not, we could not reject the null hypothesis.
4 Results and Analysis
Results.
The data from three parts of the experiment was collected separately. We recruited 25, 26, and 23 subjects for part 1, 2, and 3 respectively. We had the one-sample t-test results for part 1, 2, and 3 using SAS (Tables 1, 2 and 3).
Analysis.
From the tables and graphs, we obtained some findings from the data:
-
The three factors showed significant effects on user perception. The subjects could not distinguish tree models when we altered a single unique factor, be it relative orientation, density of branches, or leaf color, changed in some extents, while we were using essentially the same tree model.
-
For each factor, the distribution graphs depicted that the data was in accordance with normality, which means the statistical inference we made was valid and reliable. Thus, the results we gained from the sample data are generalizable and can be used for future applications.
-
The factor, relative orientation changed by 90°, is the most effective factor among the three factors. Changing relative orientation could be an easy and effective approach for the industry to adopt when they are to build art resources asset libraries and to gain good game experience for players.
-
The ranking of the effects on the three factors:
$$ {\text{Relative}}\,{\text{orientation}} > {\text{Density}}\,{\text{of}}\,{\text{branches}} > {\text{Leaf}}\,{\text{color}} $$ -
The leaf color was the most controversial factor among the three factors for the experimenting subjects. A number of subjects thought the two trees using nearly totally different model while some subjects recognized them using the same model. It might not be the first choice for industry to change leaf color when they intended to reduce art resources and seek for great performance (Fig. 6).
Fig. 6. 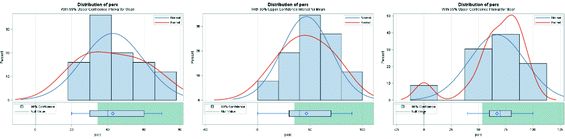
From left to right: The statistics distribution graphs from the response of similarity of paired tree renderings in all three factors: relative orientation, density of branches, and leaf color.

5 Conclusions
Our research contributed a new strategy for the gaming industry to save art and computing resources from a user experience perspective. Changed relative orientation by 90°, density of branches procedurally decreasing by 4, and change leaf color from green to brown are all effective methods to increase vegetation variety within a virtual environment using limited geometry models. Because only a few tree models are required to be loaded into the scene, game designers can allocate more resources on other development tasks and create a faster iterative design feedback loop. Our strategy on reducing GPU and CPU usage also implies that gamers will have smoother user interactions and experience as well.
6 Future Work
In this study, we recruited subjects from Amazon Mechanical Turk, which did not include the people under 18 years old according to the AMT’s term. In future works, we will investigate users including teens and kids to find out whether these factors still have significant effects on people group of younger ages.
We only investigate one factor at one level at a time for each part of experiment for the moment. In future works, multiple levels can be tested to obtain a quantitative relation on how much extent can people distinguish tree models. Moreover, more factors can be introduced in the experiment to test the effects on user perception.
References
Boot, W.R., Kramer, A.F., Simons, D.J., Fabiani, M., Gratton, G.: The effects of video game playing on attention, memory, and executive control. Acta Psychol. 129(3), 387–398 (2008)
Hoyet, L., Ryall, K., Zibrek, K., Park, H., Lee, J., Hodgins, J., O’sullivan, C.: Evaluating the distinctiveness and attractiveness of human motions on realistic virtual bodies. ACM Trans. Graph. (TOG), 32(6), 204 (2013)
Pražák, M., O’Sullivan, C.: Perceiving human motion variety. In: Proceedings of the ACM SIGGRAPH Symposium on Applied Perception in Graphics and Visualization, pp. 87–92 (2011)
Sakaguchi, T., Ohya, J.: Modeling and animation of botanical trees for interactive virtual environments. In: Proceedings of the ACM Symposium on Virtual Reality Software and Technology, pp. 139–146 (1999)
Smelik, R.M., Tutenel, T., Bidarra, R., Benes, B.: A survey on procedural modelling for virtual worlds. Comput. Graph. Forum 33(6), 31–50 (2014)
Author information
Authors and Affiliations
Corresponding author
Editor information
Editors and Affiliations
Rights and permissions
Copyright information
© 2018 Springer International Publishing AG, part of Springer Nature
About this paper

Cite this paper
Gao, G., Chen, Y., Tang, H. (2018). How Users Distinguish Trees Within a Virtual Environment. In: Stephanidis, C. (eds) HCI International 2018 – Posters' Extended Abstracts. HCI 2018. Communications in Computer and Information Science, vol 851. Springer, Cham. https://doi.org/10.1007/978-3-319-92279-9_33
Download citation
DOI: https://doi.org/10.1007/978-3-319-92279-9_33
Published:
Publisher Name: Springer, Cham
Print ISBN: 978-3-319-92278-2
Online ISBN: 978-3-319-92279-9
eBook Packages: Computer ScienceComputer Science (R0)