
Abstract
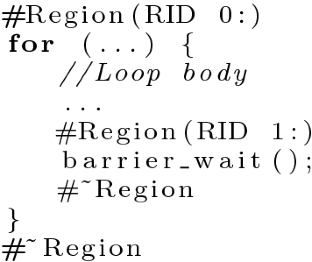
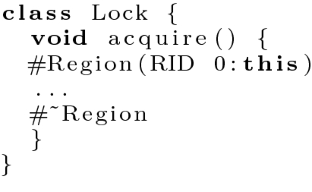
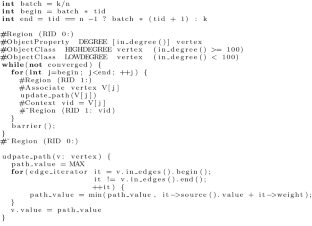
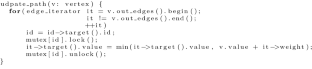
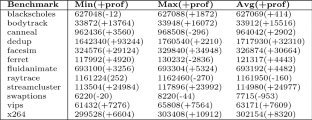
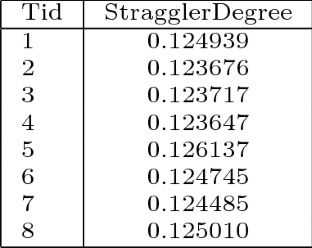
Studying the relative behavior of an application’s threads is critical to identifying performance bottlenecks and understanding their root causes. We present context-sensitive parallel (CSP) execution profiles, that capture the relative behavior of threads in terms of the user selected code regions they execute. CSPs can be analyzed to compute execution times spent by the application in interesting behavior states. To capture execution context, code regions of interest can be given static and dynamic names using a versatile set of annotations. The CSP divides the execution time of a multithreaded application into a sequence of time intervals called frames, during which no thread transitions between code regions. By appropriate selection and naming of code regions, the user can obtain a CSP that captures all occurrences of desired behavior states. We provide the user with a powerful query language to facilitate the analysis of CSPs. Our implementation for collection of CSPs of C++ programs has low overhead and high accuracy. Collection of CSPs of full executions of 12 Parsec programs incurred overhead of at most 7% in execution time. The accuracy of CSPs was validated in the context of common performance problems such as load imbalance in pipeline stages and the presence of straggler threads.


References
Adhianto L, Banerjee S, Fagan M, Krentel M, Marin G, Mellor-Crummey J, Tallent NR (2010) HPCTOOLKIT: tools for performance analysis of optimized parallel programs. Concurr Comput Pract Exp 22(6):685–701
Anderson TE, Lazowska ED (1990) Quartz: a tool for tuning parallel program performance. In: Proceedings of the ACM SIGMETRICS conference on measurement and modeling of computer systems, pp 115–125
Benavides Z, Vora K, Gupta R, Zhang X (2017) annotation guided collection of context-sensitive parallel execution profiles. In: International conference on runtime verification, LNCS 10548. Springer, Berlin, pp 103–120
Böhme D, Wolf F, de Supinski BR, Schulz M, Geimer M (2012) Scalable critical-path based performance analysis. In: IEEE International symposium on parallel and distributed processing symposium, pp 1330–1340
Curtsinger C, Berger ED (2015) Coz: finding code that counts with causal profiling. In: Proceedings of the symposium on operating systems principles, pp 184–197
David F, Thomas G, Lawall J, Muller G (2014) Continuously measuring critical section pressure with the free-lunch profiler. In: Proceedings of the ACM SIGPLAN international conference on object oriented programming systems languages applications, pp 291–307
Ding R, Zhou H, Lou JG, Zhang H, Lin Q, Fu Q, Zhang D, Xie T (2015) Log2: a cost-aware logging mechanism for performance diagnosis. In: USENIX Annual technical conference, pp 139–150
Du Bois K, Sartor JB, Eyerman S, Eeckhout L (2013) Bottle graphs: visualizing scalability bottlenecks in multi-threaded applications. In: Proceedings of the ACM SIGPLAN international conference on object oriented programming systems languages applications, pp 355–372
Geimer M, Wolf F, Wylie BJ, Ábrahám E, Becker D, Mohr B (2010) The scalasca performance toolset architecture. Concurr Comput Pract Exp 22(6):702–719
Graham SL, Kessler PB, Mckusick MK (1982) Gprof: a call graph execution profiler. In: Proceedings of the 1982 SIGPLAN symposium on compiler construction, pp 120–126
Hollingsworth JK (1996) An online computation of critical path profiling. In: Proceedings of the SIGMETRICS symposium on parallel and distributed tools, pp 11–20
Hollingsworth JK, Miller BP (1992) Parallel program performance metrics: a comparison and validation. In: Proceedings of the ACM/IEEE conference on supercomputing, pp 4–13
Hollingsworth JK, Miller BP (1992) Slack: a new performance metric for parallel programs. In: Computer sciences technical report
Intel Corp (2015) Intel 64 and IA-32 architectures software developer’s manual, volume 2: instruction set reference, a-z. http://www.intel.com/content/dam/www/public/us/en/documents/manua-ls/64-ia-32-architectures-software-developer-instruction-set-reference-manual-325383.pdf. Accessed 22 July 2016
Jeon D, Garcia S, Louie C, Taylor MB (2011) Kismet: parallel speedup estimates for serial programs. In: Proceedings of the ACM international conference on object oriented programming systems languages and applications, pp 519–536
Kambadur M, Tang K, Kim MA (2014) Parashares: finding the important basic blocks in multithreaded programs. In: European conference on parallel processing. Springer, Berlin, pp. 75–86
Leskovec J, Krevl A (2015) SNAP datasets: Stanford large network dataset collection. http://snap.stanford.edu/
Miller BP, Clark M, Hollingsworth J, Kierstead S, Lim SS, Torzewski T (1990) IPS-2: the second generation of a parallel program measurement system. IEEE Trans Parallel Distrib Syst 1(2):206–217
Nesheiwat J, Szymanski BK (1998) Instrumentation database for performance analysis of parallel scientific applications. In: International workshop on languages, compilers, and run-time systems for scalable computers. Springer, Berlin, pp 229–242
Nguyen D, Lenharth A, Pingali K (2013) A lightweight infrastructure for graph analytics. In: Proceedings of the twenty-fourth ACM symposium on operating systems principles, pp 456–471
Oyama Y, Taura K, Yonezawa A (2000) Online computation of critical paths for multithreaded languages. In: International parallel and distributed processing symposium, pp 301–313
Shende S, Malony AD, Cuny J, Beckman P, Karmesin S, Lindlan K (1998) Portable profiling and tracing for parallel, scientific applications using C++. In: Proceedings of the SIGMETRICS symposium on parallel and distributed tools, pp 134–145
Tallent NR, Mellor-Crummey JM, Porterfield A (2010) Analyzing lock contention in multithreaded applications. In: Proceedings of the 15th ACM SIGPLAN symposium on principles and practice of parallel programming, pp 269–280
Truong HL, Fahringer T (2003) SCALEA: a performance analysis tool for parallel programs. Concurr Comput Pract Exp 15(11–12):1001–1025
Vora K, Gupta R, Xu G (2017) Kickstarter: fast and accurate computations on streaming graphs via trimmed approximations. In: Proceedings of the twenty-second international conference on architectural support for programming languages and operating systems, pp 237–251
Vora K, Koduru S-C, Gupta R (2014) ASPIRE: exploiting asynchronous parallelism in iterative algorithms using a relaxed consistency based DSM. In: Proceedings of the ACM international conference on object oriented programming systems languages and applications, pp 861–878
Yang CQ, Miller BP (1988) Critical path analysis for the execution of parallel and distributed programs. In: Proceedings of the 8th international conference on distributed computing systems, pp 366–373
Yu X, Han S, Zhang D, Xie T (2014) Comprehending performance from real-world execution traces: a device-driver case. In: Proceedings of the 19th international conference on architectural support for programming languages and operating systems, pp 193–206
Yuan X, Wu C, Wang Z, Li J, Yew PC, Huang J, Feng X, Lan Y, Chen Y, Guan Y (2015) ReCBuLC: reproducing concurrency bugs using local clocks. In: Proceedings of the 37th international conference on software engineering-volume 1, pp 824–834
Author information
Authors and Affiliations
Corresponding author
Additional information
Publisher's Note
Springer Nature remains neutral with regard to jurisdictional claims in published maps and institutional affiliations.
This work is an extended version of [3]. It expands that work with the inclusion of data-centric facilities and additional experimental evaluation. Please see http://www.cs.ucr.edu/~gupta/fmsd-artifacts.zip for artifacts related to this submission.
This work is supported by NSF Grants CNS-1617424 and CCF-1524852 to UCR.
Rights and permissions
About this article

Cite this article
Benavides, Z., Vora, K., Gupta, R. et al. Annotation guided collection of context-sensitive parallel execution profiles. Form Methods Syst Des 54, 388–415 (2019). https://doi.org/10.1007/s10703-019-00341-0
Published:
Issue Date:
DOI: https://doi.org/10.1007/s10703-019-00341-0