Abstract
The educational quality of research master’s degree can be in part reflected by the examiner score of the thesis. This study focuses on finding positive predictors of this score with the aim of developing assessment and prediction methods for the educational quality of postgraduates. This study is based on regression analysis of the characteristics extracted from publications and references involving 1038 research master’s theses written at three universities in China. The analysis indicates that for a thesis, the number and the integrated impact factor of its references in Science Citation Index Expanded (SCIE) journals are significantly positive predictors of having publications in such journals. Additionally, the number and the integrated impact factor of a thesis’ representative publications, defined as the publications authored by the master’s student as a first author or second author with tutors in lead position, in SCIE journals, are significantly positive predictors of its examiner score. Based on these predictors, a range of indicators is provided to assess thesis quality, to measure the contributions of disciplines to postgraduate education, to predict postgraduates’ research outcomes, and to provide benchmarks regarding the quality and quantity of their reading work.


Notes
Impact factor (IF) of a journal at a given year is the average number of citations received at that year for its publications at two preceding years (Garfield 1994, 2006). See https://clarivate.com/webofsciencegroup/essays/impact-factor/.
Science Citation Index Expanded indexes over 9200 major journals across 178 scientific disciplines. In this study, these journals are called SCIE journals for short. See https://clarivate.com/webofsciencegroup/solutions/webofscience-scie/.
References
Abt, H. A. (2000). Do important papers produce high citation counts? Scientometrics, 48(1), 65–70.
Aittola, H. (2008). Doctoral education and doctoral theses-changing assessment practices. In J. Välimaa & O. H. Ylijoki (Eds.), Cultural Perspectives on Higher Education (pp. 161–177). Dordrecht: Springer.
Anderson, C., Day, K., & McLaughlin, P. (2006). Mastering the dissertation: lecturers’ representations of the purposes and processes of master’s level dissertation supervision. Studies in Higher Education, 31(2), 149–168.
Bornmann, L., & Mutz, R. (2011). Further steps towards an ideal method of measuring citation performance: The avoidance of citation (ratio) averages in field-normalization. Journal of Informetrics, 1(5), 228–230.
Bourke, S. (2007). Ph.D. thesis quality: the views of examiners. South African Journal of Higher Education, 21(8), 1042–1053.
Bourke, S., & Holbrook, A. P. (2013). Examining PhD and research masters theses. Assessment & Evaluation in Higher Education, 38(4), 407–416.
Bouyssou, D., & Marchant, T. (2011). Bibliometric rankings of journals based on impact factors: An axiomatic approach. Journal of Informetrics, 5(1), 75–86.
Bouyssou, D., & Marchant, T. (2011). Ranking scientists and departments in a consistent manner. Journal of the American Society for Information Science and Technology, 62(9), 1761–1769.
Braun, T., & Glänzel, W. (1990). United Germany: The new scientific superpower? Scientometrics, 19, 513–521.
De Bruin, R. E., Kint, A., Luwel, M., & Moed, H. F. (1993). A study of research evaluation and planning: The university of Ghent. Research Evaluation, 3(1), 25–41.
Böhning, D. (1992). Multinomial logistic regression algorithm. Annals of the Institute of Statistical Mathematics, 44(1), 197–200.
Eng, J. (2003). Sample size estimation: How many individuals should be studied? Radiology, 227(2), 309–313.
Fernández-Cano, A., & Bueno, A. (1999). Synthesizing scientometric patterns in Spanish educational research. Scientometrics, 46(2), 349–367.
Freedman, D. A. (2009). Statistical models: Theory and practice. Cambridge: Cambridge University Press.
Garfield, E. (1970). Citation indexing for studying science. Nature, 227(5259), 669–671.
Garfield, E. (1994). The impact factor. Current Contents, 25(20), 3–7.
Garfield, E. (2006). The history and meaning of the journal impact factor. JAMA, 295(1), 90–93.
Hagen, N. (2010). Deconstructing doctoral dissertations: How many papers does it take to make a PhD? Scientometrics, 85(2), 567–579.
Hansford, B. C., & Maxwell, T. W. (1993). A masters degree program: Structural components and examiners’ comments. Higher Education Research and Development, 12(2), 171–187.
Hemlin, S. (1993). Scientific quality in the eyes of the scientist: a questionnaire study. Scientometrics, 27(1), 3–18.
Holbrook, A., Bourke, S., Fairbairn, H., & Lovat, T. (2014). The focus and substance of formative comment provided by PhD examiners. Studies in Higher Education, 39(6), 983–1000.
Holbrook, A., Bourke, S., Lovat, T., & Dally, K. (2004). Investigating PhD thesis examination reports. International Journal of Educational Research, 41, 98–120.
Holbrook, A., Bourke, S., Lovat, T., & Fairbairn, H. (2008). Consistency and inconsistency in PhD thesis examination. Australian Journal of Education, 52(1), 36–48.
Kamler, B. (2008). Rethinking doctoral publication practices: Writing from and beyond the thesis. Studies in Higher Education, 33(3), 283–294.
Kyvik, S., & Thune, T. (2015). Assessing the quality of PhD dissertations: a survey of external committee members. Assessment & Evaluation in Higher Education, 40(5), 768–782.
Lariviére, V. (2012). On the shoulders of students? The contribution of PhD students to the advancement of knowledge. Scientometrics, 90(2), 463–481.
Leydesdorff, L., & Bornmann, L. (2011). Integrated impact indicators compared with impact factors: An alternative research design with policy implications. Journal of the American Society for Information Science and Technology, 62(11), 2133–2146.
Lisee, C., Lariviere, V., & Archambault, E. (2008). Conference proceedings as a source of scientific information: A bibliometric analysis. Journal of the American Society for Information Science and Technology, 59(11), 1776–1784.
MacRoberts, M. H., & MacRoberts, B. R. (1989). Problems of citation analysis: A critical review. Journal of the American Society for Information Science, 40(5), 342–349.
MacRoberts, M. H., & MacRoberts, B. R. (2018). The mismeasure of science: Citation analysis. Journal of the American Society for Information Science, 69(3), 474–482.
Mason, S., Merga, M. K., & Morris, J. E. (2019). Choosing the thesis by publication approach: Motivations and influencers for doctoral candidates. The Australian Educational Researcher,. https://doi.org/10.1007/s13384-019-00367-7.
Mason, S., Merga, M. K., & Morris, J. E. (2020). Typical scope of time commitment and research outputs of thesis by publication in Australia. Higher Education Research & Development, 39(2), 244–258.
Moed, H. F., De Bruin, R. E., & Van Leeuwen, T. N. (1995). New bibliometric tools for the assessment of national research performance: Database description, overview of indicators and first applications. Scientometrics, 33(3), 381–422.
Mullins, G., & Kiley, M. (2002). It’s a PhD, not a Nobel Prize: How experienced examiners assess research theses. Studies in Higher Education, 27(4), 369–386.
Nelder, J. A., & Wedderburn, R. W. (1972). Generalized linear models. Journal of the Royal Statistical Society: Series A (General), 135(3), 370–384.
Pilcher, N. (2011). The UK postgraduate masters dissertation: An elusive chameleon? Teaching in Higher Education, 16(1), 29–40.
Prieto, E., Holbrook, A., & Bourke, S. (2016). An analysis of PhD examiners’ reports in engineering. European Journal of Engineering Education, 41(2), 192–203.
Stracke, E., & Kumar, V. (2010). Feedback and self-regulated learning: insights from supervisors’ and PhD examiners’ reports. Reflective Practice, 11(1), 19–32.
Tinkler, P., & Jackson, C. (2000). Examining the doctorate: institutional policy and the PhD examination process in Britain. Studies in Higher Education, 25, 167–180.
Tinkler, P., & Jackson, C. (2004). The doctoral examination process: A handbook for students, examiners and supervisors. Maidenhead: Open University Press.
Waltman, L., van Eck, N. J., van Leeuwen, T. N., Visser, M. S., & van Raan, A. F. (2011). Towards a new crown indicator: An empirical analysis. Scientometrics, 87, 467–481.
Winter, R., Griffiths, M., & Green, K. (2000). The academic qualities of practice: What are the criteria for a practice-based PhD? Studies in Higher Education, 25(1), 25–37.
Xie, Z. (2020). Predicting the number of coauthors for researchers: A learning model. Journal of Informetrics, 14(2), 101036.
Xie, Z., & Xie, Z. (2019). Modelling the dropout patterns of MOOC learners. Tsinghua Science and Technology, 25(3), 313–324.
Zong, Q. J., Shen, H. Z., Yuan, Q. J., Hu, X. W., Hou, Z. P., & Deng, S. G. (2013). Doctoral dissertations of Library and Information Science in China: A co-word analysis. Scientometrics, 94(2), 781–799.
Acknowledgements
The authors are grateful to Professor Shannon Mason in the Nagasaki University and anonymous reviewers for their helpful comments and feedback. LYW is supported by National Education Science Foundation of China (Grant No. DIA180383). XZ is supported by National Natural Science Foundation of China (Grant No. 61773020).
Author information
Authors and Affiliations
Contributions
LYW motivated this study and provided empirical data. LZM preprocessed the data. XZ designed the methods to analyze the data, and wrote the manuscript. All authors discussed the research and approved the final version of the manuscript.
Corresponding author
Ethics declarations
Conflicts of interest
The authors declare that they have no conflicts of interest.
Appendices
Appendix A: Minimum sample size
Assume the size of group from which a sample is taken to be infinite. Let the confidence level be \(1-\alpha\). Denote the corresponding z-score of \(\alpha\) by \(z_{ {\alpha }/{2}}\), the expected proportion by p, the population standard deviation by \(\sigma\), and the margin of error by E. If the expected proportion and population standard deviation are not known, the sample proportion and sample standard deviation can be used (Eng 2003).
The formula of the minimum sample size required for estimating the population proportion is
Let \(\alpha =5\%\), \(p=\) sample population proportion, and \(E=0.15\). For regression analysis on having representative publications, \(n=42,33,29, 38\) for Biological, Engineering, Information, and Physical sciences respectively.
The corresponding formula for estimating the population mean is
Let \(\alpha =5\%\), \(\sigma =\) sample standard deviation, and \(E= 1.5\%\). For the regression analysis on examiner score, \(n=52, 53, 51, 43\) for Biological, Engineering, Information, and Physical sciences respectively.
Appendix B: More results of regression
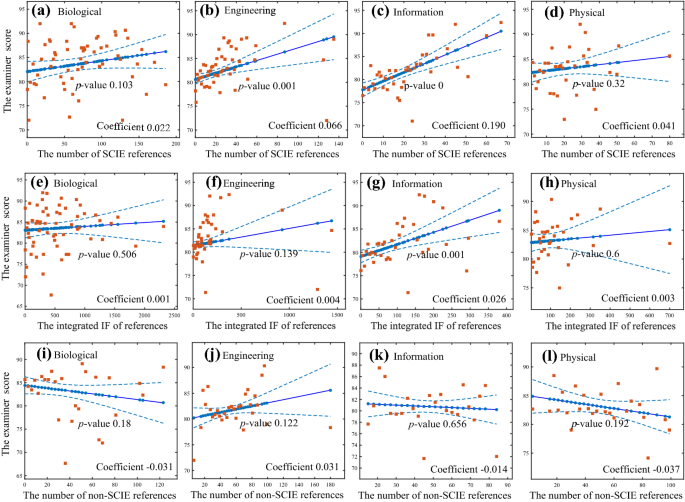
Figure 10 shows linear regression results between the examiner score and the indexes derived from the references of theses. The number and the integrated impact factor of SCIE references are significantly positive predictors of the examiner score in information sciences, and the number is significantly positive in engineering. There are no significant relationship in the other cases.
The relationship between the examiner score and the indexes derived from references. The panels show the mean examiner score of theses with the same index value (red squares), the predicted score (solid dot lines), and confidence intervals (dashed lines). The p value is that of \(\chi ^2\)-test. (Color figure online)
Figure 11 shows that for each disciplinary group, the number of representative publications of a thesis follows a Gamma distribution. Therefore, Gamma regression can be utilized to analyse the relationship between the number of representative publications and the indexes derived from references. Gamma regression is a generalized linear model that assumes that the response variable follows a Gamma distribution. The negative reciprocal of the expected value of the Gamma distribution is fitted by a linear combination of predictors (Nelder and Wedderburn 1972).
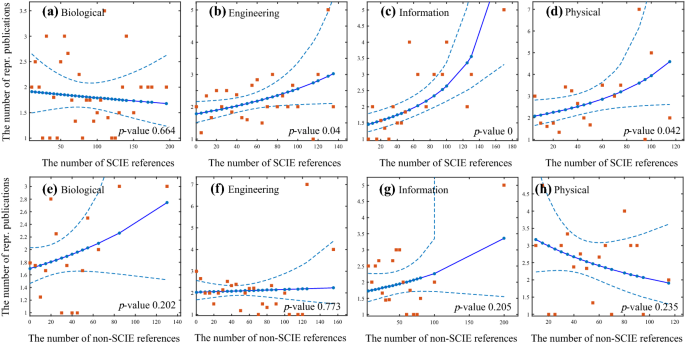
Figure 12 shows Gamma regression results. Except for biological sciences, the number of SCIE references is a significantly positive predictor of the number of representative publications. And there is no significant relationship between the number of non-SCIE references and the number of representative publications. These results may be statistically meaningless due to the small sample size of theses having a given number of representative publications.
The distribution of the number of representative publications. The panels show the empirical distributions (red circles) and Gamma distributions (blue squares). The KS test cannot reject the hypothesis that the number of representative publications follows a Gamma distribution, p value \(>5\%\). (Color figure online)
The relationship between the number of representative publications and that of SCIE/non-SCIE references. The panels show the average number of representative publications of theses with the same index value (red squares), the predicted value (solid dot lines), and confidence intervals (dashed lines). The p value is that of \(\chi ^2\)-test. (Color figure online)
Rights and permissions
About this article
Cite this article
Xie, Z., Li, Y. & Li, Z. Assessing and predicting the quality of research master’s theses: an application of scientometrics. Scientometrics 124, 953–972 (2020). https://doi.org/10.1007/s11192-020-03489-3
Received:
Published:
Issue Date:
DOI: https://doi.org/10.1007/s11192-020-03489-3

