
Abstract
The quality of service (QoS)-aware service composition problem is a lively topic of debate because of the fuzziness in the quality data and the user-oriented specific QoS requirements. The aim of this paper is to develop a model to select the most suitable service composition in a way that maximizes solutions expressed as functions over fuzzy/crisp QoS attributes, while satisfying user’s QoS requirements. In this paper, based on fuzzy set theory (FST) and genetic algorithm (GA), a triangular fuzzy genetic algorithm (TGA) is proposed for solving the service composition problem. The following set of strategies are presented: a quality model including crisp and fuzzy properties represented by triangular fuzzy numbers, a feasible method of normalizing the QoS matrix, aggregating formulas of each control structure for eight properties, a practicable method of defuzzification, a global best strategy with a fitness function which calculates the QoS priority vector and is considered as an objective evaluation criterion for selecting an optimal solution that meets user’s preferences best. Empirical comparisons with two algorithms on different scales of composite service indicate that TGA is highly competitive in regards to search capability, especially when the problem size is large. The results may be helpful to designers in selecting the best services for building a service-oriented system.
1 Introduction
Service oriented architecture (SOA) is a favored paradigm constructed by building distributed applications by orchestrating loosely coupled web services [2], and meanwhile it is necessary to consider the fuzziness of the quality data and meet user’s specific preferences for different nonfunctional (QoS) properties when developing and assembling these applications. The similar functions of assembled services, that differ in QoS are increasing and QoS attributes are becoming a pivotal role in selecting services from a large set of functionally equivalent ones [15]. QoS-aware service composition, known as an NP-hard problem, remains one of the notable research challenges [12, 17]. An effective use of such service environments requires approaches supporting QoS-aware service composition, and heuristic approaches (e.g. GA) are more favorable in finding near-optimal solutions.
Due to the rapidly increasing pool of services providing the same or similar functionality, but differing in QoS, it is more challenging to select a service combination with optimal QoS performance, while satisfying user-oriented QoS requirements and considering the uncertainties in the collected data. The varying degrees of preference for different QoS properties signify the requested requirements. Computation of QoS attributes and their requested preferences is quintessential in ensuring a successful service composition. QoS criteria for SOA systems include reliability, availability, latency, etc. The QoS data is usually estimated from a large amount of data, and is hard to obtain in some particular enterprises due to certain restraints, such as economic and time constraints, so that the level of confidence of data lies in the interval [0, 1] and most of the traditional methods where the highest level of confidence of data is taken as 1 are insufficient to handle these problem. In a typical scenario, a service requester seeks the best composition solution among a pool of possible solutions.
In this paper, we use FST and GA to obtain a fuzzy specification of each quality attribute, as well as a TGA for solving QoS-driven web service composition problems, which incorporates the concepts of FST and the evolutional process of standard genetic-based algorithm. Firstly, we present a fuzzy multidimensional quality model that extends the ideas and concepts of conventional FST, and model the QoS values as fuzzy sets. With respect to these QoS attributes in a web service, a user-oriented QoS preference degree set is introduced to represent various QoS properties. Based on the QoS matrices, an efficient method of normalizing these matrices is introduced. Then, with regard to the each vague QoS value and differing workflow control structures, several QoS aggregation functions are proposed to compute its fuzzy QoS values for different control flow structures and a practicable defuzzification theory is presented. Accordingly, the requested QoS preference degree set and the normalized matrix are obtained to calculate the QoS attribute priority weight vector. Consequently, near-optimal global solutions are found through the evolutionary procedures of TGA. Finally, comparisons with fuzzy set method (FSM) and standard GA (SGA) demonstrate its superiority in discovering promising solutions.
The rest of this paper is organized as follows: Sect. 2 introduces related works, Sect. 3 describes a multi-dimensional quality model, a approach of normalizing the QoS matrix, an aggregated QoS computation approach, a defuzzification method, and the TGA algorithm in detail, Sect. 4 demonstrates the proposed approach through experimental comparisons of the FSM and SGA algorithm, Sect. 5 concludes the paper.
2 Related Work
According to ITU E.800 [8] and ISO/IEC 20000 [7], QoS include nonfunctional attributes such as reliability, availability, throughput, latency, cost etc. Berbner et al. [5] pointed out that mathematically QoS properties’ values should be real numbers together with precise interpretations. Nevertheless, the mandatory constraint is not usually suitable for describing QoS attributes in current applications, as QoS data is estimated from a large amount of historical data and is hard to obtain in some particular enterprises due to certain restraints, such as economic and time constraints, so that the confidence level of data lies in the interval [0, 1]. Many scholars are suggesting that the QoS properties should be expressed as uncertainty and vagueness to enhance the practical ability of representing more valuable data information [14].
Research in QoS-aware service selection using FST has produced promising approaches. Mikhailov and Tsvetinov [16] have proposed a fuzzy analytic hierarchy process, which uses fuzzy pairwise comparison judgements rather than exact numerical values of the comparison ratios and transforms the initial fuzzy prioritization problem into a non-linear program, to identify suitable service offers. Bacciu and Botta et al. [3] have proposed a general framework for handling SLA negotiation in which agreements rely on the fuzzy approach where required and offered quality levels are described by fuzzy sets. Wang et al. proposed [20] a decision model based on consumers’ vague perception of intuitionistic fuzzy sets for QoS-aware web services selection. The selection method is modeled as a fuzzy multi-criteria decision-making problem by considering the non-functional QoS properties that heavily rely on the perceptions of service providers and consumers. Bacciu and Buscemi et al. [4] provides a quality model based on trapezoidal fuzzy set and a matchmaking procedure based on a fuzzy-valued similarity measure of the fuzzy QoS parameters of the requester and the relative benefit value offered by a provider, to select the most suitable service among several functionally similar ones for a single task. However, most of these selection methods have concentrated on how to fit each service association to any individual task and hence such approaches ignore possible associations of other combined tasks and fail to reach an acceptable QoS for the composite services.
Previous works aim to overcome the single requester-provider problem. However, to reach an acceptable QoS for a composite service, the service composition structure must be taken into account, as it determines the topology of the decentralized execution of individual web service, which affects the overall quality of the executed composite services [18]. The computation of QoS values based on a QoS matrix is an appropriate solution. Web services are ranked by computing each row of the normalized fuzzy QoS matrix [23]. Anyway, it was only a local optimization algorithm, but not a global one. The local optimization technique could not take global QoS constraints into consideration. When the size of composite service is very large, the overhead of global planning becomes enormous. Hereby, the aforementioned techniques are not able to effectively solve the web service selection issue with global QoS constraints and had limitations to some extent.
To address such problems, heuristic algorithms provide the possibility to find the optimal service composition solution from a global perspective [9]. The QoS value of a service composition is the aggregated QoS of the individual services following the workflow patterns [10], with the assumption that each service describes its own QoS properties in the SLA. Most of the work on heuristic algorithm is similar, that is formulated as an optimization problem and can be solved by linear programming methods [21]. However, they claim that the user’s preference can be set by adding constraints into the linear programming. Yet they require that the constraint’s related criteria be within the linear aggregation function, which excludes some QoS criteria such as reliability, availability, etc. This kind of constraint is crisp. The linear programming approach requires the aggregation of the supporting criteria to be linear or able to be translated into linear, which also ignores the control structures of composite services. Obviously, there is a need for more work on selection approaches.
GA is often employed to solve these problems [22]. Several approaches in the literature [11] have used the theory of fuzzy sets for studying the problem of finding suitable compositions of services that meet certain user-defined QoS requirements. Moreover, many efficient heuristic algorithms have been introduced [13]. All these approaches compare the QoS offered by one provider with that of other competing providers, and use the language value to express uncertainties in some of the QoS attributes. However, these description methods could potentially cause the present useful data information to be lost. Some attributes such as reliability and latency may not be a deterministic value due to the network condition, while other attributes maintain constants. To enhance the ability to describe more valuable information, numerical values including the maximum and minimum can be described with an interval. Moreover, the generated solution aims to maximize the objective value by applying the simple additive weighting technique. It is difficult for the user to set the weights. In our approach, we propose a TGA based service selection framework, which uses the power of fuzzy ways to express QoS values and consider the user’s QoS preferences, to select the optimal solutions.
3 Method Development
In this paper, a fuzzy QoS service composition model is proposed. This work considers a set of crisp and fuzzy QoS attributes a feasible method of normalizing the QoS matrix, different aggregating formulas of each control structure for each QoS property, an approach of deffuzication, and a TGA where typically multiple conflicting criteria are evaluated through a weighed aggregated sum, in order to find the best optimization of service composition solutions.
3.1 Problem Statement
The service composition as a way to build a SOA application is dependent on the QoS of candidate services. The implementation of a composite service is demonstrated as a workflow, for instance expressed in BPEL, which is fundamentally specific in terms of tasks and various control structure patterns (e.g. sequence, flow, loop and choice). There are more complex structures, but they can be simplified to these basic structure patterns [13]. A workflow manages the communication of several tasks to provide a composite service that briefly depicts the function of the task and interactive relations among them. For instance, Fig. 1 reveals the workflow concretization of a representative travel plan (TP) service. The BikeReservation and CarReservation tasks are in a choice pattern labeled with α for one path showing the probability of choosing that path. Then, these two tasks integrated with MapSearch, and FlightReservation integrated with HotelReservation task are both in sequence. Then, the sequence task (FlightReservation and HotelReservation) is in flow (parallel) with AttractionSearch, to construct a loop pattern labelled with β counting the number of iterations.

The workflow of travel plan service
In the composition, a workflow shows the functional dependencies of the basic services, while the QoS attributes of each service are more likely to be independent as there are no input/output relationship. Moreover, once a workflow has been designed, it is quite likely that there are some available services discovered to accomplish one atomic task. A candidate service list lj includes all function equivalent web services with different QoS value and candidate services are assigned to one task j. A quality matrix Q = ([qij]m*n)k is a matrix in which the element denotes the value of different quality-property k for concrete web service, i, that is assigned to the task j, m is size of the largest service list, and n is the scale of workflow.
Regarding QoS attributes of a composite service, such as reliability, latency, etc., it is necessary to make multiple criteria decisions (MCD) among multiple conflicting QoS properties. According to MCD theory, there exist many representations for multiple criteria QoS property preferences, which stand for the priority of various QoS attributes and are associated with a linguistic term, possibly defined to facilitate human-based interpretation. Different preferences mean QoS priority for requesters. In particular, in conformity with their relative preference level, requester’s QoS preference is represented by a QoS preference degree set \(\vartheta = (\vartheta_{1} ,\vartheta_{2} , \ldots ,\vartheta_{k} )\) which corresponds to the requested QoS property preference level, respectively, where ϑh, \(h \in k\) represents requested preference priority, the smaller ϑh, the greater the requested preference degree. Then, we use the QoS preference vector \(\Theta _{h} = \vartheta_{h} /(\vartheta_{1} + \vartheta_{2} + \cdots + \vartheta_{k} )\) as a preference vector for the requested QoS preference degree, and the smaller the value of \(\Theta _{h}\), the greater the degree of requested preference.
Given a composite service based on the predefined workflow, the preference vector \(\Theta = (\Theta _{1} , \,\Theta _{2} , \ldots , \,\Theta _{k} )\), and QoS matrix Q, the problem is to find the best service combination which optimizes quality solutions subject to QoS requirements. In general, the approach becomes a popular method to solve multi-objective optimization problems. This paper uses TGA to effectively address the problem.
3.2 Common QoS Properties
With the proliferation of web services with nearly identical functionalities, QoS becomes a significant factor during service selection. We consider eight common QoS criteria: (1) response time, (2) availability, (3) throughput, (4) reliability, (5) reputation, (6) latency, (7) cost, and (8) success rate of the web service. The reason for choosing them is because they are the most common ones and lively discussed [6, 13, 19]. Besides, new criteria can be added to the existing model. Meanwhile, the QoS attributes are divided into two categories: positive-type and negative-type. Larger values of positive-type attributes (reliability, and throughput) would provide better service; while negative-type attributes (cost and latency) result in unsatisfactory service.
Generally speaking, the quality model can be divided into two groups: crisp set and fuzzy set. The fuzzy QoS value provided by customers is first calculated by the register center and then released into web service environment (e.g. reliability, availability, response time, and latency). These fuzzy dimensions have been a major concern for organizations and their values can be monitored through Middleware [6]. Crisp data can be classified into two types: (1) QoS attribute values (e.g. cost, and throughput), which are configured by the service providers, and (2) QoS attribute values (e.g. reputation, and success rate), which are computed when the web service is invoked. Without a loss of generality, detailed discussions on the collections of these values are beyond the scope of this paper.
-
(1)
Crisp valued Web Services In order to be more clear, we provide our definitions of the crisp dimensions: throughput, reputation, cost, and success rate. Throughput is the maximum number of concurrent requests that are successfully executed within a given time and is configured on the server in most circumstances. The computation of service reputation needs customer’s subjective scores and objectivity to judge the real credibility of QoS advertisement information (Bayesian Learning Theory). For a web service, cost represents the price associated with its execution. The success rate of a service is the rate that a request is correctly handled within the maximum expected time. To express these crisp QoS attributes, the service properties are described as crisp quality matrix Q = ([qij]m*n)k, where i is the concrete web service for the task j, k is the quality-property, m is size of the largest service list, and n as the size of workflow.
-
(2)
Triangular Fuzzy Valued Web Services We provide our definitions of the fuzzy dimensions: response time, availability, reliability, and latency. The response time corresponds to the time needed to process a query, and is the total of elapsing time and actual processing time. The availability is the probability that the service is accessible. The reliability refers to the probability that a service will perform for its users on demands in a period of time, and it is a function of failure rate. The latency is the round-trip time between sending a request and receiving the response. For fuzzy dimensions, the most important step of the technique is the extraction from various sources. The gained crisp data should be converted into TNFs. More specifically, crisp numbers in the collected data need to be converted into TFNs with a known spread φ suggested by decision maker design maintenance expert system analyst [21]. The value for a QoS attribute of the ith services in the form of TFN is with equal spread in both the directions (right and left to the middle) with corresponding spread φ = 15%. To specify fuzzy QoS attributes, the service properties are described as TFNs. Particularly, a crisp QoS value middQ of the provider offered is expressed as a triplet (leftQ, middQ, rightQ), that denotes the TFN with support in [leftQ, rightQ] and modal value middQ, where leftQ = middQ × 85% and rightQ = middQ × 115%. The crisp matrix Q with workflow size n and candidate service size m can be extended to fuzzy matrix, represented as \(\tilde{Q} = \left( {[\tilde{q}_{ij} ]_{m*n} } \right)_{k}\), where \(\tilde{q}_{ij}\) is the kth attribute of the ith service for the task j, \(\tilde{q}_{ij} = ((\tilde{q}_{ij} )_{l} ,(\tilde{q}_{ij} )_{m} ,(\tilde{q}_{ij} )_{r} ),\) where \((\tilde{q}_{ij} )_{m} = q_{ij}\), \((\tilde{q}_{ij} )_{l} = q_{ij} \times 85\%\), and \((\tilde{q}_{ij} )_{l} = q_{ij} \times 115\%\). Now, the fuzzy matrix is constructed in accordance with the crisp one to form a base for selection.
3.3 Optimization Model for the Selection of Services Using TGA
TGA is a genetic algorithm based Darwinian’s Theory of evolution. In this section, the TGA is elaborated on for the implementation of the proposed ensemble approach to solve the QoS-based composition problem.
-
(1)
Genome Encoding To search for a solution using TGA, the problem needs to be encoded with the appropriate genome. The control flow graph of a workflow is used to encode the problem. The coding is done by mapping a set of design parameters onto a set of chromosomes, which involves the creation and encoding of chromosomes to express the solution options. The workflow can be divided into some smaller tasks including the start and end of the task. If every task is associated with a service, the execution path of a composite service can be generated by a series of services. During run-time, some concrete services with similar functions, but different qualities will be uncovered for each task. Thus, there are different composite ways to correspond to the given workflow. A coding scheme is introduced using matrices, to represent all possible solutions and paths of the executed workflow. Figure 2 provides a better explanation of creating the genome. In our problem, as depicted in Fig. 2a, the genome is expressed as an array, in which the number of elements is determined by the scale of the specific workflow, the length of each candidate service list, and the number of QoS attributes.
Fig. 2 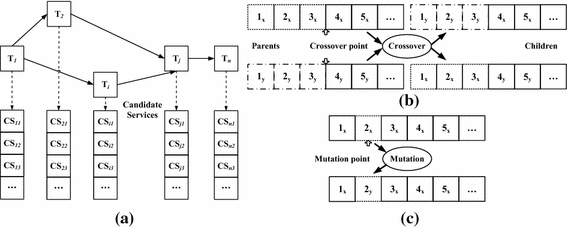
Evolutionary comparison among TGA, FSM and SGA
-
(2)
Normalization Regarding the different matrices for different QoS attributes, it is necessary to normalize various QoS matrices. Each QoS metric have its value specified by its corresponding computing unit. For instance, latency is measured with time, while cost is measured with currencies. The units of cost may be different currencies such as dollar, euro, etc. Moreover, availability is a single fuzzy value without a fixed computing unit. Direct numerical calculations can not be made among un-normalized matrices because the properties analyzed in this paper are different in range and quantity. Different matrices for different QoS features are incommensurable with each other. Matrix normalization has the function to enable direct numerical calculations among different QoS attributes, so that their orders of magnitude stay within the interval [0, 1].

To quantitatively perform the calculation on the QoS attributes, all elements in the matrix should be normalized. The matrix D = ([dij]m*n)k is used to define the further normalized matrix in the following discussion, where i is the concrete service for each task j, k is the quality-property, m is size of the service list and n as the size of workflow. In D, \(d_{ij} = \tilde{q}_{ij} /\left\| {\tilde{q}} \right\|_{j}\), where \(\left\| {\tilde{q}} \right\|_{j}\) is the Euclidean distance of the jth column vector of the matrix \(\tilde{Q}\) and \(\left\| {\tilde{q}} \right\|_{j} = \sqrt {\left( {\sum\nolimits_{i = 1}^{n} {\tilde{q}_{ij} } } \right)^{2} }\). The arithmetic rules of the fuzzy numbers can be inferred from the crisp formula:
The inequality \(0 \le (d_{ij} )_{l} \le 1 \wedge 0 \le (d_{ij} )_{r} \le 1\) is transversal to all i and j in the normalized matrix D = ([dij]m*n)k, where dij = ((dij)l, (dij)m, (dij)r).
-
(3)
Computing the Aggregated QoS of a Services Composition Before describing the GA used to find solutions for the optimization problem, we need to describe how to compute the QoS of a composite service, starting from the QoS attribute values of the component services. We provide various QoS aggregation functions to compute its crisp and fuzzy QoS values for a given service composition. The rules are actually reduction methods that work by recursively applying a reduction rule to shrink the workflow. On every recursive step when applying a reduction method, the QoS attributes of the tasks concerned will be calculated, and the workflow structure immediately changes. It continues until exactly one single task still exists. At this point, the obtained task contains the equivalent QoS values of the workflow.
For crisp QoS properties, the method for calculating the aggregated QoS attribute of a service combination is based upon the promising model introduced by Refs. [13, 19], where various qualities are aggregated through different mathematical functions.
For fuzzy QoS attributes, the rules for computing the aggregated QoS of a given service composition are extended from what was proposed by Canfora [13, 19], with triangle fuzzy QoS values. As soon as the TFN of each QoS value corresponding to each service is obtained, the equivalent quality value of one service composition will be added, thus employing the developed principles of fuzzy arithmetic operations on TFN. Given a composite service described with the concept of workflow within which each task is restricted to be executed by exactly one of its relevant candidate web services, the equivalent fuzzy QoS value can be calculated through the rules depicted in Table 1, which describes a serial of aggregating formulas for each pair of control structure and fuzzy quality. For a given composition, following the expressions in Table 1, the aggregated attribute matrix \(\hat{D} = \left( {\left[ {\hat{d}_{ij} } \right]} \right)_{k}\) is obtained as a fuzzy matrix for attribute k, where \(\hat{d}_{ij} = \left( {\hat{d}_{ij}^{l} ,\hat{d}_{ij}^{m} ,\hat{d}_{ij}^{r} } \right)\) means the fuzzy QoS property value of all service i the service composition j.
In real situations, it is necessary to use crisp values in the calculations, and thus to defuzzify the data. Fuzzification is the conversion of a precise quantity to a fuzzy quantity, and defuzzification is vice versa, fuzzy to precise quantity conversion. Center of area (CoA), is one of the most commonly used methods for terminating the center of the gravity of fuzzy sets and is widely utilized in actual applications. The CoA defuzzification \(\bar{d}\) for the fuzzy value of each QoS property x (response time, reliability, availability, and latency) can be given by:
In formula (2), \(u_{{\tilde{A}}} \left( x \right)\) is a membership function of \(\tilde{A}\). The defuzzified QoS attribute matrix \(\bar{D} = \left( {\left[ {\bar{d}_{ij} } \right]} \right)_{k}\) is computed for QoS attribute k, where \(\bar{d}_{ij}\) is the defuzzified value of \(\hat{d}_{ij} = \left( {\hat{d}_{ij}^{l} ,\hat{d}_{ij}^{m} ,\hat{d}_{ij}^{r} } \right)\) for all service i in the service composition j. Furthermore, this matrix \(\bar{D}\) can be used to determine the QoS priority and the fitness of each service composition. The larger the value of \(\bar{d}_{ij}\) is, the higher the service level is.
-
(4)
Evolutionary Procedures The procedures of TGA as an optimization tool are implemented by a set of operations. Each candidate solution has been encoded as an individual that contains a set of chromosomes. A chromosome is comprised of genes, and a series of genes represents one possible solution to the problem. Once coded, TGA starts with a generated initial population and is composed of three operations: reproduction, crossover, and mutation. This paper employs the single-point way to perform the crossover operator, which exchanges the segments of selected genome across a crossover point with a probability. Figure 2b shows, two children are produced by combining the parents genetics x and y, where x and y means two different points in two different segments. The mutation operator targets at toggle each position in a genome with a probability that may not be present in the initial population. For example, as shown in Fig. 2c, the mutation operator is applied on index 2x and its contents are replaced by value 2y.
Hitherto, the following describes the procedures of a TGA. Given a property space Q and QoS preference degree set ϑ, firstly the requested QoS preference set will be transformed into the preference vector. Then, the original fuzzy matrix for each QoS attribute is normalized. In the next step, all genomes of the population are generated through function P(index) with age incremented by 1. Then, the fitnesses of all individuals in population P(0) are calculated. The following steps would be executed in a set of iterations until it reaches a termination condition. The selection mechanism is a rank-based selection, where the fittest individual survives. The reproduction function is executed to determine the selected individual parents for producing two children on account of the crossover rate. The returned individuals from the evaluation function are copied directly into the new generation. Besides, the mutation operator utilizes the mutation rate to restore lost or unexplored segments into the population to avoid premature convergence to local optima. During the generation of new genomes, if certain constraints are violated according to the fitness function, they will be penalized and all evaluated individuals are moved to the next generation. The evaluated population returns the parameters (e.g. Fitnesses of all genomes, Maxfit), and the best fitness pbest of this generation is set to current Maxfit. By comparing the current pbest with the pbest of the older generations, the best fitness gbest is updated. Then, every genome whose max number of generations is exceeded will be removed and the rest of individuals are then used in the next iteration. Finally, it repeats until the termination criterion is satisfied and outputs the optimal solutions.
-
(5)
Adaptive Fitness Function Here, we present a similarity measure-based fitness function of TGA. According to theorem of GA, TGA employs the concept of a fitness function based on the pareto dominance, to search for the pareto-optimal set of the multi-objective optimization problem. The fitness function is utilized to select pareto-optimal sets of the services and eliminate inferior services by comparing the QoS of the services. It requires maximizing certain QoS attributes (e.g. reliability, and availability), while minimizing the other qualities (e.g. cost and latency). In this paper, we extend the fitness function with a fuzzy-valued similarity measure. Motivation for the solution come from the idea of fuzzy matchmaking between requested QoS demands and the QoS values of a service composition computed from the aggregation QoS functions.
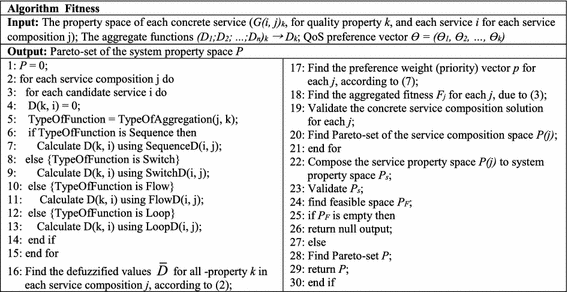

The fitness function is computed from the sum of each priority-weighted QoS attribute, in order to rank the service composition solutions and return an optimal solution. Algorithm fitness for each individual is gained from an inner control pattern of the workflow in consideration of five QoS properties. Genome G(i, j)k encoded from \(D = ( {[ {d_{{ij}} } ]_{{m*n}} } )_{k}\), web service i in each service composition j, and QoS property k are given. This algorithm recursively calculates the aggregated QoS of a given service composition from its inner control structures to the outer control structures. Then, according to the current control structure type and type of aggregation, one mathematical formula is applied to compute its aggregated QoS value in the light of Table 1. Based on the aggregated QoS values for each service composition solution, the defuzzified matrix \(\bar{D}\) for each QoS attribute is obtained using expression (2). Finally, this defuzzified QoS matrix is used to calculate the fitnesses of all service compositions and is returned to calculate further feasible solutions in space P as a final output.
A fitness function Fj for a given service composition j represents the relative value offered by the service provider with respect to the QoS preference. An Fj is computed from defuzzified QoS matrix \(\bar{D}\), and then weighted by the respective priority (pj)k which can be obtained from Eq. (7). To provide an Fj for the jth solution, we need to propose a suitable aggregation function that sums the defuzzified value \((\bar{d}_{ij} )_{k}\) for all the required service QoS dimensions k of all services i in each composition j. For the jth composition solution, we can generalize the aggregated fitness function Fj with the weighted sum on two quantities as:
The QoS preference degree has been calculated as preference vector θ = (θ1, θ2,…, θk), and the preference vector is given by \(\theta_{h}\), \(h \in k\) which stands for the requested subjective priority value. As the QoS property matrix \(\bar{D} = ([\bar{d}_{ij} ])_{k}\) has been obtained due to (1), the component \(\bar{d}_{ij}\) is the requested objective QoS value in the matrix \(\bar{D}\). Therefore, an optimization model \({\text{minZ(}}p_{j} )\) between requested subjective QoS preference value and objective QoS value is built to calculate QoS priority weight vector (pj)h denoted by:
Lagrangian function of Eq. (4) is formulated as follows:
The partial derivatives of Eq. (5) is solved and written as follows:
After solving partial differential Eq. (6), the result is exhibited as follows:
Thus, the requested QoS priority vector pj = ((pj)1, (pj)2,…(pj)k) for the jth composition can be obtained, which reflects the diversified demands on different QoS property.
Finally, the fitness value, Fj, of each concrete service compositions can be obtained, according to (3). Once Fj has been computed for each service composition solution j, Fj can be applied to measure and rank the degree of appropriateness of each composition solution and further to select the best-matching service composition. The fitness is used for determining an ordering of the solutions Fmin < … < Fj < … < Fmax where Fmax corresponds to the best matching service composition, with respect to user-oriented QoS preference.
-
(6)
Complexity Analysis TGA consists of two components: evolutional steps and the calculation of fitness. In the following, we find the computational complexity for each component. The evolutional steps include seven parts: calculating preference vector, normalization, initial population, selection, crossover, mutation, and comparison. Suppose that there are k QoS properties, Npop individuals in the population and an individual in TGA represented in an array of length |P|, which represents the quantity of tasks in a workflow. The preference vector is calculated with a complexity of O(k). Normalizing a QoS matrix needs the complexity of O(Npop∗|P|). The population is initialized according to the quantity of tasks and web services, to make the complexity of initialization be O(Npop∗|P|) times. The complexity of the selection procedure has complexity O(Npoplg(Npop)). The crossover operator has the complexity of O(|P|∗pcrossover∗Npop/2). The overall mutation operation has the complexity of O(pmutation∗Npop). Then, the comparison is a sorting procedure with complexity O(Npoplg(Npop)). The fitness of an individual is comprised of four procedures: calculating the aggregated quality, calculating the defuzzified value, calculating the priority value, and calculating the aggregated fitness. Calculating the quality has complexity O(|k|∗|P|). The three other procedures, including calculating the defuzzified value, calculating the priority value, and calculating the aggregated fitness, have a complexity constant of O(k). Measuring the fitness of an individual has the complexity O(|k|). The total number of fitness evaluations is Max∗Npop. Thus, the complexity of the second component is O(Max∗ Npop ∗ |P|) with constant |k|.
The complexity of TGA is the sum of evolutional operations and calculation of fitness, giving a complexity of O(Max∗Npop∗|P|) and O(Max∗(Npoplg(Npop))). Thus, if lg(Npop) > |P|, then the overall computational complexity of TGA is O(Max∗(Npoplg(Npop))); otherwise the complexity of our TGA is O(Max∗ Npop∗ |P|).
4 Experimental Evaluation
To further assess the performance of the proposed approach, we demonstrate the implementation of the QoS driven selection approach. First, we setup the experiments to evaluate the proposed approach, which is compared to different algorithms. Then, we estimate the overall solution quality and optimality of our approach.
4.1 Experiment Setup
We consider the TP service example presented in Fig. 1 and compare it to other algorithms. The proposed algorithm is compared with two algorithms, which are referred to as FSM and SGA. Both algorithms follow a practical approach to global optimization of solving the same QoS-aware composition problem.
The workflow designed for the TP service contains six basic tasks combined through four types of control structures. The label α and β are marked with two control structure loop and choice respectively (Fig. 1). Besides, we consider both positive-type properties including reliability, availability, throughput, reputation and success rate, and a negative-type properties including response time, latency, and cost. The requested QoS preference set is ϑ = (2, 5, 3, 5, 4, 2, 5, 3), following the requirement in Sect. 3.1.
All the experiments are performed on the same hardware and software; the evaluations are run on a server with a 1 GHz Intel CPU and Windows server 2008. All algorithms are implemented in C#. All algorithms are evaluated sequentially and given up to a maximum of 2 GB of memory. The same data is adopted, including different scales of workflows, different quantities of candidate services for each task, and 8 QoS types for each web service. The input data used by the algorithms are derived from two data sources: QWS, a dataset containing 2507 real services and about 9 QoS values [1], and RQD, a randomly generated experimental QoS dataset whose values are within the same range as various quality values of those in QWS. In the experimental application, services are assigned to tasks on the basis of their functionalities. Taking task FlightReservation for example, the experiments choose some services such as Schedule, FlightRouteAggregatorService, FlightHistoryService, and Flights from the QWS dataset. However, for the rest of the web services, we randomly generated a certain number of services with QoS values from the RQD dataset.
The assessment procedure is composed of two main parts. The first examines the ultimate solution quality of TGA, FSM, and SGA through the comparison of the solutions. The second attempts to estimate their optimality which is divided into two experimental groups. The former evaluates how the generations and population sizes affect the solution quality, for the purpose of finding the best solutions. The latter evaluates optimality of TGA versus FSM and SGA when they are properly setup with the appropriately parameters.
It is apparent that the final solution quality and optimality of any algorithm hinge on the experimental setup configuration and problem size. For the configuration of primary parameters in TGA, we follow the general rule of using a high crossover rate and a low mutation probability. As shown in Table 2, the results for a comparison of TGA, FSM, and SGA with various configurations of the crossover and mutation rates in best fitness are listed, in which the number of generations is 100, initial population is set as 100, and the number of candidate services is set with a middle size of 75 randomly without being negatively affected by extreme values. Based on the results, we opt to use crossover rate of 0.85 and mutation rate of 0.05, because this algorithm rendered the optimal solution with best fitness in our experiments. For the problem size, the scale of workflow and the quantity of services at hand mainly define its value which is configured differently for each experimental case.
4.2 Solution Quality
In order to examine the overall solution quality, a TP service with specific values α = 1 and β = 1/2 is simulated with the specific configurations of a certain quantity of tasks and candidate services. These configurations depend on the scale of workflow and candidate web services in a service list, and consider the quantity of services available in the input quality dataset. The algorithms are examined with the input data from the QWS and RQD dataset. The essential solution-quality experiment principally aims at determining the fitness of a composite service that can meet user’s QoS specific preference best.
All the algorithms are examined with the same group of QoS data input, whose max values of their fitness are reported and illustrated as a result of the experiments. When the α and β is set to 1 and 1/2, then the TP workflow includes 6 tasks as three basic tasks in the loop are repeated 1 times with three additional tasks. Figure 3a denotes the final results and describes online fitness evolutionary behaviour across generations when the quantity of candidate services is randomly specified with a representative middle size of 75. As depicted in the figure, the graph is marked with the corresponding name of an algorithm (TGA, FSM or SGA). At the earlier generations, the fitness of TGA is extremely lower and poorer than FSM, as the algorithm has not converged. As the generation grows, it shows that TGA outperforms FSM and SGA. The highest fitness scores of TGA surpass the scores of the other two algorithms over a number of generations, which demonstrate the powerful global exploration-ability of TGA for finding the optimal solutions satisfying user’s QoS specific preference best when the fixed quantity of 100 iterations is exceeded. Considering the population size, the algorithms are evaluated through generating 12 different population sizes. In this experiment, the number of generations is specified at 100 and the algorithm is also evaluated by generating different initial population sizes from 25 to 300, to investigate how the population size affects the eventual solution quality. As depicted in Fig. 3b, the population size has an obvious effect on the ultimate solution quality. If the population size is set to lower than 100, the algorithm generates an unpredictable solution quality. If the size is set no smaller than 100, the algorithm will approximately converge at the similar fitness, indicating that the proposed algorithm is highly efficient and optimal, i.e. making that the TGA’s fitness maintain stability at approximately 0.1766, the FSM’s fitness stays constant at an average of 0.1762 and the SGA’s fitness stays roughly at 0.1759, with regards to user oriented QoS preference. Meanwhile, the algorithms will be able to find an acceptable high-quality solution that meets user-oriented QoS preference best, when the adjusted population size is greater than 100.

Evolutionary comparison among TGA, FSM and SGA
Regarding the generations, if the generation is small, the overall solution quality might drop to be unacceptably small. Alternatively, the higher value of quality likely requires more generations and larger primary population, leading to a problem where the algorithm runs slowly. Considering the population size, when the population size is small, increasing the population size will have an undesirable effect on the ultimate solution quality, as the algorithm will not converge. However, in larger population sizes, this influence will be much less. As shown in Fig. 3b, when the population size is set to no less than 100, the algorithm produces an superior solution quality while the number of generations is set to 100. Hence, constantly increasing the population size obtains nothing and rather than consumes more time.
4.3 Solution Optimality
To further investigating the influence of the composite service size towards the overall performance of TGA compared to FSM and SGA, the fitness value and execution time are used to compare them based on two sets of standards: the workflow with different quantities of tasks and web services accomplishing each task.
In our first experiment, as depicted in Fig. 4, ten experimental cases are constructed with respect to different quantities of basic tasks in the TP service through various configurations of parameter value α. The scale of workflow ranges from 6 to 51, corresponding to an adequate increment of 3. In this experiment, the number of generations and candidate services are both fixed at 100 respectively, and the initially generated population size is set to [Tasks/3] × 25. As shown in Fig. 4a, the fitness values of three algorithms all decrease as the services in the loop repeats and their QoS values may be gradually away from the user’s preference. Besides, TGA obviously converges to a stabilized fitness value that is larger compared to FSM and SGA. The preliminary results show that TGA outperforms FSM and SGA with a variable quantity of tasks. Figure 4b demonstrates that through increasing the scale of workflow, the execution time of the TGA and SGA approaches increases slowly. The reason is primarily because the computational complexity of the two algorithms greatly hinge upon the size of the population, which is identical for both methods. The time of TGA is slightly longer than the time of SGA, as TGA handles fuzzy data, while SGA only deals with crisp data. In comparison to FSM, the time of TGA becomes significantly slower when the scale of the workflow increases.

Fitness value and running time illustration with quantity of tasks
In our second experiment, various cases are conducted to investigate how the three algorithms act with regard to different quantities of services per each individual task, as depicted in Fig. 5. The constants α, β, and the number of generations are set to 10, 1/2, and 100, respectively. Furthermore, we vary the quantities of services available per task between 50 and 1000. The reason why we have experimented with such a large quantity of services per task is because that we are able to differentiate among concrete services of identical tasks that are offered with different QoS values. The initially generated population size is set to [webservices/50] × 3. Figure 5a shows that there are a series of small fluctuations in the fitness results, as the quantity of services per task increases so do the choices available. The fitness increasing curve reveals that the superiority of TGA to FSM and SGA is much more apparent with available services rising. Then a conclusion could be drawn that the space exploitation ability of TGA is much better than FSM and SGA. Figure 5b indicates that the increasing quantity of services has only a slight influence on TGA and SGA whereas its actual impact on FSM is significantly higher, from the viewpoint of computation complexity. The execution time curve proves that TGA can run in less time than FSM. It is worth mentioning that when the ideal solution is obtained, the running times of TGA and SGA exhibit a much smaller value than these of FSM, and TGA is slightly slower than SGA because SGA only handles the crisp data, while TGA handles the additional left and right spreads of the modal data. However, if both the fitness and time are taken into consideration simultaneously, it demonstrates that TGA can solve the problem with better fitness and efficiency, according to user’s preference.

Fitness value and running time illustration with quantity of web services
The experiment results indicate that the proposed TGA remarkably surpasses FSM and SGA in regards to the quantity of tasks and services. With the growth quantity of tasks and services, the execution time sustains a lower growth rate and the fitness of TGA maintains a higher level, implying that the TGA can present the optimality, scalability, and stability to the solution. Conversely, this experiment shows that the quality of TGA does not improve significantly when the scale of workflow increases and also decreases noticeably. This is because by increasing scale of the workflow, it greatly enlarges the genome size. To be frank, the impressive strength of TGA considerably outweighs this disadvantage because the scale of workflow is usually constant and limited during runtime.
5 Conclusion
In this paper, the TGA is proposed based on FST and GA to contribute to the QoS service composition issue using the following effective strategies: a fuzzy quality model is proposed for specifying uncertain information of QoS properties, a feasible method of normalizing the QoS matrix is introduced, and different aggregating formulas of five properties for each control structure are given. Finally, TGA is proposed to solve this service selection problem. The fitness function is based on the QoS attribute priority weight vector calculated from the preference degree and the defuzzified QoS property, and is regarded as an objective evaluation criterion for finding the optimal composition solutions that satisfy user-oriented QoS preference best. We provide experimental comparisons with FSM and SGA illustrating its superior effectiveness in regards to the following qualities: powerful searching ability, convergence ability, and stable performance. This technology affords designers with the opportunity to build a large SOA system by selecting services quickly.
We argue that the proposed approach can be extended to other fields of interest and open the door for innovative research to keep on improving the scalability and performance of current solutions. As for future work, we will evaluate our approach with other more complex applications.
References
Al-Masri, E., & Mahmoud, Q. (2014). The qws dataset. http://www.uoguelph.ca/qmahmoud/qwsindex.html.
Alrifai, M., Skoutas D., & Risse, T. (2010). Selecting skyline services for qos-based web service composition, World Wide Web. ACM. 11–20.
Bacciu, D., Botta, A., & Stefanescu, C., (2007). A framework for semantic querying of distributed data-graphs via information granules, Intelligent Systems and Control. 161–166.
Bacciu, D., Buscemi, G., & Mkrtchyan, L. (2010). Adaptive fuzzy valued service selection, SAC. ACM. 22–26.
Berbner R., Spahn M. et al. (2006). Heuristics for qos-aware web service composition, ICWS. 72–82.
Hadad, J. E., Manouvrier, M., & Rukoz, M. (2010). Evaluation of services using a fuzzy analytic hierarchy process. IEEE Transactions on Services Computing, 3(1), 73–85.
ISO/IEC. 2011 (2011). Information technology-service management-part 1: Service management system requirements, international standard.
ITU, E. 800 (1994). Terms and definitions related to quality of service and network performance.
Jaeger, M. C., Mhl, G., & Golze, S. (2005). Qos-aware composition of web services: An evaluation of selection algorithms. On the Move to Meaningful Internet Systems: CoopIS, DOA, and ODBASE., 3760, 646–661.
Jaeger, M. C., Rojec-Goldmann, G., & Mhl, G. (2004). Qos aggregation for web service composition using workflow patterns, EDOC. 149–159.
Klein, A., Ishikawa, F., & Honiden, S. (2011). Efficient heuristic approach with improved time complexity for qos-aware service composition, ICWS. 436–443.
Klein, A., Ishikawa, F., & Honiden, S. (2014). A self-adaptive network aware approach to service composition. IEEE Transactions on Services Computing, 7, 452–464.
Li, J., Zheng, X., Chen, T., et al. (2014). An efficient and reliable approach for quality-of-service-aware service composition. Information Science, 269, 238–254.
Liu, Y., Ngu, H. A., & Zeng Z. (2004). Qos computation and policing in dynamic web service selection, World Wide Web. ACM. 66–73.
Mardukhi, F., Nematbakhsh, N., Zamanifar, K., et al. (2013). Qos decomposition for service composition using genetic algorithm. Applied Soft Computing, 13, 3409–3421.
Mikhailov, L., & Tsvetinov, P. (2004). Evaluation of services using a fuzzy analytic hierarchy process. Applied Soft Computing, 5(1), 23–33.
Mukhija, A., Dingwall, A., & Rosenblum S. (2007). Qos-aware service composition in dino, in ECOWS. 3–12.
Nanda, G., (2004). Decentralizing execution of composite web services, OOPSLA. 170–187.
Sheth, A., Cardoso, J., & Miller J., et al. (2002) Qos for service-oriented middleware, WMSCI. 528–534.
Wang, P. (2009). Qos-aware web services selection with intuitionistic fuzzy set under consumers vague perception. Expert Systems with Applications, 36, 4460–4466.
Xu, J. & Yao, S., (2014). Reliability of SOA systems using SPN and GA, SERVICES. 370–377.
Ye, Z., Zhou, X., & Bouguettaya, A. (2011). Genetic algorithm based qos-aware service compositions in cloud computing. ICDSAA, 6588, 321–334.
Zhou, W., Wen, J., Gao, M., et al. (2013). A qos preference-based algorithm for service composition in service-oriented network. Optik., 124, 4439–4444.
Acknowledgements
Special Fund of Major Information Platform Construction and Maintenance of the Ministry of Agriculture of China (2130104).
Author information
Authors and Affiliations
Corresponding author
Rights and permissions
About this article

Cite this article
Xu, J., Guo, L., Zhang, R. et al. QoS-aware Service Composition Using Fuzzy Set Theory and Genetic Algorithm. Wireless Pers Commun 102, 1009–1028 (2018). https://doi.org/10.1007/s11277-017-5129-8
Published:
Issue Date:
DOI: https://doi.org/10.1007/s11277-017-5129-8