
Abstract
This paper presents three multimodal learning analytic approaches from a hands-on learning activity. We use video, audio, gesture and bio-physiology data from a two-condition study (N = 20), to identify correlations between the multimodal data, experimental condition, and two learning outcomes: design quality and learning. The three approaches incorporate: 1) human-annotated coding of video data, 2) automated coding of gesture, audio and bio-physiological data and, 3) concatenated human-annotated and automatically annotated data. Within each analysis we employ the same machine learning and sequence mining techniques. Ultimately we find that each approach provides different affordances depending on the similarity metric and the dependent variable. For example, the analysis based on human-annotated data found strong correlations among multimodal behaviors, experimental condition, success and learning, when we relaxed constraints on temporal similarity. The second approach performed well when comparing students’ multimodal behaviors as a time series, but was less effective using the temporally relaxed similarity metric. The take-away is that there are several strategies for doing multimodal learning analytics, and that many of these approaches can provide a meaningful glimpse into a complex data set, glimpses that may be difficult to identify using traditional approaches.
Introduction
The twenty-first century has seen an expansion in the set of tools available for assessing the quality of a given learning environment (Baker and Yacef 2009; Blikstein and Worsley 2016; Martin and Sherin 2013). A number of the traditional tools: test and quiz performance, speeches and essays; are modes of expression that have been around for centuries and remain the more privileged forms of assessment. For all of their pedagogical shortcomings, these forms of assessment have the benefit of being widely accepted and easy to interpret. However, contemporary learning sciences research is increasingly concerned with additional constructs: motivation, engagement, collaboration, creativity, critical thinking, and problem solving, for example. These are constructs that tend to be much harder to quantify using traditional testing instruments and often necessitate adopting an alternative approach that more closely aligns with the design of constructivist-inspired learning environments (Piaget 1973; Schwartz et al. 2009). By virtue of the breadth of interactions students have with collaborators and various technological resources, traditional tools and metrics are probably not well suited for makingFootnote 1 or other constructionist-based learning environments. Instead, studying these environments likely requires the use of multimodal analysis. That said the analytic strategies used in this paper are not limited to the study of constructionist learning environments. On the contrary, the approaches could prove to be useful across a broad set of learning contexts, and with a variety of data sources.
In this article we leverage multimodal learning analytics (Blikstein and Worsley 2016; Worsley 2012; Worsley and Blikstein 2013) in order to better understand the complexities of student learning in a hands-on learning environment. In particular, we conducted a two-condition experimental study with 20 participants. The two experimental conditions were principle-based reasoning and example-based reasoning (Worsley and Blikstein 2017). Both principle-based reasoning and example-based reasoning represent instances of analogical reasoning (Gentner and Holyoak 1997; Gick and Holyoak 1980). Where they differ is in the level of abstraction of the analogy. In principle-based reasoning, the analogs are engineering principles. In example-based reasoning, the analogs are real-world structures. In prior work, we observed that principle-based reasoning was associated with higher learning gains and higher quality designs (Worsley and Blikstein 2014b). We collect multimodal data and combine it with machine learning to compare differences in multimodal behavior between the two experimental conditions and correlate those behaviors with success and learning.
In what follows we briefly describe prior literature in multimodal learning and multimodal analysis of learning. We then move on to describe the study from which our data is derived and the analytic techniques used to analyze this data. Finally, we present the results from our analyses and discuss the implications of these findings for future assessments of hands-on learning environments. We conclude with remarks about limitations and future research.
Multimodal Analysis in Education
Multimodal analysis in education is not a new concept. On the contrary, multimodal analysis has been the primary means of analysis for decades of researchers trained in audio/video analysis, ethnography, etc. (for examples see Barron et al. 2013). These researchers carefully analyze individual and group behaviors to interpret the inner workings of various learning environments. One exemplar in this line of work is Kress et al. (2001). Kress et al. examines multimodality among teachers and students in several science education classrooms. In each classroom video capture, hand-written, student-created artifacts, and field notes are used to study the intersection of the text modality with actions, facial expressions, diagrams and guided noticing (Pea et al. 2004). Among the findings reported is the inability of text to accurately represent models of student learning in complex learning environments.Footnote 2 Specifically, Kress et al. writes:
“From our data we can demonstrate that attention to one mode alone fails to capture the meaning of a communicative event; not just that it fails to capture all the meaning, but that it fails to capture the meaning.” (Kress et al. 2001, p. 14)
Kress et al. justifies this claim by presenting several analyses that are based on triangulating among speech, gestures and diagrams, and show how a given utterance only has meaning in the context of the other events and actions that took place during that time. In leveraging Kress et al. (2001) we would argue that if multimodal analysis is seen as a necessity for understanding student learning in a traditional science classroom, such a requirement becomes increasingly pronounced in a constructionist learning environment.
Accordingly, this article builds upon Kress et al. (2001), but also features several important differences. At a basic level, whereas Kress et al. used video data and student artifacts, we have the advantage of having a wide set of sensory tools that can capture user behavior at high frequency and high resolution. Also, a portion of our analysis is similar to Kress et al.’s identification of characteristic multimodal actions among the population of students analyzed. Their analysis identifies six different “conventionalized forms of action” which appear to have specific utility to the user. Our multimodal analyses will also look for common multimodal behaviors among the population of students that participated in our study. However, because we have more detailed behavioral and socio-emotional information about each participant, our common behaviors incorporate a larger set of modalities, including facial expressions and stress. Invoking analysis from behavior level data is another example of how this work deviates from that of Kress et al. (2001), which is largely dismissive of behavior-based studies. Given the tools available at that time behavioral analysis may have been empirically fruitless and intractable. However, one of the things that we show, and have shown in previous work (Worsley and Blikstein 2013), is that multimodal analysis has relevance for studying learning and performance. The ability to leverage behavioral data is, partially, a function of the computational tools and high resolution sensor data that allows researchers to construct user representations that are semi-semantic. A discussion of the techniques and sensors used will be briefly presented later in this article.
Moreover, when we examine the work of Scherr and Hammer, for example, we see a clear example of how multimodal representations of learners and groups of learners play an important part in interpreting how they are framing a given task. Specifically, Scherr and Hammer study Epistemological framing, which is concerned with the role that a student’s perception of the nature of knowledge and the task, has on how they approach the task. Scherr and Hammer (2009) discuss four epistemic frames that are typified by a combination of speech, gaze, posture and engagement (Table 1). While the analyses presented in this paper will not attempt to reproduce the same epistemological frames, Scherr and Hammer’s work highlights the potential for multimodal data to advance our understanding of human cognition and learning.
Process-Oriented Analysis of Learning
In addition to the importance of multimodal analysis, we also build upon the notion that student knowledge is infused in the processes that students complete. More specifically, we define process as the behaviors, actions and interactions that occur while a student or group of students are completing a given task. Fundamentally, distinguishing between achievement and process has been an essential part of education research for nearly a century (Werner 1937), and is the primary consideration of constructionist learning. For example, Turkle and Papert (1992) provides a prime instance where the researchers focus on studying learner processes, and not learner outcomes. Specifically, they write,
Using clinical methods inspired by the Piagetian and psychoanalytic traditions, we built up case studies of children using computers in grade-school settings where they were encouraged to explore programming without preconceptions about the “right way” to go about it. We took 40 cases for which we had material both on individual personality and programming style. What we say in this chapter about gender, programming, and intellectual style is based on the analysis of these cases. But we believe that what is most important is not any statistical association between gender and programming styles, but what lies behind the styles and behind the resistance of our intellectual culture to recognize and facilitate them both. (Turkle and Papert 1992).
The use of case studies centered on the belief that process was of primary import, and was more relevant than mere correlations between style and gender. Hence, our use of process is in line with the guiding principles and perspectives of constructionism (e.g. Harel and Papert 1991; Kafai 1995; Lawler and Yazdani 1987).
Beyond the specifics of the constructionist movement, focusing on process has been espoused by several other researchers (Atman and Bursic 1998; Atman et al. 2005; Bamberger and Schön 1983; Lehrer and Schauble 1998; Smith et al. 1994; Toulmin 1999). Among these papers, authors are concerned with analyzing student learning with the understanding that as the student is participating in the study, they are engaging in a learning process. For example, Toulmin (1999) advocates for “knowledge as shared procedures.” As such the analysis of student expertise should be situated in practices central to a domain, as opposed to solely being grounded in language or a final product. Similarly, Bamberger and Schön (1983) describe learning as a “reflective conversation with materials.” The idea of a conversation encapsulates the ways that individuals interact with their surroundings, both human and non-human, to interpret and make sense of what they observe. Hence it is not enough to simply look at a structure to determine its stability. Instead the individual must engage the structure in something that is akin to a dialogue, applying stimulus to the object and getting feedback from the object. In previous work (Worsley and Blikstein 2014b), we have qualitatively shown process-oriented differences between the two experimental conditions described in this article. Those two experimental conditions are principle-based reasoning and example-based reasoning. For the purpose of demonstrating the utility of multimodal analysis it is not essential to understand the specifics of principle-based reasoning or example-based reasoning. Nonetheless, we will briefly describe the experimental conditions in the paragraphs to following.
Example-based reasoning is a form of analogical problem solving, in which the participant’s design is modeled after a real-world object. For example, Worsley and Blikstein (2017) describe a student that bases his design on a specific chair in his room. The student then proceeds to make a design that closely resembles that chair.
Principle-based reasoning can also be characterized as a form of analogical problem solving. However, it differs from example-based reasoning, in that the participant bases their design on principles from engineering. Common principles used within the engineering design context are having a wide base, using triangles, and reinforcement. Instead of working towards a specific exemplar, the student attempts to piece their design together by iteratively and systematically applying engineering principles.
Having qualitatively observed marked differences between the two experimental groups, it is the intention of this article to utilize fine-grained quantitative measures to define more process-oriented differences.
Methods
Study Participants
The population of students included twelve high school students and eight undergraduate students. The distribution of high school students and undergraduate students was the same across the two conditions. Nine of the students were women, and 11 were men. One condition had four women while the other had five. Students were recruited to be participants through a series of university mailing lists and received $20 for their participation in the study.
Study Description
This study involved dyads of students working to complete an engineering design challenge. The challenge asked students to build a structure that could support a 0.5 lb. weight as high above a table as possible using basic household materials: one paper plate, four straws, five wooden sticks, and 5 ft. of garden wire (see Fig. 1). Because no pencil and paper was provided to students, students largely perceived this as a making/tinkering task, as opposed to a traditional engineering task for which they would have been expected to develop calculations as part of their design process. This blending of engineering design and tinkering often times characterizes K-16 “making” experiences where the overall objective is to create a finished and functioning artifact, similar to the work of an engineer, absent rigorous mathematical calculations to support their designs (Vossoughi and Bevan 2014). Furthermore, the task mirrors the forms of design challenges that are often utilized in Makerspace workshops.

Sample student workspace a building materials
The sequence of events completed for the activity included:
-
1.
Baseline Sensor Data Collection – before beginning the actual study, students complete baseline electro-dermal activation activities to determine their baseline in both stressful and non-stressful situations.
-
2.
Pre-test (Fig. 2) – students were asked to generate as many ways as possible to make an unstable structure more stable. The goal of the pre-test was primarily to account for any differences in prior experience, as well as serve as a reference point for assessing how each student’s conceptual intuitions changed as a result of the experiment.
Fig. 2 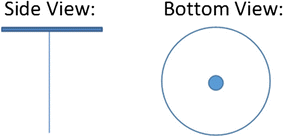
Diagram presented for pre- and post-test
-
3.
Intervention – students participated in either an example-based reasoning intervention or a principle-based reasoning intervention. During both interventions students were first shown a picture of a ladder (Fig. 3), a bridge (Fig. 4) and an igloo (Fig. 5). In the example-based condition students were asked to generate three ideas of relevant structures from their home, community or school that would be useful in thinking about completing the current task. In the principle-based condition students were asked to generate three mechanisms, or engineering principles, that cause one or more of the three items pictured (Fig. 3, Fig. 4, and Fig. 5) to be structurally sound. The intervention task was three minutes in duration for both conditions.
Fig. 3 
Ladder picture
Fig. 4 
Bridge picture
Fig. 5 
Igloo picture
-
4.
Initial Design Drawing – students worked individually to create a quick sketch of what they thought their final structure would look like. This task was done as an intermediate step that would highlight if the intervention alone conferred noticeable advantages to one condition or the other.
-
5.
Building Activity – students were given the materials and had fifteen minutes to complete their structure.
-
6.
Post-test – students repeated the pre-test task, and were given access to their pre-test data. The pre-test was made available to them in order to let them reflect on their prior designs (i.e. reuse them if they so pleased) and eliminate any concerns that some students may have forgotten their pre-test answers, while others memorized theirs.
-
7.
Reflection – students verbally reflect on the reasons why their design did or did not work. (See Fig. 6 for overall study design).
Fig. 6 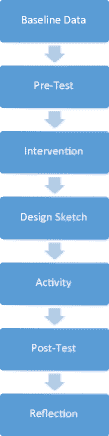
Overall design of the studies


Data Collection
Throughout the experiment, we collected multimodal data with a depth camera, high resolution web camera, electro-dermal activation wrist band, and microphone array. The Microsoft Xbox Kinect sensor was responsible for capturing multi-channel audio, frontal images and skeletal tracking data using custom developed software. A Logitech HD C920 was used to capture overhead audio and video. Electro-dermal activation was captured using the Affectiva Q-sensor. All devices were connected to the same computer, except for the Affectiva Q-sensor, which was synchronized with the computer’s clock before each experiment. These multimodal data sources allowed us to hand-annotate students’ actions, as well as quantify speech, hand/wrist movement and electro-dermal activation for each participant. The following sub-sections describe the data collection in more detail.
Hand-Coded Data
Hand coding of human actions occurred at approximately 1-s intervals. A snapshot of each pair’s behavior was generated at 1-s intervals, and labeled based on the Object Manipulation Class that it corresponded to. The snapshots were generated from a custom application that takes pictures using the Xbox Kinect sensor. In many cases, determination of the manipulation class could only be determined several seconds after the action was completed. For example, as a student is preparing to put two pieces close to one another, it is not clear as to whether this action will be building with those two pieces, or merely prototyping, until seeing what the student ultimately does with those two items. In the case that the items are affixed to one another, the action, beginning from the point that the students gets a hold of the materials, would be classified as a building action. However, if the items were only placed near each other to physically prototype an idea, the entire action sequence would be classified as a prototype action. This approach for coding provides an interpretative lens to each action, when compared to an approach in which a given participant’s behavior must be described at the time of observation. In previous work we demonstrated that this form of coding is effective for studying students in hands-on learning activities (Worsley and Blikstein 2013, 2014a).
Audio Data
Audio data was derived from a combination of audio channels from an overheard web camera, and audio from the Xbox Kinect sensor. Custom software was developed based on the Carnegie Mellon University (CMU) Sphinx Speech Recognition Toolkit (Lee et al. 1990). Specifically, the source code was modified to leverage the program’s voice activity detection feature. Voice activity detection is an automated means for determining when voice-based audio is being generated. Several speech recognition software solutions contain some variant of voice activity detection. The custom software provided voice detection start and stop times for all of the audio channels. Audio was considered to be present if either of the audio sources detected a voice, within a given second of time. Thus the final format of this data is a binary representation. Every second of the activity is labeled with a zero or one, for the absence or presence of audio at that time stamp. Because the audio channel captured sound from both participants this piece of data is the same for each person in a pair.
Hand/Wrist Movement
Hand/wrist movement data was also generated from the Xbox Kinect sensor. Once again, a custom-built application was used to store three dimensional data for twelve upper body joints. The application uses native features available from the Kinect for Windows SDK, specifically, the ability to conduct skeletal tracking in the seated position. The custom application stores the data at 10 Hz. From the file generated, we utilize only the left and right wrist, hand and elbow data points. For each successive pair of data points we compute the angular displacement for the vectors that connect: left wrist and left hand; left wrist and left elbow, right wrist and right hand; right wrist and right elbow. The eventual angular displacement that is recorded is an average of the four angular displacements. Using angle as the means for comparison reduces biases introduced by participants having different sized limbs. Accordingly, for each tenth of a second in time we have stored the total angular hand/wrist displacement.
Electro-Dermal Activation
Electro-dermal activation (also referred to galvanic skin response and/or skin conductance) readings were captured at 8 Hz. Processing of electro-dermal activation involved controlling for individual differences in variance, as well as individual differences in stress response. In practice, this was achieved by collecting baseline data as students completed the task of counting down by 7. We will refer to this as the “math” stress test. As additional baseline data, students also completed a Stroop test, and had their electro-dermal activation recorded during non-task oriented activities. As before, each data point was time-stamped with the local date and time. Each data point was then transformed into an index value by subtracting the mean from the “math” stress test, and then dividing by the standard deviation of the “math” stress test data for that student. As validation that this approach reduced individual bias, when we compared electro-dermal activation index values across the different activities, there were no statistically significant differences between experimental conditions for the baseline data, the Stroop test, or the math test. However, across the intervention, design phase and the building activity differences were statistically significant.
In addition to the multimodal data, we also collected manual annotations for the beginning and end of each phase of the experiment. Start and stop times for each activity were recorded based on the images from the Kinect sensor and the video data. Through these annotations we could group data based on the activity that it is associated with. For example, we know which data corresponds with the intervention phase, the design sketch phase, and the building activity phase, for each participant.
Data Extraction
This algorithm is designed to recognize process similarities between participants, and test the hypothesis that there are multimodal practices that distinguish principle-based reasoning from example-based reasoning. Within each analysis, the hypothesis is tested in two ways. First, students are clustered based on the similarity of their processes. This approach maintains the temporality of the student behaviors. We refer to this approach as computing the pair-wise “process similarity metric.” Second, we conduct a behavior frequency analysis which relaxes the temporal relationship. The purpose of this approach is to provide a simplified means for determining process-based differences. However, even in conducting this analysis, we look at the frequencies in aggregate, and also split each participant’s process into three adjacent sections. Looking at behavior frequency at these set intervals moves closer to understanding how student processes differed without aggregating across the entire process.Footnote 3
Figure 7 shows the general steps of the algorithm used for analysis. The algorithm builds on several previous studies (e.g. Berland et al. 2013; Blikstein et al. 2014.; Piech et al. 2012; Worsley and Blikstein 2013) and makes every effort to maintain the context of each piece of data by taking temporality into consideration, whenever possible. The paragraphs to follow provide a summary of each step.

General algorithm used for comparing process (from top to bottom)
Time-Stamp
The first step of extracting process data is to ensure that all data is properly time-stamped. Each data stream had been labeled with the local date and time of its occurrence, and stored as a csv. In the case of the electro-dermal activation data, a data synchronization step was either manually completed, or completed through the Q-sensor software. Apart from the electro-dermal activation sensors, all data was collected on the same computer. Having synchronized data sources allowed us to merge the data as needed for the different analyses. Merging the data was completed using custom Python scripts.
Segment
The time-stamped data is then segmented. Across all three analyses we segment the data every time a pair’s structure is tested. Testing will be described in more detail later, but for now, the reader can interpret testing as representing an instance in which at least one person in the pair is eliciting feedback that will update the students on the current stability of their structure. Testing usually takes the form of a team member placing the weight on their designed structure. As a whole, the segmentation process serves to smooth some of the noise in the data. Instead of having to take into account each of the spikes and troughs that may emerge from any of the data streams, segmentation allows us to look more for trends. Noise reduction is also a consideration for the next step.
Cluster Footnote 4
The segmentation process yields several “test segments” for each student, and hundreds of unique segments when aggregating across all students. These “test segments” are characterized by the proportion of time spent in each possible behavior. Some of these will be very similar to one another, only differing by an infinitesimal amount, while others will vary quite extensively from one another. The goal of clustering is to identify natural groupings among the various “test segments” and ultimately provide a common set of states, or behaviors, by which to compare individual user sequences. However, before proceeding with clustering, we first do data standardization. Namely, we adjust each value, such that all of the data in a given column has a mean of zero and a standard deviation of one. This process eliminates bias in clustering by ensuring that each column contributes equally to the distance metric, which is this case was Euclidean distance. After standardizing the data, we used X-Means clustering to group the data points into a set of clusters that place each “test segment” with the other “test segments” that it is most similar to. Once each “test segment” has been grouped with similar “test segments,” each cluster, or group, can be described based on the average values of all of its members. These values provide the basis for determining common behavioral practices across the three analyses.
Re-Label
All “test segments” that are put into the same cluster are given the same name. Accordingly, each student’s sequence of “test segments” can now be represented as a list of clusters.
Normalize
In the normalization step, each student’s re-labeled sequence is lengthened so that we can more directly compare them to one another. The two forms of normalization that we use are L-1 normalization and dynamic time warping (Rabiner et al. 1978). In the case of L-1 normalization, each sequence is lengthened so that all participants’ sequences are of equal length. In dynamic time-warping a modification of Levenshtein distance (Levenshtein 1966) is used to find the best match between pairs of sequences. As with L-1 normalization, dynamic time warping preserves the order of the data. However, unlike L-1 normalization, dynamic time warping may change the proportion of total time spent using each cluster type. Because of this, we used the L-1 normalization when examining the frequency of cluster usage, but broke the cluster usage frequency into a beginning, middle and final segment to maintain some of the temporal elements of students’ sequences. For answering questions around the cycles of iterations, and similarity in point-by-point process data, the dynamic time warping algorithm seemed more appropriate, as it preserves the order of the process and is able to capture the distance between each pair of participants.
Compare Behavior Frequency
After L-1 normalization, the next step is to compare behavior frequency data across the three metrics of interest: success, experimental condition; and learning. The comparisons are based on Mood Median Tests along each of the individual clusters of “test segments.” However, instead of the traditional Mood Median Test, which computes statistical significance based on a Chi-Square distribution, we use a binomial test. These two tests were used because the data did not meet the requirements for MANOVA and violated the typical requirements of a Chi-Square Test. This step represents the conclusion of one branch of the analysis tree.
Compute Distances
After dynamic time warping, distance is computed between each pair of participants.
Group Participants
After completing dynamic time warping, pairwise distances are computed. Those pairwise distances are used to construct an n-by-n matrix. As before, this matrix is standardized before conducting K-Means clustering with k = 2. Thus, each student is put into the group that contains other students whose process was most similar to their own.
Compare Participants Groups
Finally, the groups are compared using a binomial test to determine the probability that individuals were randomly assigned to their specific group. Specifically, it is here that we examine the hypothesis that different groups, as partitioned by experimental condition, success on the activity, or based on post-test score, used markedly different processes from one another.
In general, this algorithm is used to identify common behaviors, from the first round of clustering, and then use each students’ sequence of common behaviors as the basis for the second round of clustering or to examine usage of common behaviors between the two experimental conditions.
In the next three sections (Part 1, Part 2 & Part 3) we outline three separate analyses that all use the same general algorithm presented above. What will differ for each analysis is the type of data analyzed.
Part 1: Qualitative Analysis of Learning, Success and Strategies
One of the common strategies used for video data is to produce annotations of student behaviors. In many respects, producing timestamps any time a student begins a new action is tantamount to transcribing where the modality of interest is user behaviors. Prior work on multimodal analysis has leveraged this technique and shown it to be important for characterizing and understanding student learning (Barron et al. 2013; Kress et al. 2001). In similar fashion, in this first section, we describe an analysis in which we timestamped the video data for every instance of six prototypical actions, or Object Manipulation Classes, as outlined in Table 2. As previously noted, actions were coded at 1-s intervals based on the video and frontal image data. Because of the nature of some of the actions, accurate labels could only be determined after the action was completed. The specific actions are based on Worsley and Blikstein (2013, 2014a) which showed that this coding paradigm is a useful way for studying hands-on learning, and that the coding paradigm bears similarity to prior work in engineering education (Atman et al. 1999).
Common Behavior Analysis
The segmentation that follows hand-coding results in approximately two hundred unique “test segments.” For this analysis each “test segment” is defined based on the proportion of time spent in each of the five Object Manipulation Classes (c-realize, c-plan, c-modify, c-revert, c-nothing).Footnote 5 Clustering those “test segments” resulted in four common behaviors, or clusters. Each cluster can be characterized by the relative proportion of time spent in each of the five activities. As an overview, Fig. 8 shows the distribution of the four common “test segment” types. The labels assigned to each region of the pie chart will make more sense based on the data presented in Fig. 9 and in the following paragraphs.

Relative frequency of common behaviors

Characteristics of common behaviors for Part 1
The most frequently occurring cluster, IMPLEMENT, is characterized by significantly above average proportions of c-realize and c-revert. The proportion of c-nothing is below average, as is c-plan. Accordingly, this cluster seems to represent project or idea implementation in the absence of planning and/or modifying.
Because the primary actions for this cluster of “test segments” involves either adding to an existing structure (c-realize), or undoing an existing structure (c-revert), we call this cluster IMPLEMENT. That nearly two-fifths of the “test segments” are characterized by implementing an idea, is in line with the fact that the overall task is focused on hands-on manipulation of materials.
The second most frequently occurring cluster, PREPARE, is typified by above average c-plan behavior and above average c-nothing behavior.
At the same time, this cluster also represents below average c-modify, and c-realize and appears to be roughly average for c-revert. We call this cluster PREPARE, as the students seem to principally be concerned with actions that are either explicitly or implicitly indicative of preparing to actually build. The fact that a large proportion of segments is spent doing PREPARE indicates that even though the focus of the activity is geared towards “making,” many students are engaging in reflective processes that help them think about how best to complete the task. Furthermore, since several of the “test segments” are PREPARE segments, students are likely using PREPARE throughout the process.
The third cluster, ADJUST, is characterized by above average c-modify, and below average c-plan and c-realize. The behavior’s average c-modify value is approximately one standard deviation above the mean value for the entire population of “test segments”.
This indicates that when using this “test segment” students are spending a significant proportion of their time adjusting their structure, but may also occasionally spend a portion of the “test segment” doing nothing, or undoing. This, again seems reasonable. Based on observations made during data collection and video annotation, making adjustments to a structure was a fairly common activity. As can be seen from Fig. 8, ADJUST is nearly 20% of all “test segments” across all users.
An above average proportion of c-modify actions also characterizes the fourth cluster. However, whereas the ADJUST cluster involved c-modify values that were one standard deviation above the mean, SIGNIFICANTLY ADJUST has c-modify values that are closer to two standard deviations above the mean. To compensate for this increase in the proportion of time spent modifying, the proportion of time spent in c-realize, c-plan and c-nothing are all well below average. In this case it appears as though these “test segments” are typified by students only making adjustments to their structures. Again, based on personal observation, this seems like an accurate characterization of several “test segments” as some students tried to make their structure work without a clear sense of how to do so. Because the focus almost exclusively resides in c-modify, we call this cluster SIGNIFICANTLY ADJUST. Ten percent of the “test segments” were grouped into this cluster.
Process Similarity Comparison
Recall that the process similarity comparison groups students based on the pair-wise similarity of their processes. This particular metric maintains the order that each student completes each action, at the “test segment” level. Figure 10 shows the results of grouping students based on their process similarity, with a focus on comparing the number of student from each condition assigned to a given group.

Composition of groups based on experimental condition as derived from process similarity for Part 1
Seven students from the principle-based condition were assigned to Group A, while the remaining three were assigned to Group B. For the example-based condition, three students were assigned to Group A, while the remaining five were assigned to Group B. According to a binomial test, there is approximately a 12% chance of this, or a less frequent split, happening at random. In addition to looking at experimental condition, we also examine how Group A and Group B differ in terms of success (Fig. 11).

Composition of groups based on success as derived from process similarity for Part 1
Comparing Group A and Group B based on success rates produces a much clearer distinction. Seven of the ten students assigned to Group A succeeded on the activity, whereas only one of the eight students in Group B succeeded on the activity. The likelihood of this happening at random is less than 2%, suggesting that there were substantive process based differences between successful and unsuccessful students when considering their actions. To explore these differences more deeply, we now proceed to compare cluster frequency usage.
Comparing common behavior usage takes on two forms. At the most general level, it involves aggregating cluster frequency across the entirety of each student’s process. However, in order to provide a more fine-grain comparison, we also look at cluster usage in the first, second, and third portions of each student’s process.
Coarse-Grain Cluster Usage Comparison
Figure 12 shows the median cluster frequency usage for the example-based and principle-based conditions. The most pronounced differences between the example-based condition and the principle-based condition is in the IMPLEMENT cluster. The principle-based reasoning condition makes significantly more (p = 0.017) use of the IMPLEMENT cluster than their peers in the example-based reasoning condition. They also make less (p < 0.001 (8.5 × 10⁻⁵)) use of SIGNIFICANTLY ADJUST. These are the only dimensions for which there are statistically significant differences between the two conditions.

Median common behavior usage by condition for Part 1
Figure 13 contains the same analysis, but now with success as the dependent variable. The most pronounced differences appear to be in the IMPLEMENT, ADJUST and SIGNFICANTLY ADUST categories. However, tests of statistical significance reveal that there are statistically significant differences in IMPLEMENT (p = 0.017) and SIGNIFICANTLY ADJUST (p = 0.017).

Median common behavior usage by success for Part 1
Finally, for the analysis of learning, we find that students who learned more spent relatively more time in IMPLEMENT (Fig. 14). When we compare students with positive learning scores, with those receiving negative learning scores, we find a statistically significant difference (p = 0.0019). Again there is a trend that students who spend more “test segments” in IMPLEMENT spend fewer “test segments” in ADJUST and SIGNIFICANTLY ADJUST, but still spend approximately the same number of “test segments” in PREPARE.

Median common behavior usage by learning score for Part 1
The coarse-grain analysis supports the hypothesis that students significantly differed in their processes when comparing experimental condition, success and learning. However, the coarse-grain analysis provides little in the way of describing where those differences are occurring and whether or not there is any causality in what is observed. To address this, the following section features a fine-grain analysis of cluster frequency usage that splits each student’s process into three equally-sized parts.
Fine-Grain Cluster Usage Analysis
A fine-grained analysis indicates that there are no significant differences between the two conditions. While there are places that have noticeable differences, those results are dropped after post-hoc analysis with Benjamini-Hochberg.
The fact that this particular algorithm appears to primarily be distinguishing successful students from unsuccessful students is reiterated through a fine-grained analysis of cluster usage. Specifically, there is a statistically significant difference (p = 0.0004) between successful and unsuccessful students in the amount that they use IMPLEMENT during the first third of the activity. Successful students were more likely to use IMPLEMENT, whereas the unsuccessful students were more likely to be in ADJUST or PREPARE. Apart from IMPLEMENT usage in the first third, there were no differences between successful and unsuccessful students.
Much like the case of condition, the fine-grained analysis did not identify any statistically significant differences between students who received positive post-test scores, and those who received negative post-test scores.
Discussion
In this section we have presented results that confirm the hypothesis that student processes differed along several dimensions for the principle- and example-based experimental groups. We began by discussing the four common “test segment” types. These were termed PREPARE, IMPLEMENT, ADJUST and SIGNIFICANTLY ADJUST. We then moved on to show that the process similarity comparison yielded weakly significant results when comparing between experimental conditions. However, when looking at success rate, the process similarity metric did substantially better. We then proceeded to analyze how the cluster usage frequency data could be used to describe the differences observed in the process similarity metric. The coarse-grain analysis found that increased usage of IMPLEMENT correlated with success, learning and the principle-based reasoning experimental condition. In interpreting this information it is important to recall that segmentation was based on when students tested and not based on the total amount of time spent on the task. Hence any attempt to argue that students spent more time in a given activity is not the appropriate inference to be made. Instead the results should be thought of in terms of the proportion of a students’ test segments that were spent in a given activity, recalling that these can be of variable length.
Moving to the more fine-grain analysis provided additional insight into how successful and unsuccessful students differ in how they start the activity. Namely, successful students were likely to spend more of the first-third in IMPLEMENT, than unsuccessful students. That said, even though the coarse-grain analysis consistently reported that usage of IMPLEMENT was important, the analysis, on the whole still leaves many questions about why the two experimental conditions significantly differed from one another.
Part 2: Multimodal Analysis of Learning, Success and Strategies
In Part 1 of this article we used hand-annotated data to pinpoint differences in how students enacted the engineering design process. In Part 2, we transition into using automated multimodal sensor data. This multimodal data includes audio, hand/wrist movement and electro-dermal activation. Whereas the analysis in Part 1 included the semantics of each user’s actions, the analysis in Part 2 will take a purely behavioral approach, but leverages multiple data streams in order to better capture the context in which each piece of data is recorded. This has commonly been a justification for undergoing multimodal analysis. Furthermore, prior research has studied how student posture and audio can be used as indicators for inferring student epistemological frames (Elby and Hammer 2010; Hutchison and Hammer 2009; Russ et al. 2012; Scherr and Hammer 2009). Accordingly, in this analysis we will examine student behavior at a similar level of granularity and identify the amount of audio, hand/wrist movement and electro-dermal activation that students generate at different points in time.
Common Behavior Analysis
Figure 15 shows the relative frequency of each of the characteristic “test segments.” Again, the labels will be more understandable following the discussion of each common behavior and their accompanying graphical representations which are summarized in Fig. 16.

Relative frequency of common behaviors for Part 2

Characteristics of common behaviors for Part 2
The most common segment, which we call ENGAGED, is characterized by near or below average behavior across all three variables: audio, hand/wrist movement and electro-dermal activation. When examined in comparison to the other common behaviors (Fig. 15), ENGAGED is the most balanced, with no individual modality significantly dominating the others. This cluster represents roughly 60% of all “test segments”.
As we compare the usage across conditions, rate of success and quality of learning, the argument for calling this category ENGAGED will become clearer. For now, suffice it so say that this cluster represents the vast majority of all “test segments”, and that it is typified by average stress, average movement and little speech. One can picture students in ENGAGED concentrating on the task by carefully manipulating the materials without the need for extended discussion, movement or arousal.
The second most frequently occurring “test segment” is one that we have entitled ACTION. This behavior primarily consists of segments in which students use above average hand/wrist movement.
What’s more, though, is that this occurs in the absence of high electro-dermal activation, which is normally correlated with body movement. An additional point of interest is the lack of audio associated with this behavior. Students are focused on building and refraining from extensive discussion with one another. Accordingly, one might conjecture that the students are findings other means through which to communicate with one another.
After ACTION, the most frequently occurring state is TALK. This particular cluster represents approximately 18% of all “test segments.”
The amount of audio in this cluster is approximately two standard deviations above the mean. Hand/wrist data is just above the mean, and electro-dermal activation is nearly half a standard deviation below average. Again, this is analogous to ACTION in that students appear to only engage one of the multimodal behaviors at a given time.
The final cluster is one that we call STRESS. This behavior is characterized by extremely large values of electro-dermal activation, as well as above average hand/wrist movement.
As mentioned before, one would expect for electro-dermal activation and hand/wrist movement to correlate with one another. Hence we can anticipate that the electro-dermal activation values may be slightly inflated, but are still, more than likely, well above average. On the other hand, that the students are stressed, may be causing them to work more frantically, which would result in an increase in hand/wrist movement. STRESS accounts for approximately 10% of students “test segments”.
Process Similarity Comparison
Before discussing the specifics of the process differences, we first present results from grouping students based on the similarity of their processes. Process similarity was based on the two participant clusters created from the pair-wise comparison of student sequences. Seven of the eight students assigned to Group A are from the principle-based condition. The inverse pattern is observed for Group B, with seven of the eight individuals in that group coming from the example-based reasoning condition (Fig. 17). The likelihood of this happening randomly is less than 0.003, suggesting that the two conditions did, in fact, utilize markedly different processes.Footnote 6

Composition of groups based on experimental condition as derived from process similarity for Part 2
Having observed that there are salient differences between the processes that the two conditions use, as determined through multimodal data, we now consider the nature of those differences. As in Part 1, we examine cluster usage at coarse- and fine-grains.
Coarse-Grain Cluster Usage Analysis
Figure 18 shows the median normalized frequency of cluster usage by experimental condition. From the figure it is apparent that the median value for ENGAGED is quite different between the two conditions.

Median common behavior usage by condition for Part 2
A test of statistical significance confirms that students in the principle-based reasoning condition were more frequently (p = .0098) in ENGAGED than their peers in the example-based reasoning condition. No other statistically significant differences emerged between the two groups when comparing their cluster frequency.
In terms of success, there are no statistically significant differences in terms of cluster, or behavior, usage (Fig. 19). Much like the case of success, the data does not reveal any significant differences between students who experienced positive learning and negative learning gains (Fig. 20).

Median common behavior usage by success for Part 2

Median common behavior usage by learning score for Part 2
Fine-Grain Cluster Usage Analysis
A fine-grained analysis indicates that there are significant differences between the two conditions during all three portions of the activity. Students in the principle-based reasoning condition are more likely to be in ENGAGED for the first (p < 0.001 (2.2 × 10⁻⁵)) and third (p = 0.0097) thirds, than their peers in the example-based reasoning condition. This suggests that the two conditions differed at all three stages, but that the greatest divergence occurred during the first portion of the activity. In particular, many of the students from the example-based reasoning condition primarily spend the first third of the activity in ACTION. In a later section, we discuss the implications of this in more detail.
The fine-grained analysis did not identify any significant differences between successful and unsuccessful students in terms of how frequently they used the different clusters, or common behaviors.
The fine-grained analysis did indicate that students that learned more through the activity were more likely be in ENGAGED during the first third of the activity. Specifically, the students that received positive post-test scores were much more likely (p < 0.001 (0.0005)) to use ENGAGED than students who received a negative post-test score. This trends continues among the students that received a score of zero, but not at a statistically significant level.
Discussion
In deciphering the differences between the principle-based reasoning condition and the example-based reasoning condition, the current multimodal analysis offers a significant improvement beyond the analysis from Part 1. Specifically, this particular analysis included statistically significant differences in the process similarity metric between the experimental conditions. Furthermore, both the coarse-grain and fine-grained analyses offered some additional insight into identifying the elements of each condition’s process that differed. The coarse and fine-grained analyses showed that students in the principle-based reasoning condition made more extensive use of ENGAGED than students in the example-based reasoning condition. That difference emerged during all three portions of the activity and was most pronounced during the first third. This is telling because it indicates that the differences were not merely the result of students being more or less successful on the activity. In fact, this analysis did not reveal any differences between successful and unsuccessful students at any grain size. Instead, the only other difference was observed from the learning metric. Once again, ENGAGED was positively correlated with student learning.
Realizing that the analyses from Part 1 and Part 2 provided different benefits, in Part 3, we will examine the merits of combining the two approaches with the hope of identifying differences along all three metrics: experimental condition, success and learning.
Part 3: Combined Analysis
Part 1 leveraged semantic-level descriptions of each student’s actions as the means for exploring the hypothesis that processes significantly differed. This analysis concluded that the use of IMPLEMENT was positively correlated with success, learning and the principle-based reasoning condition. However, grouping students based on their processes only yielded significant results in terms of success, and didn’t have a strong correlation with experimental condition. In Part 2, we presented an analysis that involved automatically-derived, behavioral data. This analysis effectively distinguished between students from the different experimental conditions, based on their differential usage of ENGAGED. ENGAGED was also important for predicting student learning. Additionally, the process similarity metric confirmed these results by creating two groups that almost perfectly align with the two experimental conditions. However, the analysis did not provide much in the way of determining the behaviors associated with success. Having garnered different benefits from each analysis, one can’t help but wonder if combining approaches would provide the quintessential multimodal analysis. Thus, in Part 3 we combine data from Part 1, with data from Part 2 in an effort to push the limits of multimodal analysis, and explore the possibility of generating results that highlight differences in condition, success and learning.
The data for this analysis includes an eight dimensional vector (c-plan, c-realize, c-modify, c-revert, c-nothing, audio, hand/wrist movement and electro-dermal activation). As before, we begin by presenting the most common clusters of behavior among the population of research participants.
Common Behavior Analysis
In describing the clusters, we used names that make reference to the cluster names in Part 1 and Part 2, where appropriate. Figure 21 and Fig. 22 contain the relative frequency and characteristics of each behavior, respectively. As before, the following paragraphs will be used to describe each of the common multimodal behaviors.

Relative frequency of common behaviors for Part 3

Characteristics of common behaviors for Part 3
The first cluster that we describe is the IMPLEMENT-ACTION cluster. This cluster represents 37% of all “test segments” and is typified by significant c-realize, slightly above average hand/wrist movement and slightly above average c-revert.
Values for c-plan, electro-dermal activation and audio are also approximately average, while values for c-nothing and c-modify are generally below average. We interpret this data as being associated with students actively working towards physically completing their structure. Above average c-realize very clearly keys the reader into this fact. The additional modalities measured then provide insights into the other behaviors associated with project implementation, namely, hand/wrist movement.
The second most frequent cluster that we describe is the PREPARE-ACTION cluster which constitutes 17% of all “test segments.” Much like the PREPARE cluster in Part 1, this cluster is characterized by above average c-plan. However, it differs in that c-nothing is not associated with this particular behavior. Furthermore, there is greater hand/wrist movement associated with PREPARE-ACTION than for IMPLEMENT-ACTION. This runs contrary to the initial assumption that ideating about one’s project does not require extensive hand/wrist movement. In this case, the students use more body gestures while planning than while engaging in IMPLEMENT-ACTION. All of the other values are well below average for this common behavior. In particular, this cluster is associated with the lowest average value for c-modify. Because one would not expect for a student to make changes to their structure while in the planning phase, this result seems reasonable.
The third cluster is REST-TALK. As the name implies, it is associated with students appearing to be fairly static (high c-nothing) and occasionally engaging in dialogue. This behavior has the highest average audio value and the lowest hand/wrist movement value. As such, combining the data streams provides a new way to think about the multimodal behaviors associated with planning and appearing to do nothing. It also offers validation that the coding of the Object Manipulation Classes was consistent. Specifically, c-nothing is associated with below average values of hand/wrist movement.
The final behavior is ADJUST-STRESS. This behavior accounts for 22% of all “test segments.” Recall that the previous analyses contained two behaviors associated with adjusting (ADJUST and SIGNIFICANTLY ADJUST) and one associated with high electro-dermal activation (STRESS). In combining the two analyses, one of the common behaviors that emerges lies at the intersection of the previously identified behaviors (from Part 1 and Part 2). Amidst this common behavior, the student is unlikely to participate in c-plan, c-nothing or c-realize, and is instead focused on modifying their design.
Process Similarity Comparison
Despite the increased contextualization afforded through the combination of multimodal sensor data and the hand-coded data, the results of a process similarity analysis are less than stellar. Group A consists of five students from the example-based reasoning condition, and four from the principle-based reasoning condition. The remaining seven students are in Group B (Fig. 23).

Composition of groups based on experimental condition as derived from process similarity for Part 3
We also observed a lack of differentiation when comparing successful students with unsuccessful students (Fig. 24). Similarly, the process similarity metric results do not align to student learning scores. From this standpoint, combining the data streams did not produce the desired result. By all accounts this provides a good indication that embarking upon this line of analysis may be less fruitful than the two individual analyses in Part 1 and Part 2. Even so, as an exercise in completeness, we still use the upcoming sections to investigate coarse- and fine-grain differences in common behavior usage.

Composition of groups based on success as derived from process similarity for Part 3
Coarse-Grain Cluster Usage Analysis
A coarse-grain analysis of cluster usage between conditions suggests that there are no differences between the two conditions (Fig. 25). The median value for ADJUST-STRESS and PREPARE-ACTION appear to be markedly different between conditions, but these differences aren’t statistically significant. This lack of results is somewhat surprising given the consistent results observed in Part 1 where the IMPLEMENT state was associated with success, learning and the principle-based reasoning condition. Here IMPLEMENT-ACTION occurs at equal rates between conditions. One potential implication of this finding is that students enact IMPLEMENT differently within each condition. Since adding hand/wrist movement distorted the IMPLEMENT based differences between conditions, one can infer that students in the principle-based reasoning condition likely completed more IMPLEMENT in the context of smaller scale hand/wrist movements – this result follows from the previous observation that students in the principle-based reasoning condition spent more time in ENGAGED which was characterized by lower wrist/hand movement. In this sense, IMPLEMENT may not be enacted in the same way across conditions.

Median common behavior usage by condition for Part 3
Considering success, there are statistically significant results for usage of ADJUST-STRESS (Fig. 26). Successful students are less likely (p = 0.0097) to use ADJUST-STRESS than unsuccessful students. This finding differs from that observed in Part 1 for the ADJUST behavior. In Part 1, ADJUST was not associated with any significant differences. In this case it appears as though adding the additional context of multimodal behavioral data creates a more complete picture of what students are experiencing. For success, there were no statistically significant differences along the other three common behavior types.

Median common behavior usage by success for Part 3
Finally, like success, learning also negatively correlates with ADJUST-STRESS (Fig. 27). Students that received positive post-test scores are less likely (p = 0.006) to use ADJUST-STRESS than students that received negative scores on the post-test.

Median common behavior usage by learning score for Part 3
Fine-Grain Cluster Usage Analysis
Consistent with the coarse grain analysis, the fine-grain analysis does not reveal any statistically significant differences between the two conditions. This is somewhat expected given that Part 1 did not garner differences in fine-grain cluster usage, nor did the coarse-grain analysis. Furthermore, the common behaviors from the combined data did not contain an analog to ENGAGED which characterized principle-based reasoning in Part 2.
Comparing fine-grain cluster usage between successful and unsuccessful students expands the set of dimensions on which students differed. Specifically, successful students were more likely (p = 0.0097) to use IMPLEMENT-ACTION and less likely (p = 0.0097) to use ADJUST-STRESS during the middle and final thirds, respectively.
Finally, students with positive post-test scores were less likely (p = 0.0097) to use ADJUST-STRESS in the final third of the activity than students with negative post-test scores.
Discussion
This analysis was intended to combine the benefits of the hand-coded analysis, in terms of cluster usage, with the increased precision, and process-oriented distinctions associated with the multimodal sensor data. However, this approach failed to harness the benefits of either of the previous analyses, and, instead, provided useful insights on a different dimension. That this analysis did not produce the desired outcome was evident from the results of the process similarity analysis. These results failed to align with success, learning or experimental condition. Despite these shortcomings, this combined analysis did reveal a methodology for predicting student success and learning. In particular, coarse- and fine-grained cluster usage analyses found that ADJUST-STRESS was negatively correlated with success and learning. While one would theoretically anticipate that students who have not succeeded or learned, would experience stress as their time begins to expire, and that they would resort to trying extensive adjusting in order to cope with the pending failure of their structure; having a computational tool to detect this has practical utility for supporting constructionist learning environments.
Nonetheless, the real benefit of this analysis comes, in part, through the ability to more closely understand the nuances of multimodal behaviors. For example, one such finding is drawn from taking the results of Part 3 in relation to those of Part 1. In Part 1, IMPLEMENT was associated with principle-based reasoning, positive learning gains, and success. However, when IMPLEMENT was put in the context of hand/wrist movement (i.e. IMPLEMENT-ACTION), the differences identified in Part 1 vanished. It therefore followed that the gestural enactment of IMPLEMENT may have differed by experimental condition, success and post-test score. One interpretation of this difference is that the two experimental conditions differentially impacted the rates of epistemic and pragmatic actions (Kirsh and Maglio 1994). Epistemic actions are described as modifications to a system or an environment that help uncover information that may be hard to compute mentally. These epistemic actions are in contrast to pragmatic actions which are necessarily focused on physically moving the participant closer to their goal state. The combined multimodal analysis introduced the possibility that students are using building actions in different ways.
In addition to offering important insights into the nuances of multimodal behaviors, the fact that this analysis did not combine the affordances of the two previous analyses is informative. More specifically, this unexpected result highlights important aspects and considerations about the nature and complexities of conducting multimodal learning analytics research that would be sorely overlooked had we excluded the combined analysis.
Conclusion
This article began with an appeal to think more broadly about how to describe when a given learning strategy is effective. We analyzed strategy efficacy in relation to structural success and learning. Previous work had identified clear indications that principle-based reasoning yielded more favorable results than example-based reasoning (Worsley and Blikstein 2014b). Having seen the benefit of principle-based reasoning across metrics, we raised questions about what is mediating these differences. Particularly we were interested in determining the practices associated with principle-based reasoning, and suggested that leveraging multimodal data could provide a means for conducting such an analysis.
Based on this assumption we proposed a general algorithm that allowed us to (1) identify common multimodal behaviors, (2) conduct pairwise process comparisons that maintained the temporal elements of the data and (3) get a glimpse of the different behaviors used by different groups (in terms of experimental condition, success and learning). We conducted three analyses using the same general algorithm. The first analysis utilized human generated time-stamps of individual actions based on a coding scheme from prior work (Worsley and Blikstein 2013, 2014a). From this analysis, we learned that students that spent more of their “test segments” implementing their ideas were more successful, learned more, and were more likely to be from the principle-based reasoning condition. In this light, one could argue that this supports the current “maker” practice of encouraging students to tinker at the expense of thinking. But we would suggest that perhaps the direction of causality is more in line with the idea that the principle-based reasoning condition enabled students to spend more time in implementation and less time in adjusting, and that this mediated student success and student learning. Put differently, without the initial focus on principles during the intervention, students would not have been able to engage in sustained implementation. However, this level of causality cannot be determined based on the current analysis. Nonetheless, even without being able to establish causality, this analysis revealed a student practice that bore significance across all three metrics of interest. At the very least, then, this form of analysis can be used for producing predictions. One shortcoming, though, was that the pair-wise process comparison was more closely aligned to success than to experimental conditions.
Given that a primary focus of these analysis was to uncover the practices that distinguish principle-based reasoning from example-based reasoning, we conducted a second analysis based on automatically derived data from various multimodal sensors. These data streams included audio, hand/wrist movement and electro-dermal activation. This second analysis produced much higher predictive accuracy for distinguishing between the two experimental conditions based both on the cluster frequency usage and when conducting the pair-wise process similarity comparisons. Specifically, students who made more extensive use of a behavior pattern that we called ENGAGED, were more likely to be from the principle-based reasoning condition. ENGAGED was also associated with better performance on the post-test. However, this analysis was unable to identify distinctions among students whose structures were of different levels of stability. This lack of correlation with success is significant, because it means that students in the principle-based reasoning condition remain in ENGAGED even though they may not have been successful. Hence, one cannot make the argument that deviation from ENGAGED was merely the result of students experiencing challenges with their structures. Nor can one make the argument that it was only more knowledgeable students that were likely to remain in ENGAGED, as the correlation between learning and ENGAGED only emerged during the final third of the activity. In summary, then, the two sets of data seemed to offer complementary benefits. As such, Part 3 of this article combined the data sets. This combination produced clusters that were far less predictive than the two previous analyses. The analysis did, however, provide common associations that exist between the human-coded data and the multimodal behaviors, and in this way served as additional validation for the human coding. Additionally the analysis uncovered important nuances of multimodal behaviors. Furthermore, the shortcomings of the process similarity results from the final analysis motivate a later discussion of overarching concerns and considerations that one must account for when conducting multimodal learning analytics research.
Looking across analyses, there are clear instances where each provided some novel insights. In this sense, the overall algorithm appears to have relevance for studying learning, success and experimental condition; but honing in on these correlations requires different modes of analysis.
As a whole this article has shown that success, learning and process are not equivalent, though they may occasionally overlap. Thus, when thinking about measuring the effectiveness of a given learning environment it is important to be clear about which metrics one hopes to optimize. At the same time, this article has provided additional evidence that experimental condition can have an impact on learning, success and process. Because of this, one has to be cognizant about how to develop learning and reasoning approaches that allow the environment to realize the desired outcomes.
Finally, the three analyses provided evidence that multimodal analysis can provide a means for studying effective practices. Furthermore, they contribute to the argument that conducting research in constructionist environments likely necessitates adopting non-traditional modes of assessment. Reverting to traditional, uni-modal, outcome-based assessments will belie the goals of constructionist learning. For example, the results from Part 2 made this clear by showing that students spent most of their time in ENGAGED, a behavior that was characterized by a combination of multimodal behaviors. As a result, there is a need to embark on data analysis techniques that go beyond the current strategies used for studying and assessing “making” and, espouse approaches that provide a broader perspective on learning, and that take a much more multimodal perspective. At the same time however, Part 3 demonstrated that simply concatenating different forms of data does not guarantee a successful analysis. This should not be taken to suggest that multimodal learning analytics does not have utility for advancing the field. On the contrary, all three computational analyses make it evident that multimodal analysis has considerable merit. One simply needs to use care in ensuring alignment among methodology, data fusion and hypotheses.
Finally, despite our focus on “making” as the context of study, we argue that the analyses presented here likely have applicability across a broader set of learning environments. Moreover, these approaches could be used to study other elements of a given learning environment. For example, one could study correlations between teaching practices, or the physical design of a learning environment and student engagement. As we saw from the work of Scherr and Hammer (2009) and Kress et al. (2001), student learning experiences are often typified by multimodal behaviors. Fortunately, artificial intelligence and machine learning offer great promise in taking a multimodal perspective.
Notes
“Making” has become a twenty-first century buzzword that means different things to different people. And while making is instantiated in a variety of ways and contexts, the central idea harkens back to Constructionism, a pedagogical approach based on the possibilities of making personally meaningful, physical and computational artifacts. As such, Making experiences are often typified by learners completing collaborative, hands-on projects in relatively unstructured environments.
We define complex environments as those where students physically interact with other individuals and physical materials in the process of learning.
With the various grain sizes of data utilized, one concern is dealing with multiple comparison bias. To address this, we used Benjamini-Hochberg posthoc analysis with an initial alpha of 0.05.
Clustering is the process of grouping together items that are similar to one another.
c-evaluate does not appear because it was used to determine where to segment the data. Additionally, we have appended “c-“to the beginning of each object manipulation class to help delineate them from the multimodal behavior that we will describe later.
One question is if these results are being inflated by the dyadic nature of the task. For example, two individuals that work together are likely to mirror each other’s behavior. When we do an analysis to determine how frequently a given student’s process is most similar to that of their partner, we find that this is only the case for two of the eight pairs, and if we remove the partner from consideration, that student is still likely to be most similar to another individual from the same experimental condition.
References
Atman, C., & Bursic, K. (1998). Verbal protocol analysis as a method to document engineering student design processes. Journal of Engineering Education, 87(April), 121–132 Retrieved from http://onlinelibrary.wiley.com/doi/10.1002/j.2168-9830.1998.tb00332.x/abstract.
Atman, C., Chimka, J., Bursic, K., & Nachtmann, H. (1999). A comparison of freshman and senior engineering design processes. Design Studies, 20(2), 131–152 Retrieved from http://www.sciencedirect.com/science/article/pii/S0142694X98000313.
Atman, C., Cardella, M., Turns, J., & Adams, R. (2005). Comparing freshman and senior engineering design processes: An in-depth follow-up study. Design Studies, 26(4), 325–357 Retrieved from http://www.sciencedirect.com/science/article/pii/S0142694X04000754.
Baker, R. S. J. D., & Yacef, K. (2009). The state of educational data mining in 2009: A review and future visions. JEDM-Journal of Educational Data Mining, 1(1), 3–17.
Bamberger, J., & Schön, D. (1983). Learning as reflective conversation with materials: Notes from work in progress. Art Education, 36(2), 68–73 Retrieved from http://www.jstor.org/stable/3192667.
Barron, B., Pea, R., & Engle, R. (2013). Advancing understanding of collaborative learning with data derived from video records. The International Handbook of Collaborative Learning (pp. 203–219). New York: Taylor & Francis Group.
Berland, M., Martin, T., Benton, T., Petrick Smith, C., & Davis, D. (2013). Using learning analytics to understand the learning pathways of novice programmers. The Journal of the Learning Sciences, 22(4), 564–599. https://doi.org/10.1080/10508406.2013.836655.
Blikstein, P., & Worsley, M. (2016). Multimodal Learning Analytics and Education Data Mining : Using computational technologies to measure complex learning tasks, 3(2), 220–238. https://doi.org/10.18608/jla.2016.32.11.
Blikstein, P., Worsley, M., Piech, C., Sahami, M., Cooper, S., & Koller, D. (2014). Programming pluralism: Using learning analytics to detect patterns in the learning of computer programming. The Journal of the Learning Sciences, 23(4), 561–599.
Elby, A., & Hammer, D. (2010). Epistemological resources and framing: A cognitive framework for helping teachers interpret and respond to their students’ epistemologies. In L. Bendixen & F. Feucht (Eds.), Personal epistemology in the classroom: Theory, research, and implications for practice (pp. 409–434). Cambridge: Cambridge University Press. https://doi.org/10.1017/CBO9780511691904.013.
Gentner, D., & Holyoak, K. (1997). Reasoning and learning by analogy. American Psychologist, 52(1), 32–34.
Gick, M., & Holyoak, K. (1980). Analogical problem solving. Cognitive Psychology, 355, 306–355 Retrieved from http://www.sciencedirect.com/science/article/pii/0010028580900134.
Harel, I. E., & Papert, S. E. (1991). Constructionism. New York: Ablex Publishing.
Hutchison, P., & Hammer, D. (2009). Attending to student epistemological framing in a science classroom. Science Education, n/a-n/a. https://doi.org/10.1002/sce.20373.
Kafai, Y. B. (1995). Minds in play: Computer game design as a context for children’s learning. Abingdon: Routledge.
Kirsh, D., & Maglio, P. (1994). On distinguishing epistemic from pragmatic action. Cognitive Science, 18(4), 513–549.
Kress, G., Jewitt, C., Ogborn, J., & Charalampos, T. (2001). Multimodal teaching and learning: The rhetorics of the science classroom. London: A&C Black.
Lawler, R. W., & Yazdani, M. (1987). Artificial Intelligence and Education: Learning environments and tutoring systems (Vol. Vol. 1). Bristol: Intellect Books.
Lee, K. F., Hon, H. W., & Reddy, R. (1990). Overview of the SPHINX speech recognition system. IEEE Transactions on Acoustics, Speech, and Signal Processing, 38, 35–45. https://doi.org/10.1109/29.45616.
Lehrer, R., & Schauble, L. (1998). Reasoning about structure and function: Children’s conceptions of gears. Journal of Research in Science Teaching, 35(1), 3–25.
Levenshtein, V. I. (1966). Binary codes capable of correcting deletions, insertions and reversals. Soviet Physics Doklady, 10(8), 707–710.
Martin, T., & Sherin, B. (2013). Learning analytics and computational techniques for detecting and evaluating patterns in learning: An introduction to the special issue. The Journal of the Learning Sciences, 22(4), 511–520.
Pea, R., Mills, M., Rosen, J., Dauber, K., Effelsberg, W., & Hoffert, E. (2004). The diver project: Interactive digital video repurposing. MultiMedia, IEEE, 11(1), 54–61.
Piaget, J. (1973). To understand is to invent: The future of education (G. Roberts, Trans.). NY: Grossman Publishers.
Piech, C., Sahami, M., Koller, D., Cooper, S., & Blikstein, P. (2012). Modeling how students learn to program. In Proceedings of the 43rd ACM Technical Symposium on Computer Science Education (pp. 153–160). New York: ACM. https://doi.org/10.1145/2157136.2157182
Rabiner, L. R., Rosenberg, A. E., & Levinson, S. E. (1978). Considerations in dynamic time warping algorithms for discrete word recognition. The Journal of the Acoustical Society of America, 63(S1), S79–S79.
Russ, R. S., Lee, V. R., & Sherin, B. L. (2012). Framing in cognitive clinical interviews about intuitive science knowledge: Dynamic student understandings of the discourse interaction. Science Education, 96(4), 573–599. https://doi.org/10.1002/sce.21014.
Scherr, R. E., & Hammer, D. (2009). Student behavior and epistemological framing: Examples from collaborative active-learning activities in physics. Cognition and Instruction, 27(2), 147–174. https://doi.org/10.1080/07370000902797379.
Schwartz, D. L., Lindgren, R., & Lewis, S. (2009). Constructivism in an age of non-constructivist assessments. In S. Tobias & T. M. Duffy (Eds.), Constructivist instruction: Success or failure? (pp. 34–61). New York: Routledge/Taylor & Francis Group.
Smith, J.P. III, diSessa, A.A, & Roschelle, J. (1994). Misconceptions reconceived: A constructivist analysis of knowledge in transition. The Journal of the Learning Sciences, 3(2), 115–163.
Toulmin, S. (1999). Knowledge as shared procedures. In Y. Engeström, R. Miettinen & R.-L. Punamäki-Gitai (Eds.), Perspectives on activity theory (pp. 53–64). Cambridge: Cambridge University Press.
Turkle, S., & Papert, S. (1992). Epistemological pluralism and the revaluation of the concrete. The Journal of Mathematical Behavior, 11(1), 1–30.
Vossoughi, S., & Bevan, B. (2014). Making and tinkering: A review of the literature. National Research Council Committee on out of school time STEM. Washington, DC: National Research Council.
Werner, H. (1937). Process and achievement—A basic problem of education and developmental psychology. Harvard Educational Review, 7, 353–368.
Worsley, M. (2012). Multimodal learning analytics: Enabling the future of learning through multimodal data analysis and interfaces. In Proceedings of the 14th ACM international conference on Multimodal interaction (pp. 353–356).
Worsley, M., & Blikstein, P. (2013). Towards the development of multimodal action based assessment. In Proceedings of the third international conference on learning analytics and knowledge (pp. 94–101). New York: ACM. https://doi.org/10.1145/2460296.2460315.
Worsley, M., & Blikstein, P. (2014a). Analyzing engineering design through the lens of computation. Journal of Learning Analytics, 1(2), 151–186.
Worsley, M., & Blikstein, P. (2014b). Assessing the makers: The impact of principle-based reasoning on hands-on, project-based learning. Proceedings of the 2014 international conference of the learning sciences (ICLS), 3, 1147–1151.
Worsley, M., & Blikstein, P. (2017). Reasoning strategies in the context of engineering design with everyday materials. Journal of Pre-College Engineering Education, 6(2), 57–74.
Author information
Authors and Affiliations
Corresponding author
Rights and permissions
About this article

Cite this article
Worsley, M., Blikstein, P. A Multimodal Analysis of Making. Int J Artif Intell Educ 28, 385–419 (2018). https://doi.org/10.1007/s40593-017-0160-1
Published:
Issue Date:
DOI: https://doi.org/10.1007/s40593-017-0160-1