
Abstract
This article investigates the feasibility of using automated scoring methods to evaluate the quality of student-written essays. In 2012, Kaggle hosted an Automated Student Assessment Prize contest to find effective solutions to automated testing and grading. This article: a) analyzes the datasets from the contest – which contained hand-graded essays – to measure their suitability for developing competent automated grading tools; b) evaluates the potential for deep learning in automated essay scoring (AES) to produce sophisticated testing and grading algorithms; c) advocates for thorough and transparent performance reports on AES research, which will facilitate fairer comparisons among various AES systems and permit study replication; d) uses both deep neural networks and state-of-the-art NLP tools to predict finer-grained rubric scores, to illustrate how rubric scores are determined from a linguistic perspective, and to uncover important features of an effective rubric scoring model. This study’s findings first highlight the level of agreement that exists between two human raters for each rubric as captured in the investigated essay dataset, that is, 0.60 on average as measured by the quadratic weighted kappa (QWK). Only one related study has been found in the literature which also performed rubric score predictions through models trained on the same dataset. At best, the predictive models had an average agreement level (QWK) of 0.53 with the human raters, below the level of agreement among human raters. In contrast, this research’s findings report an average agreement level per rubric with the two human raters’ resolved scores of 0.72 (QWK), well beyond the agreement level between the two human raters. Further, the AES system proposed in this article predicts holistic essay scores through its predicted rubric scores and produces a QWK of 0.78, a competitive performance according to recent literature where cutting-edge AES tools generate agreement levels between 0.77 and 0.81, results computed as per the same procedure as in this article. This study’s AES system goes one step further toward interpretability and the provision of high-level explanations to justify the predicted holistic and rubric scores. It contends that predicting rubric scores is essential to automated essay scoring, because it reveals the reasoning behind AIED-based AES systems. Will building AIED accountability improve the trustworthiness of the formative feedback generated by AES? Will AIED-empowered AES systems thoroughly mimic, or even outperform, a competent human rater? Will such machine-grading systems be subjected to verification by human raters, thus paving the way for a human-in-the-loop assessment mechanism? Will trust in new generations of AES systems be improved with the addition of models that explain the inner workings of a deep learning black box? This study seeks to expand these horizons of AES to make the technique practical, explainable, and trustable.
Introduction
Recent advances in deep learning and natural language processing (NLP) have challenged automated testing and grading methods to improve their performance and to harness valuable hand-graded essay datasets – such as the free Automated Student Assessment Prize (ASAP) datasets – to accurately measure performance. Presently, reports about the performance of automated essay scoring (AES) systems commonly – and perhaps inadvertently – lack transparency. Such ambiguity in research outcomes of AES techniques hinders performance evaluations and comparative analyses of techniques. This article argues that AES research requires proper protocols to describe methodologies and to report outcomes. Additionally, the article reviews state-of-the-art AES systems assessed using ASAP’s seventh dataset to: a) underscore features that facilitate reasonable evaluation of AES performances; b) describe cutting-edge natural language processing tools, explaining the extent to which writing metrics can now capture and indicate performance; c) predict rubric scores using six different feature-based multi-layer perceptron deep neural network architectures and compare their performance; and d) assess the importance of the features present in each of the rubric scoring models.
The following section provides background information on the datasets used in this study that are also extensively exploited by the research community to train and evaluate AES systems. The third section synthesizes relevant literature about recent developments in AES, compares contemporary AES systems, and evaluates their features. The fourth section examines methodologies that support finer-grained rubric score prediction. The fifth and sixth sections explore the distribution of holistic and rubric scores, delineate the performance of naïve and “smart” deep/shallow neural network predictors, and discuss implications. The seventh section initiates a discussion on the linguistic aspects considered by the rubric scoring models and how each rubric scoring model differs from each other. Finally, the last section summarizes conclusions, highlights limitations, and discusses next stages of AES research.
Background: The Automated Student Assessment Prize
In 2012, the Hewlett-Packard Foundation funded an Automated Student Assessment Prize (ASAP) contest to evaluate both the progress of automated essay scoring and its readiness to be implemented across the United States in state-wide writing assessments (Shermis 2014). KaggleFootnote 1 collected eight essay datasets from state-wide assessments of student-written essays – which Grade 7 to Grade 10 students from six different states in the USA had written. Kaggle then subcontracted commercial vendors to grade the essays adhering to a thorough scoring process.
Each essay dataset originated from a single assessment for a specific grade (7–10) in a specific state. The ASAP contest asked participants to develop AES systems to automatically grade the essays in the database and report on the level of agreement between the machine grader and human graders, measured by the quadratic weighted kappa. This article argues that the performance comparison process was neither effective nor balanced since, as Table 1 demonstrates, each dataset had a unique underlying writing construct. Instead, AES performance should be analyzed per writing task instead of being analyzed globally.
Both commercial vendors and data scientists from academia participated in the contest. Officials determined the winners based on the average quadratic weighted kappa value on all eight essay datasets. While this measure was useful for contest purposes, it does not offer a transparent account of research processes and results. For instance, it has been shown that more interpretable and trustworthy models can be less accurate (Ribeiro et al. 2016). Following the publication of the contest results (Shermis 2014), Perelman (2013, 2014) warned against swift conclusions that AES could perform better than human graders simply because it surpassed the level of agreement among human graders. For example, Perelman (2013, 2014) illustrated how one could easily mislead an AES system by submitting meaningless text with a sufficiently large number of words.
The ASAP study design had several pitfalls. For example, none of the essay datasets had an articulated writing construct (Perelman 2013, 2014; Kumar et al. 2017) and only essays in datasets 1, 2, 7, and 8 truly tested the writing ability of students. Datasets 1, 2, and 8 had a mean number of words greater than 350 words, barely approaching typical lengths of high-school essays. Finally, only datasets 7 and 8 were hand-graded according to a set of four rubrics.
The eighth essay dataset (D8) stood out from others because 1) it did not suffer from a bias in the way holistic scores were resolved (Perelman 2013, 2014; Kumar et al. 2017), 2) it had the highest mean number of words (622), reflecting a more realistic essay length, 3) the holistic scores had the largest scoring scale computed out of a set of rubric scores (see Table 1), and 4) it had one of the lowest AES mean quadratic weighted kappa values (0.67). Accordingly, D8 seemed both challenging and promising for both machine learning and for providing formative feedback to students and teachers. However, a previous study (Boulanger and Kumar 2019) has shown that D8 was insufficient to train a model using feature-based deep learning and an accurate and generalizable AES model, because it had both an unbalanced distribution of holistic scores (high-quality essays were clearly under-represented) and a very small sample size (every holistic score and rubric score did not have enough samples to learn from). After the ASAP contest, only the labeled (holistic/rubric scores) training set was made available to the public; the labels of the validation and testing sets were no longer accessible. Thus, the essay sample totals currently available per dataset are less than the numbers listed in Table 1; only 722 essays of D8 were available to train an AES model. These limitations served as a key motivation for this study to target the seventh dataset (D7), which contained 1567 essay samples, despite its having only a mean number of words of about 171 words (about one paragraph). D7 was the only other available dataset that had essays graded following a grid of scoring rubrics. D7’s holistic scoring scale was 0–30 compared to D8’s 10–60, and D7’s rubric scoring scales were 0–3 compared to D8’s 1–6.
Table 2 (Shermis 2014) shows the level of agreement between the two human graders’ ratings and the resolved scores for all eight datasets. Each essay was scored by two human graders except for the second dataset where the final score was decided by only one human grader. For D7, the resolved rubric scores were computed by adding the human raters’ rubric scores.Footnote 2 Hence, each human rater gave a score between 0 and 3 for each rubric (Ideas, Organization, Style, and Conventions; see Table 3). Subsequently, the two scores were added together, yielding a rubric score between 0 and 6. Finally, the holistic score was determined according to the following formula: HS = R1 + R2 + R3 + (2 ∗ R4), for a score ranging from 0 to 30. All agreement levels are calculated using the quadratic weighted kappa (QWK). For each essay dataset, the mean quadratic weighted kappa value (AES mean) of the commercial vendors in 2012 is also reported.
D7’s writing assessment, intended for Grade-7 students, was of persuasive/narrative/expository type, and had the following prompt:
Write about patience. Being patient means that you are understanding and tolerant. A patient person experiences difficulties without complaining.
Do only one of the following: write a story about a time when you were patient OR write a story about a time when someone you know was patient OR write a story in your own way about patience.
Table 3 describes the rubric guidelines that were provided to the two human raters who graded each of the 1567 essays made available in the training set.
Related Work
This section provides detailed analysis of recent advances in automated essay scoring, by examining AES systems trained on ASAP’s datasets. Most of the published research measured and reported their performance as the level of agreement between the machine and human graders, expressed in terms of both the quadratic weighted kappa on ASAP’s D7 and the average agreement level on all eight datasets. Table 13 (see Appendix 1; due to the size of some tables in this article, they have been moved to appendices so they do not interrupt its flow) compares the various methods and parameters used to achieve the reported performances.
One of the most relevant research projects involved experimenting with an AES system based on string kernels (i.e., histogram intersection string kernel), v-Support Vector Regression (v-SVR), and word embeddings (i.e., bag of super-word embeddings) (Cozma et al. 2018). String kernels measure the similarity between strings by counting the number of common character n-grams. The AES models were trained on the ASAP essay datasets and tested both with and without transfer learning across essay datasets. Transfer learning stores knowledge learned in one task and applies it to another (similar) task, in which labeled data is not abundant.Footnote 3 Accordingly, the knowledge from the former task becomes the starting point for the model in the latter task.Footnote 4 The outcomes of this experiment are reported in Table 13.
A second, highly relevant study, using ASAP datasets, investigated how transfer learning could alleviate the need for big prompt-specific training datasets (Cummins et al. 2016). The proposed AES model consisted of both an essay rank prediction model and a holistic score prediction model. The AES model was trained based on the differences between the two essays, generating a difference vector. Accordingly, the model predicted which of the two essays had higher quality. Subsequently, a simple linear regression modeled the holistic scores using the ranking data. The process reduced the data requirements of AES systems and improved the performance of the proposed approach, which proved to be competitive.
Thirdly, the notable research from Mesgar and Strube (2018) effectively exhibited how deep learning could help with crafting complex writing indices, such as a neural local coherence model. Their architecture consisted of a convolutional neural network (CNN) layer at the top of a long short-term memory (LSTM) recurrent neural network (RNN). It leveraged word embeddings to derive sentence embeddings, which were inserted in the coherence model. The coherence model was designed to analyze the semantic flow between adjacent sentences in a text. A vector – which consisted of LSTM weights at a specific point in the sequence – modeled the evolving state of the semantics of a sentence at every word. The two most similar states in each pair of sentences were used to assess the coherence among them, and were given a value within 0 and 1, inclusively, where 1 indicated no semantic change and 0 a major change. The CNN layer extracted patterns of semantic changes that correlated with the final writing task.
A two-stage featured-based learning and raw text-based learning AES model was tested (Liu et al. 2019) and was found to be able to detect adversarial samples (i.e., essays with permuted sentences, prompt-irrelevant essays). Literature (Perelman 2013, 2014) identifies such samples as a major weakness of AES. In the first stage, three distinct LSTM recurrent neural networks were employed to a) assess the semantics of a text independent of the essay prompt (e.g., through sentence embeddings), b) estimate coherence scores (to detect permutated paragraphs), and c) estimate prompt-relevant scores (to detect when an essay complies with prompt requirements). These three scores along with spelling and grammatical features were input in the second learning stage to predict the final score of the essay.
Another study examined the data constraints related to the deployment of a large-scale AES system (Dronen et al. 2015). Three optimal design algorithms were tested: Fedorov with D-optimality, Kennard-Stone, and K-means. Each optimal design algorithm recommended which student-written essays should be scored by a human or machine (a noteworthy example of the separation of duties among human and AI agents (Abbass 2019)). However, a few hundred essays were required to bootstrap these optimal design algorithms. The goal was to minimize the teacher’s workload, while maximizing the information needed from the human grader to improve accuracy. The three optimal design algorithms were evaluated using ASAP’s eight datasets. Each essay was transformed into a 28-feature vector based on mechanics, grammar, lexical sophistication, and style, and extracted by the Intelligent Essay Assessor. The AES system also leveraged a regularized regression model (Ridge regression) to predict essays’ holistic scores. The Fedorov exchange algorithm with D-optimality delivered the best results. Studies show that for certain datasets, training a model with 30–50 carefully selected essays “yielded approximately the same performance as a model trained with hundreds of essays” (Dronen et al. 2015). Results were reported in terms of Pearson correlation coefficients between the machine and human scores. However, correlation coefficients were not provided for all ASAP essay datasets! For instance, the correlation coefficient for D7 was not included in the report.
A feature-based AES system called SAGE was designed and tested using several machine learning architectures such as linear regression, regression trees, neural network, random forest, and extremely randomized trees (Zupanc and Bosnić 2017). SAGE was unique in that it incorporated, for the first time, 29 semantic coherence and 3 consistency metrics, in addition to 72 linguistic and content metrics. Interestingly, SAGE appears to have been tested using the original labeled ASAP testing sets made available during the 2012 ASAP contest. Unfortunately, those testing sets are no longer available. Hence, most research on AES simply report their performance on the training sets, which may prevent a fair comparison of performance and technique against reports by Zupanc and Bosnić (2017). Nevertheless, SAGE distinguishes itself from other systems because it undertook a deeper analysis at the rubric level for the eighth ASAP dataset investigating D8’s second rubric ‘Organization’. SAGE’s capacity to both predict the Organization rubric, which will be discussed later in this article, and to leverage metrics related to semantic coherence are of special interest.
Automated essay scoring (AES) comprises few but highly distinct areas of exploration, and significant advances in deep learning have renewed interests in pushing the frontiers of AES. Table 13 shows that most publication years range between 2016 and 2019. The table highlights the latest research endeavors in AES, including respective algorithms. All models were trained on the ASAP’s datasets. As mentioned above, this article investigates the underpinnings of AES systems on ASAP’s seventh dataset. Accordingly, it reports both the performance of these models on that dataset and their average performance on all eight datasets. Table 13 shows that Zupanc and Bosnić (2017) reached the highest performance, i.e. a quadratic weighted kappa of 0.881 on the seventh dataset. However, note that they seemingly had access to the original labeled testing sets that were available during the 2012 ASAP competition, which should be factored in efforts to compare their performances against other models.
Literature is scarce when it comes to measuring the level of agreement between the machine and the human graders at the rubric score level (Jankowska et al. 2018). A synthesis of rubric level comparison is presented in the Discussion section below. This research investigates the prediction of rubric scores of ASAP’s D7 rubrics by applying deep learning techniques on a vast range of writing features.
Methodology
Natural Language Processing
The essay samples (1567) were processed by the Suite of Automatic Linguistic Analysis Tools (SALAT)Footnote 5 – GAMET, SEANCE, TAACO, TAALED, TAALES, and TAASSC. Each essay was subjected to a total of 1592 writing features. This study opted for maximizing the number of low-level writing features, and the optimal selection of features for the AES model was performed by a deep learning mechanism in an automated fashion. The commercial AES system called Revision Assistant, developed by Turnitin, demonstrated that automatically selected features are not less interpretable than those engineered by experts (West-Smith et al. 2018; Woods et al. 2017). The following subsections describe the individual SALAT tools and the writing indices they measure, while the Analysis subsection will describe how these tools have been applied.
Grammar and Mechanics Error Tool (GAMET)
GAMET is an extension of the LanguageTool (version 3.2) API that measures structural and mechanical errors. LanguageTool has been demonstrated to have high precision but low recall (e.g., poor recognition of punctuation errors). It can flag a subset of 324 spelling, style, and grammar errors (Crossley et al. 2019a) and classify them into six macrofeatures listed below:
-
Grammar: errors related to verb, noun, adjective, adverb, connector, negation, and fragment.
-
Spelling: deviations from conventional dictionary spellings of words.
-
Style: wordiness, redundancy, word choice, etc.
-
Typography: capitalization errors, missing commas and possessive apostrophes, punctuation errors, etc.
-
White space: inappropriate spacing such as unneeded space (e.g., before punctuation) or missing space.
-
Duplication: word duplications (e.g., You you have eaten this banana.).
For analysis purposes, these macrofeatures are more efficient than individual microfeatures. Literature shows that automated assessment of spelling accuracy had a higher correlation with human judgments of essay quality than grammatical accuracy, possibly due to certain interference that mechanical errors might have over meaning, and because grammatical errors were weakly associated with writing quality (less than 0.15) (Crossley et al. 2019a).
Sentiment Analysis and Cognition Engine (SEANCE)
SEANCE is a sentiment analysis tool that calculates more than 3000 indices relying on third-party dictionaries (e.g., SenticNet, EmoLex, GALC, Lasswell, VADER, General Inquirer, etc.) and part-of-speech (POS) tagging, component scores (macrofeatures), and negation rules.
This study configured SEANCE to include only word vectors from the General Inquirer, which encompasses over 11,000 words organized into 17 semantic categories: semantic dimensions, pleasure, overstatements, institutions, roles, social categories, references to places and objects, communication, motivation, cognition, pronouns, assent and negation, and verb and adjective types.
Since most essays in ASAP’s D7 are not high-quality writings, this study only used the writing indices that were independent of POS. SEANCE includes a smaller set of 20 macrofeatures that combine similar indices from the full set of indices, which were derived by conducting a principal component analysis on a movie review corpus. For more information, please consult Crossley et al. (2017).
Tool for the Automatic Analysis of Cohesion (TAACO)
TAACO (Crossley et al. 2016, 2019b) provides a set of over 150 indices related to local, global, and overall text cohesion. Texts are first lemmatized and grouped per sentence and paragraph before TAACO employs a part-of-speech tagger and synonym sets from the WordNet lexical database to compute cohesion metrics.
TAACO’s indices can be grouped into five categories: connectives, givenness, type-token ratio, lexical overlap, and semantic overlap. Lexical overlap measures the level of local and global cohesion between adjacent sentences and paragraphs. The overlap between sentences or paragraphs is estimated by considering lemmas, content word lemmas, and the lemmas of nouns and pronouns. TAACO not only counts how many sentences or paragraphs overlap, but also assesses how much they overlap. Like lexical overlap, TAACO estimates the degree of semantic overlap between sentences and paragraphs.
TAACO assesses the amount of information that can be recovered from previous sentences, called givenness, and computes counts of various types of pronouns (i.e., first/second/third person pronouns, subject pronouns, quantity pronouns). It calculates the ratio of nouns to pronouns, the numbers of definite articles and demonstratives, and the number and ratio of unique content word lemmas throughout the text. Moreover, TAACO measures the repetition of words and provides indices to measure local cohesion through connectives.
Tool for the Automatic Analysis of Lexical Diversity (TAALED)
TAALED calculates 38 indices of lexical diversity. At the basic level, TAALED counts the number of tokens, the number of unique tokens, the number of tokens that are content words, the number of unique content words, the number of tokens that are function words, and the number of unique function words (6 metrics). Subsequently, it calculates features of lexical diversity and lexical density (Johansson 2009).
Lexical diversity metrics include simple, square root, and log type-token ratios (TTR) calculated on the sets of all words, content words, and function words (9 metrics). Lexical density metrics calculate the percentage of content words and the ratio of the number of unique content words over the number of unique tokens (2 metrics).
More complex variants of TTR are provided by TAALED such as the Maas index, which linearizes the TTR curve using log transformation (Fergadiotis et al. 2015) (3 metrics); the mean segmental TTR with 50 segments (MSTTR50) (3 metrics); and the more effective moving average TTR with window size of 50 (MATTR50) (Covington and McFall 2010) (3 metrics). These variants are all computed in relation to the sets of all words, content words, and function words.
Still more advanced metrics include the hypergeometric distribution’s D index (HD-D 42), which calculates the probability of drawing from the text a certain number of tokens of a particular type from a random sample of 42 tokens (McCarthy and Jarvis 2010; Torruella and Capsada 2013) (3 metrics).
Finally, TAALED’s features include the original measure of textual lexical diversity (MTLD), which “is calculated as the mean length of sequential word strings in a text that maintain a given TTR value” (McCarthy and Jarvis 2010), along with two of its variants, the bidirectional moving average (MTLD-MA-BI) and the wrapping moving average (MTLD-MA-Wrap) (9 metrics).
Tool for the Automatic Analysis of Lexical Sophistication (TAALES)
TAALES (Kyle et al. 2018) measures over 400 indices of lexical sophistication related to word and n-gram frequency and range, academic language, psycholinguistic word information, n-gram strength of association, contextual distinctiveness, word recognition norms, semantic network, and word neighbors. Several of these metrics are normed such as word and n-gram frequency and range metrics, which are measured according to the number of word or n-gram occurrences found in large corpora of English writings (i.e., Corpus of Contemporary American English (COCA), British National Corpus (BNC), and Hyperspace Analogue to Language (HAL) corpus) and frequency lists (i.e., Brown, Kucera-Francis, SUBTLEXus, and Thorndike-Lorge). These 268 frequency and range metrics are calculated according to five domains of literature: academic, fiction, magazine, news, and spoken. These metrics allow one to measure the number of times a word or n-gram occurs in a corpus and the number of texts in which it is found.
Fifteen academic language metrics measure the proportions of words or phrases in a text that are frequently found in academic contexts but are less generally used in mainstream language. Using the MRC database (Coltheart 1981), psycholinguistic word information (14 metrics) gauges concreteness, familiarity, meaningfulness, and age of acquisition observed in the text.
Further, age of exposure/acquisition values (7 metrics) are derived from the set of words in the Touchstone Applied Science Associates (TASA) corpus, which consists of 13 grade-level textbooks from USA. This makes it possible to measure the complexity of the words employed within a text and their links to semantic concepts as found in larger corpora.
Word recognition norms (8 metrics) make it possible to estimate the difficulty of processing a given word, such as, the time it takes a person to recognize that a specific word is an English word and the time it takes to read the word aloud. These word recognition scores have been calculated on a bank of 40,481 real words from the English Lexical Project, which includes the response latencies, standard deviations, and accuracies of 816 native English speakers on lexical-decision and word-naming tasks.
Word neighborhood indices (14 metrics) report the similarity of a word in a text to other similar orthographic (words that are formed by changing just one letter), phonographic (words that differ by one letter and one phoneme), and phonological words (words that differ by only one phoneme).
TAALES includes 8 metrics related to contextual distinctiveness, based on the diversity of contexts in which a word occurs. It evaluates how much the words in a text are contextually distinct using free association norms and corpus-driven statistical approaches based on the Edinburgh Associative Thesaurus and the University of South Florida norms.
TAALES provides information (14 metrics) using the WordNet lexical database on the polysemy and hypernymy semantic networks of a word making it possible to measure the number of related senses and the number of superordinate terms that the word has.
TAALES assesses the strength of association within n-grams by computing the conditional probability that the words in bigrams and trigrams in a specific text will occur together based on the n-gram frequency norms derived from large corpora (75 metrics).
Tool for the Automatic Assessment of Syntactic Sophistication and Complexity (TAASSC)
TAASSC (Kyle 2016) quantitatively evaluates the syntactic sophistication and complexity of English writing. It calculates 367 indices, grouped into four categories: 14 Syntactic Complexity Analysis (SCA) indices (Lu 2010), 31 fine-grained indices on clausal complexity, 132 indices related to fine-grained phrasal complexity, and 190 syntactic sophistication indices.
Basically, the 14 SCA indices are derived from the counts, ratios, and mean lengths of the following syntactic structures within a text: words, verb phrases, complex nominals, coordinate phrases, clauses, dependent clauses, T-units, complex T-units, and sentences. Table 4 provides some definitions of these structures.
TAASSC enhances the previous SCA set of indices by adding 31 new clausal complexity indices, obtained by calculating the average number of every type of structure per clause. In other words, TAASSC measures the length of clauses as the number of direct dependents rather than words; it also provides separate counts of each type of structure instead of combining them all; and, finally, it considers clauses as being both finite and non-finite. See (Kyle 2016) for the complete list of clausal dependent types.
TAASSC computes 132 indices of phrasal complexity by identifying seven types of noun phrases and 10 types of phrasal dependents.
Finally, TAASSC supplies 15 basic indices related to syntactic sophistication established on the empirical theories of language acquisition through reference corpora such as the British National Corpus (BNC) and the Corpus of Contemporary American English (COCA). Each index has 38 variants derived from the five COCA subcorpora (academic, fiction, magazine, newspaper, and spoken), for a total of 190 indices.
How the Tools Were Applied
This articleFootnote 6 revises the methodology adopted in the previous work (Boulanger and Kumar 2019) to predict rubric scores using feature-based deep learning (multi-layer perceptron (MLP) neural network) and proposes a way to explain the reasons that typically hide behind the deep learning algorithm. As mentioned in the the Background section, Boulanger and Kumar trained an AES model that scored D8’s essays with a feature-based approach, rather than training a sequence model such as a LSTM (long short-term memory) recurrent neural network using the raw text data. In addition to the inadequate sample size of D8, their study had one major limitation: feature selection. Ninety-six (96) writing features that most correlated with the holistic scores were selected to predict all four rubrics (Ideas and Content, Organization, Sentence Fluency, Conventions) of the D8 writing assessment. In other words, unique writing features should have been identified for each of the four rubrics instead of re-using the same feature set for all four of them. The study also assesses feature importance per rubric.
The first step in the analysis was to look into D7’s distributions of holistic and rubric scores and evaluate the number of essay samples per rubric score. The analysis continues by quantitatively measuring the interrelationships between the underlying rubrics. Next, the analysis establishes a baseline naïve predictor to precisely measure and compare the performance of various deep neural network architectures.
The second step designs and applies a feature selection process for each of the four rubrics. There are three types of feature selection methods: filter (use statistical method to determine which features should be pruned), wrapper (an external predictive model is trained to evaluate the impact of different combinations of features on model accuracy), and embedded (feature selection occurs as the model is trained through regularization methods).Footnote 7 This study applies both the filter and embedded methods. First, feature data were normalized, and features with variances lower than 0.01 were pruned. Second, the last feature of any pair of features having an absolute Pearson correlation coefficient greater than 0.9 was pruned (the one that comes last in terms of the column ordering in the datasets).Footnote 8 This second operation was performed individually on the feature set of each SALAT’s tool to ensure fair representation among grammar and mechanics, sentiment analysis and cognition, text cohesion, lexical diversity, lexical sophistication, and syntactic sophistication and complexity. Third, any feature that directly counted the number of words or tokens in the essays was also pruned to reduce the rubric scoring models’ dependencies on the very influential counts of words (Perelman 2013, 2014). After the application of these filter methods, the number of features was reduced from 1592 to 397. All four rubric models fed upon these 397 features. Fourth and finally, the Lasso (Fonti and Belitser 2017) and Ridge regression regularization methods (whose combination is also called ElasticNet) were applied as part of the rubric scoring models’ training. Lasso is responsible for pruning further features, while Ridge regression is entrusted with eliminating multicollinearity among features. This final phase of feature selection allowed for the customized feature selection per rubric.
In the third step, six deep learning (MLP) architectures were tested. It is important to indicate that seven of the most important hyperparameters were tuned to find a quasi-optimal combination. They are 1) activation function (selu, elu, relu, tanh, sigmoid, exponential), 2) optimizer (Adam, SGD, Adadelta, Adamax, Nadam), 3) L1 penalties (10 equally distributed values between 0.0035 and 0.0125), 4) L2 penalties (10 equally distributed values between 0.0035 and 0.0125), 5) number of hidden layers (2, 3, 4, 5), 6) number of neurons in the first hidden layer (128, 256), and 7) number of neurons in the last hidden layer (16, 32). This hyperparameter space encompasses 48,000 different combinations. A randomized search consisting of 200 randomly sampled combinations of hyperparameters was tested for each of the six architectures. Table 5 delineates the final hyperparameters of the six architectures. Only three architectures are shown in Table 5, each of them being used again as part of a bagging ensemble technique. Interestingly, all three architectures have only two hidden layers, below a recommended threshold of three to be considered “deep” learning (Rosebrock 2017). More hyperparameters, larger ranges of and finer-grained hyperparameter values, and a larger number of hyperparameter combinations should have been tested to learn better model parameters. The smaller sample size and hyperparameter space are a limitation of this study due to a lack of high-performance computing resources (HPC). As a follow-up study, we plan to re-design and re-run the analysis when the HPC resources are secured.
Finally, the last step estimates feature importance for each of the trained rubric scoring models. A technique called permutation importance (Breiman 2001) randomizes the values of a feature in the testing set multiple times, one feature at a time, measures the average change (called the weight) in the model’s predictive power (e.g., percentage of accurate predictions), and ranks features by weight in descending order. Rubric score predictions are presented in confusion matrices, and corresponding precision, recall, and F1-score values are reported. However, only one set of hyperparameter values has been optimized per deep learning architecture. Hence, all four rubric scoring models pertaining to each architecture have been trained with the same set of hyperparameter values. This is another limitation that we aim to address in the follow-up study.
Results
This study investigated both the feasibility and benefits of applying automated essay scoring at the rubric level. Rubric scores provide high-level formative feedback that are useful to both student-writers and teachers. Most of the literature in this domain focuses almost exclusively on predicting holistic scores. This article goes one step further by analyzing the performance of deep/shallow learning on rubric score prediction and by investigating the most important writing indices that determine those rubric scores.
The first step in the process is to know the dataset that will train the rubric scoring models. Figure 1 shows the distribution of D7’s holistic scores. Note that the scoring scale is from 0 to 24.Footnote 9 The distribution of holistic scores appears quite balanced from score 6 up to 24. Very few or no essays have been assigned a final score lower than 6, which is reasonable. The most frequently given scores are 16 (199 times) and 17 (160 times); other scores’ frequencies are relatively uniform (between 20 and 118), allowing an AES system to learn from high-quality, average, and low-quality essays.
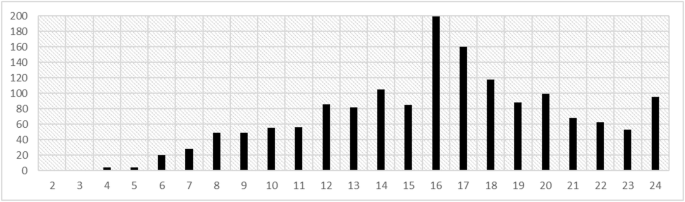
Distribution of holistic scores
The human raters’ distributions of scores, all rubrics combined (R1 + R2 + R3 + R4), are exhibited in Fig. 2. The figure highlights the raters’ biases. According to Table 2, their agreement level, measured by QWK, is 0.72.
Distributions of human raters’ scores (all rubrics combined)
Additionally, to take advantage of this unique hand-graded set of essays, this article was motivated by the idea that holistic scores could be better predicted through the prediction of its constituent rubric scores. The rationale for that is simple. In the best case, if the distribution of holistic scores was uniform, there would be about 1567/25 ≈ 62 examples per score, which is not much to teach all the intricacies of English writing. On the other side, the scale of rubric scores ranges from 0 to 6, implying that in the best case there would be 1567/7 ≈ 223 essays per rubric score, which means more essays from which to assess a narrower competence of English writing. However, it is beyond the scope of this single study to verify whether the prediction of holistic scores is more accurate through the prediction of its constituent rubric scores, especially given that less accurate models may as well be more interpretable (Ribeiro et al. 2016) and that predictive accuracy alone is not the only criterion to determine the trustworthiness of an AES system (Murdoch et al. 2019). Figure 3 exhibits the distributions of scores by rubric, while Table 6 presents their descriptive statistics.
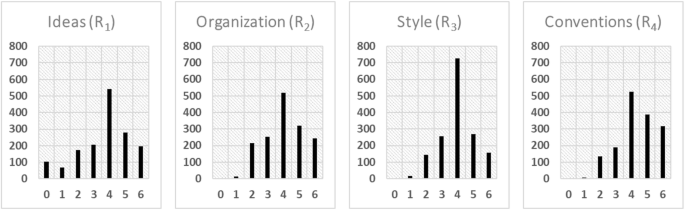
Distributions of rubric scores
Table 7 shows the level of agreement among rubrics, measured by both the quadratic weighted kappa and the average agreement level per rubric. Note from Fig. 3 and Table 6 that each rubric’s most frequent score is 4. Table 7 also indicates that the rubrics generally have moderate-strong levels of agreement, suggesting that an AES system could naively predict 4 as the rubric score for each rubric and a holistic score of 16 as per the formula: HS = R1 + R2 + R3 + R4.
The performance of this naïve AES system (also known as majority classifier) is delineated in Table 8. Four metrics are used throughout this article to measure the performance of an AES model. They are, a) the quadratic weighted kappa; b) the percentage of exact predictions; c) the percentage of exact and adjacent (±1) predictions (simply denoted by “adjacent (±1)” from now on); and d) the percentage of exact, adjacent (±1), and adjacent (±2) predictions (simply denoted by “adjacent (±2)” from now on).
The quadratic weighted kappa measures the level of agreement between two raters by controlling for random guessing and by heavily penalizing higher distances (squared) between pairs of ratings. The weighted kappa normalizes weight assignment based on the agreement scale and ranges between 0 and 1. For example, holistic scores are predicted on a 0–24 scale, while rubric scores lie between 0 and 6. Hence, the penalty (weight) assigned to a predicted holistic score that is ‘off by 2’ will be less than the penalty assigned to a predicted rubric score that is ‘off by 2’.
Percentage of exact matches measures the accuracy of the AES model in terms of percentages of correct predictions in contrast to all other predictions that are wrong no matter their distance from the expected value. Percentages of adjacent matches indicate the numbers of predictions that fall within a certain distance of the expected value. This study considers distances of one and two.
Both supervised classification and regression techniques have been leveraged to model rubric scores. Table 9 reports the performance of six distinct deep learning MLP architectures that are trained, validated, and tested on ASAP’s seventh dataset. Each essay was converted to a vector of 397 writing features. The 1567 essays have been randomly split into a training and testing set, that is, 80% of the essays formed the training set (1254), while the remaining 20% formed the testing set (313). Although validation results are not reported in this article, 15% of the training set was used as a validation set to drive model training toward better accuracy (except in ensemble-based models). A 5-fold cross-validation was performed for each ensemble-based architecture, implying that the training set was randomly split into a smaller training dataset (80% = 1003 essays) and a validation set (20% = 251 essays). Following recommendations from the literature (Boulanger and Kumar 2019; Cozma et al. 2018; Taghipour and Ng 2016), model performance was reported on the testing set as an average of several testing iterations (various samplings) instead of choosing the “highest kappa” produced, to avoid overfitting the AES models to the testing set. Hence, each architecture has been trained and evaluated five times and the resulting performance measurements were averaged. Table 9 reports the average performance of each architecture for each rubric.
The first architecture called “Classification” selects the most likely rubric score among a set of seven discrete scores between 0 and 6. The second architecture called “Classification Ensemble” leverages a bagging ensemble technique. Essentially, each model trained per fold during cross-validation makes up a machine grader. Thus, five machine graders with distinct “expertise” determine the predicted score by averaging their assessed score (alternatively it could be determined through vote by selecting the most frequent score (mode) or using the median score). The third architecture “Regression” is similar to “Classification”. However, instead of selecting the most likely score on a scale of seven discrete scores, it computes a single real-number score (e.g., 4.3333) and rounds it to the nearest integer, truncating it to 0 or 6 if the real number falls short or exceeds the scale. The fourth architecture is identical to “Classification Ensemble”. However, it employs regression instead of classification. The fifth architecture (Multiple Regression), as Table 7 shows, considers the interdependencies among rubrics that underlie the determination of the holistic score. Thus, instead of predicting a single rubric score using a siloed approach, this approach predicts all four rubric scores all at once. Subsequently, the agreement level between the machine and the human graders is analyzed and reported per rubric. Finally, the sixth architecture “Multiple Regression Ensemble” employs an ensemble technique on top of the fifth architecture to predict rubric scores.
Given that on average classifiers have higher accuracy in terms of percentage of exact matches (the most important metric), their performance was investigated further. Figure 4 shows the normalized confusion matrix of each rubric along with the precision, recall, and F1-score of each rubric score. Note that precision is the ratio of essays within a rubric score category that were rightfully assigned the score of the category. Conversely, recall is the ratio of essays that were assigned to a specific rubric score by the human and that were also correctly predicted by the machine. The F1-score is the harmonic mean of the precision and recall. Note that precision and recall do not consider how much a prediction is off the expected value (the QWK does). For example, Fig. 4 demonstrates that 25% of all essays were given a 4 for Ideas Rubric by both the human graders and the machine grader (accurate predictions). By adding up the ratios along the diagonal, it is possible to calculate the percentage of exact matches. Hence, for Ideas Rubric, the percentage of exact matches is 0.05 + 0.06 + 0.25 + 0.04 + 0.05 = 0.45 (45%); for Organization Rubric, it is 0.08 + 0.02 + 0.23 + 0.05 + 0.07 = 0.45 (45%); Style Rubric, 0.05 + 0.04 + 0.37 + 0.04 + 0.05 = 55%; Conventions Rubric, 0.05 + 0.03 + 0.21 + 0.11 + 0.10 = 50%. Note that these are close to the exact percentages in Table 9 under the Classification heading (Ideas Rubric: 45.1%, Organization Rubric: 47.1%, Style Rubric: 54.3%, Conventions Rubric: 47.8%). They are slightly different because the confusion matrices were derived from a single classifier per rubric instead of being averaged (over five iterations). Similarly, adjacent matches (±1) are calculated by adding the ratios along the diagonal plus the ratios that are directly above and below each diagonal element.
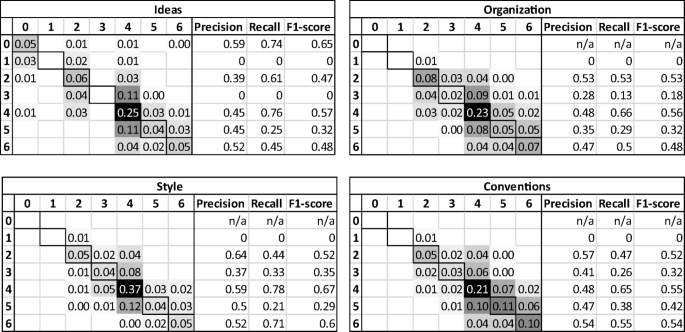
Normalized confusion matrices and classification reports for all rubrics (classifier). Human and machine scores are represented by the vertical and horizontal axes, respectively
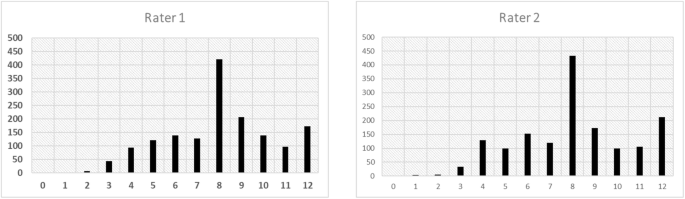
Figure 5 shows the normalized confusion matrix of each rubric between the two human graders for comparison with those of the machine grader. Notice how the rubric score scales vary between Figs. 4 and 5. The machine grader predicts rubric scores on a 0–6 scale, the scale of resolved rubric scores derived by adding the two human raters’ rubric scores which were originally on a 0–3 scale. Thus, the resolved scores are used to benchmark the performance of the machine marker, as depicted in Fig. 4. Once the performance of the machine marker is measured, it is important to compare it against human performance to determine whether the AES system can minimally meet human expectations. Hence, measuring human performance implies assessing the level of agreement between human raters, which in this case can only be measured by comparing the two human raters’ rubric scores on the 0–3 scale, creating a scale discrepancy between machine and human performances.
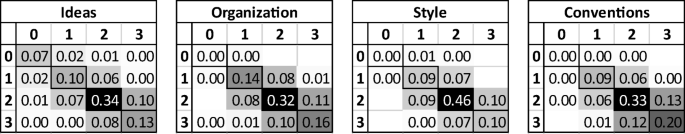
Confusion matrices for all rubrics between the two human raters. Rater 1 and Rater 2 are represented by the vertical and horizontal axes, respectively
Finally, to assess the role that each writing feature played in the essay scoring per rubric, a method called permutation importance was run. It estimates the impact that randomizing the values of a single feature in the testing set has on the accuracy of the trained model (classifier), while keeping all other feature values intact. Five randomized permutations are performed and the average impact on the percentage of exact matches along with the standard deviation are reported for the selected feature. The process is repeated for all writing features selected for training. Finally, the writing features are listed in order of importance. Tables 14 and 15 (see Appendix 2) delineate the 20 most important writing features by rubric. For example, the ‘you_gi’ feature (Rank 1) in Table 14 has a weight of 2.10% and a standard deviation of 0.25% (the weight will tend to vary by 0.25% depending on the selected permutation). This means that on average, the accuracy of the rubric scoring model in terms of exact matches drops by 2.10% when this piece of information is unknown. According to Table 9, the accuracy of the ‘Classification’ architecture for Ideas Rubric is 45.1% (exact matches). Thus, dropping the feature will result in a model with a lower accuracy, that is, approximately 43.0%.
The next table (Table 16; see Appendix 2) shows by order of importance, all rubrics combined, the writing features that influenced the determination of essays’ holistic scores the most. The ‘Avg. Weight’ column indicates by how much each writing feature on average improves each rubric scoring model’s accuracy. The ‘Avg. Std. Dev.’ column is the average level of uncertainty (standard deviation) about the improvement that each feature brings to the four rubric scoring models. Table 16 identifies which writing features are of global importance to all four rubrics. By comparing every rubric’s list of most important features (Tables 14 and 15) against Table 16, it is also possible to determine which features are of local importance to a specific rubric.
Discussion: Performance of Linguistic Indices-Based Deep Learning
The four rubric score distributions in Fig. 3 look relatively like each other, with their means ranging from 3.68 to 4.34 and their standard deviations from 1.10 to 1.62. Nevertheless, they all show that the most frequent score for all rubrics is 4. Table 7 shows that the rubric scores are moderately-strongly dependent on each other. The quadratic weighted kappa values all range from 0.46 to 0.79. Ideas Rubric scores on average agree at 0.62 with the other rubrics, Organization Rubric on average agrees at 0.73, Style Rubric at 0.69, and Conventions Rubric has the lowest average agreement level at 0.60. The following adjacent pairs of rubrics have strong levels of agreement: Ideas-Organization, Organization-Style, and Style-Conventions. In contrast, the non-adjacent Ideas-Conventions pair shows the weakest agreement. This implies a partial overlap but also a progression among the rubrics.
Table 8 reveals from the distributions of rubric scores that 34.5% of scores in the Ideas rubric are given a 4, 33.1% of scores in the Organization rubric are also assigned a 4, 46.3% for the Style rubric, and 33.6% for the Conventions rubric. Thus, assigning systematically a 4 to all rubrics would “predict” on average accurate scores 36.9% of the time. Similarly, giving 4 as scores to all rubrics as well as all essays would result in 65.5% of adjacent (±1) matches for Ideas Rubric, 69.8% for Organization Rubric, 79.7% for Style Rubric, and 70.3% for Conventions Rubric, equating to an average of 71.3%. This certainly is an “awesome” performance for a completely naïve AES model. Interestingly, the quadratic weighted kappa metric proves to be an effective indicator to detect random guessing as shown by the zeroes in every rubric. The fact that every predicted score is always 4 on the 0–6 scale while the resolved scores significantly vary on the same scale exhibits some gaming behavior that the QWK formula can detect. To be relevant, performance of an autonomous (or a human-in-the-loop) AES system should significantly exceed the baseline model.
By aggregating and selecting the best performance by rubric on the testing set, all architectures combined, as demonstrated in Table 10, it can be observed that the QWKs lie between 0.69 and 0.77. The average QWK of the four rubrics is equal to the level of agreement on holistic scores between the two human raters (0.72) and close to the 2012 commercial vendors’ mean agreement level (0.76) (see Table 2). This is remarkable because 1) the models were trained, validated, and tested with a smaller essay dataset, that is, the equivalent of the original training dataset, and 2) smaller rubric score scales tend to produce lower QWKs than larger scales such as the holistic score scale (0–24 for D7), the scale of the performances reported in Table 2 (Perelman 2013).
Table 10 presents the agreement level between the two human raters at the rubric level. Notice that the original rubric scores given by the human raters were on a 0–3 scale. It can be seen from Table 10 that AES rubric models have a mean agreement level of 0.72 with the resolved scores, which is significantly greater than the mean agreement level between the two human raters (0.60). Nevertheless, as aforementioned, the human raters’ scoring scale is smaller than the scale of resolved scores, the prediction scale of the machine marker, producing smaller QWKs as agreement levels between the human raters are measured. Since the difference of performance between the machine marker and the human markers is quite large, it is very likely that the accuracy of the trained rubric scoring models is equivalent if not superior to human performance, even when controlling for this scale discrepancy.
This study’s best exact match percentages range between 45.6% and 55.4%, a 9.1–19.5% improvement in comparison to the majority classifiers previously discussed. The least accurate rubric is the Ideas rubric, which intuitively requires more background knowledge than the other rubrics. On average 89–96% of the predicted rubric scores are adjacent (±1) matches, compared to 65–80% for the naïve predictor. In other words, on average 50.6% of rubric scores are exact, 42.2% are off by 1, 6.7% are off by 2, and 0.5% are off by 3 or more.
Table 11 summarizes the information from the confusion matrices in Figs. 4 and 5. On average the human raters assigned identical rubric scores and adjacent (±1) scores 63% and 99% of the time, respectively. On the other side, the machine marker’s predictions on average are exact, adjacent (±1), and adjacent (±2) 49%, 88%, and 99% of the time, respectively. The fact that the scale of resolved scores is almost twice as large as the human raters’ rubric score scale can justify the fact that the machine marker’s percentages of exact matches are smaller than its human counterpart. This can provide extra evidence that the machine marker is almost or as accurate as the human markers. For instance, the machine marker is 45% accurate on Ideas Rubric, and 85 % − 45 % = 40% of predictions are off by one. If the predicted rubric scores are rescaled on a 0–3 scale, approximately half of this 40% of predicted scores, that are off by one on Ideas Rubric, would be rounded toward their rescaled resolved score and the other half would be rounded away from their rescaled resolved score. The percentage of exact matches would then reach approximately 45 % + (0.5 × 40%) = 65%, and the percentage of rescaled adjacent (±1) scores would be close to 100%. Note that this calculation is made on the machine marker’s performance on the Ideas rubric, which is the most faraway, among the four rubrics, from the human raters’ one.
To the best of our knowledge, only one study attempted to predict rubric scores using D7 (Jankowska et al. 2018), only one study investigated rubric score prediction on D8 (Zupanc and Bosnić 2017), and very few AES systems in general predict essay scores at the rubric level (Kumar et al. 2017). Zupanc and Bosnić (2017) reported an agreement level (QWK) of 0.70 on Organization Rubric (D8). Their feature-based AES model included 29 coherence metrics, which greatly contributed to the observed performance (alone these coherence metrics achieved a QWK of 0.60).
Similarly, Jankowska et al. (2018) trained an AES system on D7 using Common N-Gram, Support Vector Machines, and Naïve Bayes classifiers. The 13 feature sets used to train the various classifiers consisted of character n-grams, with n ∈ {1, 2, 3, …, 10}, and word and stemmed word n-grams of length 1 and 2. Rubric scores were predicted on the 0–3 scale, the scale of human raters, and two machine markers were trained per rubric, one by human rater. Table 12 reports the best agreement levels between each machine marker and its corresponding human rater and between the two human raters (Jankowska et al. 2018). It is interesting to observe that the typical agreement level on holistic scores reported in the literature (between 0.76 and 0.88; see Tables 2 and 13) did not translate into as high agreement levels on rubric scores (between 0.428 and 0.657). The agreement levels on rubric scores between the two human raters (between 0.544 and 0.695) were also smaller than their agreement level on holistic scores (0.72; see Table 2). The exception is the Ideas rubric: the feature sets were likely more suited to the scoring of this rubric than to the other rubrics, which are more concerned with how ideas are formulated.
It can also be observed that this study’s models (Table 10) on average outperform results reported by Jankowska et al., although this study’s prediction scale is larger (0–6 instead of 0–3). Tables 10 and 12 reveal that the mean agreement level (QWK) between the two human raters is 0.60, averaged over all four rubrics. Jankowska et al.’s rubric scoring models at best had an average agreement level (QWK) of 0.531 with the human raters, below the human raters’ agreement level. In contrast, this study reports a mean agreement level with the human raters’ resolved scores of 0.72, well beyond the agreement level between the two human raters.
To evaluate whether the parallel prediction of the four rubrics could accurately predict and explain essay holistic scores, this study predicted holistic scores as the sum of the rubric score predictions. It was found that 1) the agreement level with the human raters’ resolved scores, as measured by QWK, was 0.785; 2) 17.2% of holistic score predictions were accurate; 3) 46.1% were adjacent ( ± 1); and 4) 64.0% were adjacent (±2). Remember that holistic scores range from 0 to 24 and that these performance indicators were averaged over five iterations to avoid reporting some overfit performance.
The rubric-based AES system proposed in this article exhibits comparative performance to contemporary related works (see Table 13), where these cutting-edge AES tools generate agreement levels between 0.766 and 0.811 (Cozma et al. 2018; Taghipour and Ng 2016; Wang et al. 2018). Note that Cozma et al., Taghipour and Ng, and Wang et al. are the only ones having averaged their reported performance by repeatedly training their AES models multiple times, which tend to lower performance numbers.
Discussion: What are the Most Important Features per Rubric?
As previously mentioned, D7’s writing assessment, written by Grade-7 students, had an average number of words of approximately 171 words, was of persuasive/narrative/expository type, and required of students to write a story about patience. The marking guidelines provided to the two human raters were described in Table 3. Each essay was processed by the Suite of Automatic Linguistic Analysis Tools (SALAT), converting each essay into a 1592-metric vector. After having performed feature selection through filter (i.e., pruning of low-variance and correlated features) and embedded methods (i.e., ElasticNet regularization) and after having deleted all features which directly counted the number of words/tokens in an essay (Perelman 2013, 2014), 397 writing features were selected to train the four rubric scoring models, presented in the previous section. From the 397 selected features, 12 were generated by GAMET (grammar and mechanics), 97 by SEANCE (sentiment analysis and cognition), 76 by TAACO (cohesion), 14 by TAALED (lexical diversity), 108 by TAALES (lexical sophistication), and 90 by TAASSC (syntactic sophistication and complexity).
Tables 14 and 15 list the 20 most important features per rubric based on the classification model trained for each of them. It can be noted that for Rubrics 1, 2, and 4, writing features from all six SALAT’s tools rank among the top 20; as for Style Rubric, no linguistic indices generated by GAMET were included in the list of the 20 most important features.
Each rubric has a distinct set of most important features and feature weights are relatively small, which leads to the hypothesis that the models do not significantly suffer from dependence on a single or a few dominant features. For example, Ideas Rubric’s most important feature (you_gi: number of 2nd-person pronouns divided by number of words) carries a weight as low as 2.10% on the model’s performance. In other words, knowledge about the usage of second-person pronouns (suggesting a direct dialogue) allowed the rubric scoring model (Ideas Rubric) to increase the accuracy of its predictions by 2.10%. Similarly, when the Organization rubric scoring model is informed of the usage of words associated with infants and adolescents (nonadlt_gi, a category of words expressing social relations), the accuracy of its predictions is improved by 1.21%. The measure of textual lexical diversity assessed on content words (mtld_original_cw) (Fergadiotis et al. 2015; McCarthy and Jarvis 2010) improved the accuracy of Style Rubric’s predictions by 3.12%. The type-token ratio of function words calculated by taking the square root of the total number of function words (root_ttr_fw) (Torruella and Capsada 2013) is responsible for 2.68% of the Conventions rubric scoring model’s accuracy. This linguistic index is an example of the indirect influence that text length has on rubric score predictions; although word-count variables have been removed from consideration, the ‘root_ttr_fw’ feature is actually dependent on text length (see Table 17 in Appendix 3).
Table 16 lists the 20 most important features, all rubrics combined, by averaging the weights and standard deviations that each feature carries across the four rubrics. It demonstrates the potential importance of each feature on the prediction of essays’ holistic scores. For instance, the most important feature, the hypergeometric distribution’s D index which assesses the diversity of function words, has an average weight of 1.53% across all four rubrics. This implies that the accuracy of each rubric scoring model is improved by approximately 1.53 % ± 0.87%.Footnote 10 Only two writing features of global importance (‘pos_gi’ and ‘rcmod_nsubj_deps_nn_struct’) are not listed in at least one of the rubrics’ list of 20 most important features. Similarly, among the 66 linguistic indices forming the four lists of 20 most important features per rubric, only 18 of them are of global importance for all four rubrics. This offers a new perspective from which to analyze the importance of a feature. This confirms the necessity of performing customized feature selection at the rubric level.
Ideas Rubric
Five types of words (SEANCE) are of interest to the Ideas rubric scoring model. Together, their usage improves the model’s accuracy by 2.5% to 4.9% (3.7% ± 1.2%). These types of words are a) any direct reference to another person, b) abstract nouns (e.g., ability, accuracy, action, activity, administration), c) words expressing non-work social rituals (e.g., adjournment, affair, ambush, appointment, armistice), d) words introducing a time dimension in the story (e.g., abrupt, advance, after, afternoon, afterward), and e) words expressing the idea of fetching (denoting effort) (e.g., acquire, altruistic, apprehend, bandit, benefactor). In summary, the usage or the non-usage of these types of words might be indicative of whether the essay writer tries to tell a story about a tangible situation that happened in one’s life.
From a grammar and mechanics perspective (GAMET), the rubric scoring model only notices the number of grammatical errors and the number of misspellings of English contractions, representing between 0.3% and 2.3% of the model’s predictive power. This requires further verification to confirm whether the non-trivial presence of grammatical errors might prevent effective transmission of ideas.
The Ideas Rubric’s machine marker is attentive to four metrics of lexical diversity (TAALED) and six metrics of lexical sophistication, which account for 3.5–6.8% and 1.6–7.2% of its predictive power, respectively. It also takes notice of the variety of function words and content words through the lens of the measure of textual lexical diversity (MTLD) and the hypergeometric distribution’s D index (see Table 17 in Appendix 3 for more information about these indices). The machine marker also considers criteria such as the strength of association within trigrams and the number of occurrences of bigrams and content words in general usage (measured with COCA magazine corpus and HAL corpus). It looks at the mean range of content words, that is, the average number of texts in the COCA fiction corpus in which a content word is included. The rubric scoring model also feeds upon the proportion of trigrams in an essay text that are among the 10,000 most frequent trigrams in the COCA fiction corpus. In addition, it looks at the average generality or specificity (number of senses) of the adverbs used.
The rubric scoring model is not sensitive to text cohesion, except for the number of sentences with any verb lemma repeated somewhere in the next two sentences (0.4–1.5% of the predictive power). Likewise, syntactic sophistication and complexity play a limited role in determining the rubric score as they account for between 0.2% and 1.2% of the accuracy of the rubric score predictions.
Overall, the 20 most important features explain 16.2% ± 7.7% of the model’s predictive power. Consequently, they are arguably responsible for the increase in the percentages of exact and adjacent (±1) predictions in comparison to the naïve predictor, improving exact matches from 34.5% to 45.6% and improving adjacent (±1) matches from 65.5% to 89.5%.
Organization Rubric
The following vocabular elements play an important role in predicting the score of the Organization rubric: a) reference to children and adults (e.g., baby, boy, child, childish, children); b) expressions of positive affect through adjectives; c) usage of positive adjectives; d) expressions of increase in quality or quantity (e.g., abound, absorbent, absorption, accelerate, acceleration); and e) allusions to physical body parts and tangible objects. Together, they explain between 1.4% and 5.9% of the model’s predictive power. It is important to note that feature importance does not indicate whether important features are desirable traits to be found within an essay (e.g., high usage of body part words), but that the inclusion or exclusion of the information that they provide contributes to a more accurate scoring of the Organization rubric. Nevertheless, it can be hypothesized that these categories of vocabulary are desirable since they are indicative of storytelling, a requirement of the writing assessment’s prompt.
The rubric scoring model considers the following four TAALES lexical sophistication metrics: a) the frequencies of content words in general usage as in the HAL corpus, b) the degree of concreteness expressed by concrete words, c) the genericity and specificity of adjectives used (average number of senses per adjective), and d) the proportion of trigrams in an essay that are among the 10,000 most frequent trigrams in the COCA fiction corpus. Their contribution to the model’s accuracy is a bit ambiguous, that is, between −0.7% and 5.2%. Inclusion of certain features was, therefore, sometimes found to degrade the model’s predictive power.
The rubric scoring model uses only one punctuation-related metric from grammar and mechanics, that is, the number of times a comma is missing after a conjunctive/linking adverb at the beginning of a new sentence (e.g., however, besides, nonetheless, etc.). This writing feature contributes rather minimally to the model’s predictive power (between 0.4% and 1.0%).
Organization Rubric’s machine marker considers three writing features that measure aspects of text cohesion (0.8–2.6%). They are, a) the types of all connectives, b) the variety of adjectives used, and c) the presence of negative connectives (e.g., admittedly, alternatively, although).
Among the most important features are linguistic indices that describe the complexity of the noun phrases and clauses used (syntactic sophistication and complexity), such as a) the number of adjectival modifiers per direct object, b) number of modal auxiliaries per clause, c) prepositions per object of the preposition, and d) the number of phrasal verb particles per clause. Together they explain between −0.1% and 4.16% of the model’s accuracy. However, their impact shows some uncertainty because their interval crosses zero.
The list of 20 most important features includes only one metric pertaining to lexical diversity. This classical type-token ratio metric (the ratio of unique words to the total number of words (Gregori-Signes and Clavel-Arroitia 2015)) has a negligible effect on the model’s performance (−0.1–1.1%).
Overall, the 20 most important features explain 11.8% ± 10.5% of the model’s predictive power. Consequently, it is hypothesized that they are responsible for the increase in the percentages of exact and adjacent (±1) matches in comparison to the naïve predictor, improving from 33.1% to 48.2% for exact predictions, and improving from 69.8% to 92.3% for adjacent (±1) matches. Remarkably, there is no dominant feature, with all weights ranging between 0.45% and 1.21%.
Style Rubric
Six features of lexical diversity carry a heavy weight on the rubric scoring model’s predictive power, between 9.8% and 21.7%. Noticeably, the feature ‘lexical_density_type’ is counted twice since it is included in both TAALED’s and TAACO’s sets of linguistic indices. This is a minor limitation that will be addressed in future work.
In terms of vocabulary, the model considers whether words are indicative of: a) an assessment of moral approval or good fortune (the writing assessment’s prompt requires writing about patience), b) quantities such as cardinal numbers, c) frequency or pattern of recurrence, and d) socially-defined interpersonal processes (e.g., abolish, absentee, absolve, abuse, accept). Between 3.8% and 9.7% of the overall predictive power of the rubric scoring model is explained by these features.
The machine marker examines the number of sentence linking words (e.g., nonetheless, therefore, although), the number of sentences with any lemma overlap with the next two sentences, and the variety of content word lemmas, accounting for 2.3–5.7% of the rubric scoring model’s accuracy.
Information about lexical sophistication is also important to the model and improves its accuracy by 1.5–6.3%. In particular, the model considers word neighbor information such as the average number of phonological neighbors for each word in text (number of words that differ by one phoneme, excluding homophones), the degree of academic language within the essay, and the average strength of association inside any bigrams of words, that is the mean probability that any two consecutive words will occur together (Kyle et al. 2018).
The machine marker considers the number of relative clause modifiers per nominal, variety of dependents per nominal complement, and the number of nominal complements per clause. These measures of noun phrase/clause complexity and variety together explain 1.5–5.4% of the model’s predictions.
In sum, Style Rubric’s 20 most important features explain 33.8% ± 14.9% of the model’s predictive power. Consequently, it is hypothesized that they are responsible for the increase in the percentages of exact and adjacent (±1) predictions in comparison to the naïve predictor, improving from 46.3% to 55.4% for exact matches and improving from 79.7% to 95.9% for adjacent (±1) matches. Notably, this set of 20 most important features is the most predictive among the four rubrics and it most accurately determines the scores of the Style rubric. At minimum, it represents 18.9% of the predictive power and at a maximum, 48.7%. Style Rubric scoring model has both the highest naïve predictor’s performance and the best trained model’s performance of all four rubrics.
Conventions Rubric
Conventions Rubric scoring model uses two metrics of lexical diversity to determine rubric scores. Both measure the variety of function words within an essay and carry a weight of 2.6–7.4% of the scoring model’s total accuracy.
Syntactic sophistication and complexity play an important role in the predictive power of the rubric scoring model, that is, between 5.0–11.2%. It pays attention to a) the number of complex nominals per clause; b) variety in the number of dependents per nominal complement; c) factors related to the preferential lexical company kept by a verb-construction (interface between lexis and grammar) measured in relation to an academic corpus; d) the usage of less frequent verb-construction combinations (based on the lemmas of the constructions); e) use of possessives in nominal subjects, direct objects, and prepositional objects (e.g., my, his, her, their, etc.); and f) the number of relative clause modifiers per nominal (Kyle 2016).
Between 4.4–10.4% of the model’s accuracy depends on information about aspects of lexical sophistication. For instance, the model is interested in the contextual distinctiveness of vocabulary employed, that is, the likelihood to which a word will come to mind in response to a variety of stimuli (Kyle et al. 2018). It also looks at the average probability that any two consecutive words in an essay will co-occur. Further, it considers how frequently words occur in general usage; low-frequency is indicative of more sophisticated vocabulary and carries more information, while higher-frequency denotes more familiar vocabulary and is less informative. Similarly, the average scope in which words are used in the literature (normed as per the SUBTLEXus corpus) is taken into account by the model, including the mean number of orthographic neighbors for each word in the essay (the average number of words that can be formed by changing just one letter) (Kyle et al. 2018) and word recognition norms in terms of response latency and accuracy.
Regarding text cohesion, the model considers a variety of nouns and pronouns, lexical diversity in terms of lemmas leveraged in the essay text, and the average similarity between any pair of adjacent sentences. Their combined impact on the model’s accuracy adds up to between 1.6–5.4%.
Surprisingly, Conventions Rubric’s list of 20 most important features includes only one metric directly related to grammar and mechanics, which is the number of all grammatical errors. This confirms the findings of Crossley et al. (2019a) that GAMET’s macrofeatures are more efficient than individual microfeatures. The number of grammatical errors plays a limited role in the determination of the Conventions rubric score, that is, 1.0% ±0.7%, again confirming the weaker association that grammatical accuracy has with human judgment of essay quality as reported by Crossley et al. (2019a). This study hypothesizes that the Conventions rubric is more sensitive to complex aspects of grammar than to the simple grammar/spelling rules tracked by GAMET. Alternatively, low-quality essays may not exhibit a minimum level of quality for effective parsing, preventing further detection of grammatical and spelling errors. The follow-up study will test the hypothesis that the effect of grammatical and spelling accuracy on the Conventions rubric scoring model’s performance is mediated through features measuring aspects of syntactic and lexical sophistication and complexity.
Conventions Rubric’s 20 most important features explain 27.1% ± 12.0% of the model’s predictive power. It is hypothesized that they are responsible for the increase in the percentages of exact and adjacent (±1) matches in comparison to the naïve predictor, improving from 33.6% to 53.1% for exact matches and improving from 70.3% to 93.1% for adjacent (±1) matches. Notably, Conventions Rubric scoring model is the most improved over its corresponding naïve predictor’s performance. This set of 20 most important features is the second most predictive among the four rubrics. At minimum, they represent 18.9% of the predictive power and at maximum 48.7%.
This article notes that writing features could be grouped more consistently among the rubrics. For example, all SEANCE writing features could have been grouped under the same rubric, that is, either Ideas or Style. Accordingly, this study hypothesizes that the moderate-strong levels of agreement among rubrics (Table 7) influence this phenomenon.
Conclusion
This study investigated the potential of feature-based deep learning (multi-layer perceptron) in AES to predict rubric scores. It explained how rubric scores are derived. The 1567 Grade-7 essays of the Automated Student Assessment Prize contest’s seventh dataset trained the rubric scoring models of this study. The Suite of Automated Linguistic Analysis Tools processed each essay, converting them into a vector of 1592 writing features.
This study was a continuation and an improvement of a previous study, which had certain limitations in training generalizable rubric scoring models. The previous study used the 722 Grade-10 essays of ASAP’s eighth dataset, which had a small sample size, large scale, and imbalanced distribution of holistic and rubric scores, with high-quality essays that were underrepresented (Boulanger and Kumar 2019). The previous study suffered from a limited feature selection process, and the fact that the rubric scoring models were all trained on the same set of features, which hindered the ability to select features with the best fit. The research discussed in this article employed a larger essay dataset, applied thorough feature selection that was customized to each rubric, and tested six different deep learning architectures trained on a sample of 200 combinations of hyperparameter values randomly selected out of a space of 48,000 possible combinations. Training revealed that the best deep learning architectures had only two hidden layers, suggesting that shallower MLP neural networks were more accurate than deeper ones (three and more hidden layers).
Based on thorough analyses of the distributions of rubric score predictions and distributions of resolved and human raters’ rubric scores, this study reveals that the rubric scoring models closely approximate the performance of human raters. Consequently, it begs the question: if a machine marker’s performance can become equivalent to that of human raters’ one, is it possible to teach the machine to absolutely outperform humans, from whom it learns? What quantity and variety of data are needed to carry out research into this issue? What additional writing features need to be developed? These questions will be considered in a longitudinal follow-up study.
This study adopted a series of good practices to train generalizable rubric scoring models and made these practices completely transparent. The black box of each rubric scoring model was then scrutinized to determine the features and the degree to which they contributed to the determination of rubric scores. A set of the 20 most important features for each rubric emerged, in which at least 15 features were unique to every rubric and did not significantly contribute to the prediction of the other rubric scores. The study also revealed that rubric score prediction does not directly depend on a few word count-based features (all word count features were pruned). Moreover, many intuitive features were found and selected by each rubric with no particularly dominant features, making it more difficult to trick the AES system.
The results of the study are innovative for the AES research community because 1) they are derived from non-linear models, that is, no linear assumption is made, 2) they provide explanations behind the “reasoning” of the AES system as to why it gave the rubric scores it gave, and 3) this study sets forward a methodology that promotes transparency and understanding of feature-based deep/shallow neural networks. Mechanisms to introduce AI accountability and build trust between AI and human agents are crucial for the reliable and large-scale deployment of AES systems.
This study has limitations. For example, the feature selection filter methods were applied on the entire original training set (from which a labeled validation and testing set was created). To minimize further overfitting, they should have been applied on the training set alone (not the derived validation and testing sets). However, it is expected that this had a trivial impact on the rubric scoring models’ performance. Nonetheless, it is recommended that feature selection filter methods be applied on the unlabeled original validation and testing sets provided by ASAP. Another limitation relates to how the study estimated feature importance by randomizing the values of a single feature at a time, allowing to observe the impact of the feature on the rubric scoring model’s accuracy. It remains obscure whether this approach helped to measure the interaction effects between features on rubric score prediction. This should be clarified and considered when explaining the AI’s reasoning. An additional limitation of this study is a lack of testing of the rubric scoring models against gaming behaviors. These types of tests will assess how well the most important features work together in detecting counterfeit essays. Finally, the rubric scoring models could be retrained using only the most important features to thwart disinformation introduced by less important and/or even detrimental features. This will be a part of a follow-up study.
This article envisions an end-to-end AES system that provides student writers with predicted holistic and rubric scores, and that clearly identifies the scoring criteria behind each rubric. It can detect suboptimal characteristics in student essays to offer formative feedback, which can help students navigate the learning plateau in English writing. Future work will target the clustering of student essays in clusters relative to the number of rubric scores, to discover discriminative patterns in student essays to improve formative and remedial feedback. Alternatively, statistical methods such as ANOVA or the non-parametric Kruskal-Wallis test could be used to detect differences in feature distributions per rubric score. Further, a LSTM recurrent neural network with an attention mechanism (Alikaniotis et al. 2016; Dong et al. 2017) could be trained to locate spots in student essays that influence the AES system’s decision when assigning rubric scores.
Notes
Code and data are available at: https://osf.io/puyvh/.
For more information, consult https://machinelearningmastery.com/an-introduction-to-feature-selection/.
As previously indicated, the actual scale of holistic scores is 0–30 because the Conventions rubric score counts as twice: HS = R1 + R2 + R3 + (2 ∗ R4). For simplicity, the Conventions rubric will be counted just once in this study so that the scoring scale is 0–24.
Ranges of accuracy, as reported in this section, are rough estimates based on ±1 standard deviation from the weight.
References
Abbass, H. A. (2019). Social integration of artificial intelligence: Functions, automation allocation logic and human-autonomy trust. Cognitive Computation, 11(2), 159–171.
Alikaniotis, D., Yannakoudakis, H., & Rei, M. (2016). Automatic text scoring using neural networks. ArXiv Preprint ArXiv:1606.04289.
Balota, D. A., Yap, M. J., Hutchison, K. A., Cortese, M. J., Kessler, B., Loftis, B., Neely, J. H., Nelson, D. L., Simpson, G. B., & Treiman, R. (2007). The English lexicon project. Behavior Research Methods, 39(3), 445–459.
Boulanger, D., & Kumar, V. (2019). Shedding light on the automated essay scoring process. In Proceedings of the 12th International conference on educational data mining (EDM). Retrieved from http://educationaldatamining.org/edm2019/proceedings/
Brysbaert, M., Warriner, A. B., & Kuperman, V. (2014). Concreteness ratings for 40 thousand generally known English word lemmas. Behavior Research Methods, 46(3), 904–911.
Coltheart, M. (1981). The MRC psycholinguistic database. The Quarterly Journal of Experimental Psychology Section A, 33(4), 497–505.
Covington, M. A., & McFall, J. D. (2010). Cutting the Gordian knot: The moving-average type-token ratio (MATTR). Journal of Quantitative Linguistics, 17(2), 94–100.
Cozma, M., Butnaru, A. M., & Ionescu, R. T. (2018). Automated essay scoring with string kernels and word embeddings. ArXiv Preprint ArXiv:1804.07954.
Crossley, S. A., Kyle, K., & McNamara, D. S. (2016). The tool for the automatic analysis of text cohesion (TAACO): Automatic assessment of local, global, and text cohesion. Behavior Research Methods, 48(4), 1227–1237.
Crossley, S. A., Kyle, K., & McNamara, D. S. (2017). Sentiment analysis and social cognition engine (SEANCE): An automatic tool for sentiment, social cognition, and social-order analysis. Behavior Research Methods, 49(3), 803–821.
Crossley, S. A., Bradfleld, F., & Bustamante, A. (2019a). Using human judgments to examine the validity of automated grammar, syntax, and mechanical errors in writing. Journal of Writing Research, 11(2), 251–270.
Crossley, S. A., Kyle, K., & Dascalu, M. (2019b). The tool for the automatic analysis of cohesion 2.0: Integrating semantic similarity and text overlap. Behavior Research Methods, 51(1), 14–27.
Cummins, R., Zhang, M., & Briscoe, E. J. (2016). Constrained multi-task learning for automated essay scoring. Association for Computational Linguistics.
Dong, F., Zhang, Y., & Yang, J. (2017). Attention-based recurrent convolutional neural network for automatic essay scoring. In Proceedings of the 21st conference on computational natural language learning (CoNLL 2017) (pp. 153–162).
Dronen, N., Foltz, P. W., & Habermehl, K. (2015). Effective sampling for large-scale automated writing evaluation systems. In Proceedings of the second (2015) ACM conference on learning@scale (pp. 3–10).
Fergadiotis, G., Wright, H. H., & Green, S. B. (2015). Psychometric evaluation of lexical diversity indices: Assessing length effects. Journal of Speech, Language, and Hearing Research, 58(3), 840–852.
Fonti, V., & Belitser, E. (2017). Feature selection using lasso. VU Amsterdam Research Paper in Business Analytics.
Gregori-Signes, C., & Clavel-Arroitia, B. (2015). Analysing lexical density and lexical diversity in university students’ written discourse. Procedia-Social and Behavioral Sciences, 198, 546–556.
Jankowska, M., Conrad, C., Harris, J., & Kešelj, V. (2018). N-gram based approach for automatic prediction of essay rubric marks. In E. Bagheri & J. C. K. Cheung (Eds.), Advances in Artificial Intelligence (pp. 298–303). Cham: Springer International Publishing.
Johansson, V. (2009). Lexical diversity and lexical density in speech and writing: A developmental perspective. Lund Working Papers in Linguistics, 53, 61–79.
Kumar, V., Fraser, S. N., & Boulanger, D. (2017). Discovering the predictive power of five baseline writing competences. Journal of Writing Analytics, 1(1), 176–226 Retrieved from https://journals.colostate.edu/analytics/article/view/107.
Kyle, K. (2016). Measuring syntactic development in L2 writing: Fine grained indices of syntactic complexity and usage-based indices of syntactic sophistication. [Doctoral dissertation, Georgia State University]. https://scholarworks.gsu.edu/alesl_diss/35
Kyle, K., Crossley, S., & Berger, C. (2018). The tool for the automatic analysis of lexical sophistication (TAALES): Version 2.0. Behavior Research Methods, 50(3), 1030–1046.
Liang, G., On, B.-W., Jeong, D., Kim, H.-C., & Choi, G. (2018). Automated essay scoring: A Siamese bidirectional LSTM neural network architecture. Symmetry, 10(12), 682.
Liu, J., Xu, Y., & Zhao, L. (2019). Automated essay scoring based on two-stage learning. ArXiv Preprint ArXiv:1901.07744.
Lu, X. (2010). Automatic analysis of syntactic complexity in second language writing. International Journal of Corpus Linguistics, 15(4), 474–496.
Malvern, D., Richards, B., Chipere, N., & Durán, P. (2004). Lexical diversity and language development. New York: Palgrave Macmillan.
McCarthy, P. M., & Jarvis, S. (2010). MTLD, vocd-D, and HD-D: A validation study of sophisticated approaches to lexical diversity assessment. Behavior Research Methods, 42(2), 381–392.
Mesgar, M., & Strube, M. (2018). A neural local coherence model for text quality assessment. In Proceedings of the 2018 conference on empirical methods in natural language processing (pp. 4328–4339).
Murdoch, W. J., Singh, C., Kumbier, K., Abbasi-Asl, R., & Yu, B. (2019). Definitions, methods, and applications in interpretable machine learning. Proceedings of the National Academy of Sciences, 116(44), 22071–22080.
Perelman, L. (2013). Critique of Mark D. Shermis & Ben Hammer, contrasting state-of-the-art automated scoring of essays: Analysis. Journal of Writing Assessment, 6(1).
Perelman, L. (2014). When “the state of the art” is counting words. Assessing Writing, 21, 104–111.
Ribeiro, M. T., Singh, S., & Guestrin, C. (2016). “Why should I trust you?”: Explaining the predictions of any classifier. CoRR, abs/1602.0.
Rosebrock, A. (2017). Deep learning for computer vision with Python. PyImageSearch.
Shermis, M. D. (2014). State-of-the-art automated essay scoring: Competition, results, and future directions from a United States demonstration. Assessing Writing, 20, 53–76.
Stefanowitsch, A., & Gries, S. T. (2003). Collostructions: Investigating the interaction of words and constructions. International Journal of Corpus Linguistics, 8(2), 209–243.
Taghipour, K., & Ng, H. T. (2016). A neural approach to automated essay scoring. In Proceedings of the 2016 conference on empirical methods in natural language processing (pp. 1882–1891).
Torruella, J., & Capsada, R. (2013). Lexical statistics and typological structures: A measure of lexical richness. Social and Behavioral Sciences, 95, 447–454.
Wang, Y., Wei, Z., Zhou, Y., & Huang, X. (2018). Automatic essay scoring incorporating rating schema via reinforcement learning. In Proceedings of the 2018 conference on empirical methods in natural language processing (pp. 791–797).
West-Smith, P., Butler, S., & Mayfield, E. (2018). Trustworthy automated essay scoring without explicit construct validity. In 2018 AAAI Spring Symposium Series.
Woods, B., Adamson, D., Miel, S., & Mayfield, E. (2017). Formative essay feedback using predictive scoring models. In Proceedings of the 23rd ACM SIGKDD international conference on knowledge discovery and data mining (pp. 2071–2080).
Zhao, S., Zhang, Y., Xiong, X., Botelho, A., & Heffernan, N. (2017). A memory-augmented neural model for automated grading. In Proceedings of the fourth (2017) ACM conference on learning@scale (pp. 189–192).
Zupanc, K., & Bosnić, Z. (2017). Automated essay evaluation with semantic analysis. Knowledge-Based Systems, 120, 118–132.
Author information
Authors and Affiliations
Corresponding author
Additional information
Dedication
Prof Jim Greer, along with Prof Gord McCalla, in the late 90s supervised my (Vive Kumar’s) doctoral research at the ARIES lab, University of Saskatchewan. In those days, the pursuit of autonomous AIED was at its frenzy. Jim was one of the first ones to realize the need for the continued existence of an umbilical cord even after the birth of a machine intelligence from its human creators. ARIES later formalized it as ‘human-in-the-loop’, where humans co-create knowledge by cooperating, at various degrees of aggregation and abstraction, with an autonomous learning machine. Jim’s vision was a companionship, where every piece of data, knowledge, advice, decision, and policy that were in play would require an equal say from both the machine and its human creator. The human might convince the machine, or the machine might explain away its reasoning for something to exist in that world of companions. Jim and I had several thoroughly enjoyable conversations about the centrality of humans in a machine-supplemented world and vice-versa. We even had one during a friendly faculty-student baseball game, as he differentiated between a baseball catcher and a cricket wicketkeeper, on a beautiful spring day, at the best university campus in North America. Jim argued for the continued existence of the cord, as a precursor to building a notion of trust between the two entities. That was Jim, seeding his ideas in our minds, no matter the place or the situation.
About a decade later, Jim was on the advisory board of the Faculty of Science and Technology at Athabasca University where I had joined as a faculty member in 2008. Normally, he would attend the board meetings via teleconference, but in one such meeting he was there in Edmonton, Alberta, in person. For some reason, he took me aside during the lunch break for a chat. He said he was looking deeply into analytics and urged me to pursue the low-hanging fruits of learning analytics! He wondered about the feasibility of doing analytics with smalldata while not ignoring the compelling need for the AIED community to push the data boundary toward bigdata. We joked about the luxury of our research colleagues in Physics, Astronomy and Biology working with truly big exabyte datasets in subatomic data, astronomy data and genomic datasets, respectively. We talked about ways in which AIED researchers could find a way to collect live educational data autonomously and continually, from a rather large number of educational institutions, at a global level, for use as secondary data in exascale. That, we felt was a way to target multiple sigma improvements in educational outcomes. That was the last time I saw Jim in his blue shirt and that was also the last time I heard him passionately speak about AIED research, sharing a piece of his wisdom with me. And, he must have triggered something then, as he always does. Since then our little research group at Athabasca University managed to churn out a crop of publications, including this one, inspired a number of budding researchers, including the second author of this article, based solely on open data, a sort of low hanging, smalldata research. We will pursue several more harvests along the lines of deep-learned automated essay scoring, human-in-the-loop, and trust models, in memory of Jim – a great soul, my supervisor, my inspiration – Vive
Publisher’s Note
Springer Nature remains neutral with regard to jurisdictional claims in published maps and institutional affiliations.
Appendices
Appendix 1
This appendix lists the related works in the literature that have used the Automated Student Assessment Prize’s seventh essay dataset like this paper to train their automated essay scoring models. Table 13 is referenced in the Related Work section.
Appendix 2
This appendix includes Tables 14, 15, and 16, which delineate the most important writing indices per rubric and all rubrics combined. These tables are referenced in Section 5.
Appendix 3
This appendix lists and describes, along with their corresponding automated linguistic tools, the important writing indices mentioned in this article. Table 17 is mainly referenced in the “Discussion: What are the Most Important Features per Rubric?” section.
Rights and permissions
About this article

Cite this article
Kumar, V.S., Boulanger, D. Automated Essay Scoring and the Deep Learning Black Box: How Are Rubric Scores Determined?. Int J Artif Intell Educ 31, 538–584 (2021). https://doi.org/10.1007/s40593-020-00211-5
Published:
Issue Date:
DOI: https://doi.org/10.1007/s40593-020-00211-5