This issuePrevious ArticleNonlinear stability of stationary solutions to the Kuramoto-Sakaguchi equation with frustrationNext ArticleBounded confidence dynamics and graph control: Enforcing consensus
Mean field models for large data–clustering problems
We consider mean-field models for data–clustering problems starting from a generalization of the bounded confidence model for opinion dynamics. The microscopic model includes information on the position as well as on additional features of the particles in order to develop specific clustering effects. The corresponding mean–field limit is derived and properties of the model are investigated analytically. In particular, the mean–field formulation allows the use of a random subsets algorithm for efficient computations of the clusters. Applications to shape detection and image segmentation on standard test images are presented and discussed.
Figure 1.
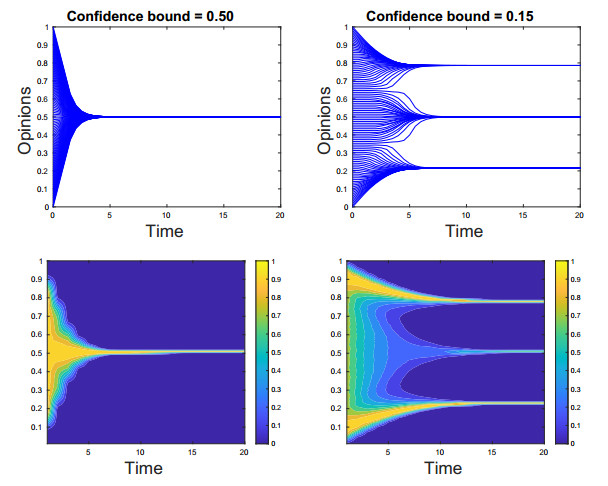
Trend to the steady–state of the one–dimensional Hegselmann–Krause model (1) with agents equally spaced at initial time and non–symmetric interactions (top row) and of the mean–field model (12) computed with Algorithm 1 (bottom row) up to final time . Left panels show the case for , the right panels show the case for
Figure 2.
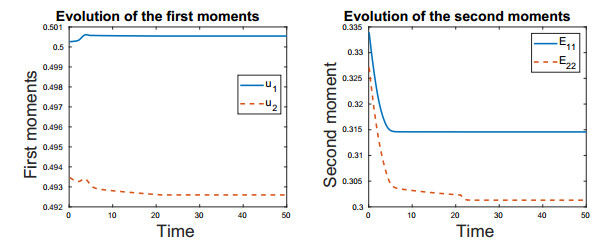
Evolution in time of the first moment (left) and of the second moment (right) for the two values of the bounded confidence level (dashed lines) and (solid lines)
Figure 3.
Left: trend to the steady–state of the mean–field model (12) computed with Algorithm 1 with , , and up to final time . Right: energy decay of the mean–field model (12) for several values of interacting particles
Figure 4.
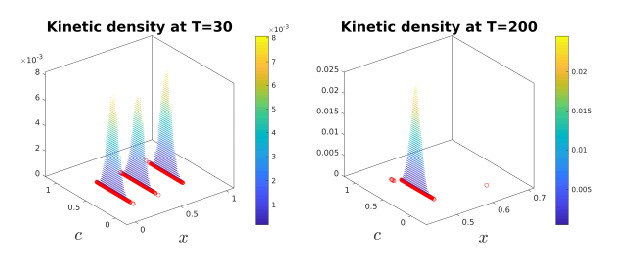
Particle solution (left plots) with and kinetic density (right plots). Results are provided at time (top row) and final time (bottom row). The bounded confidence level is
Figure 6.
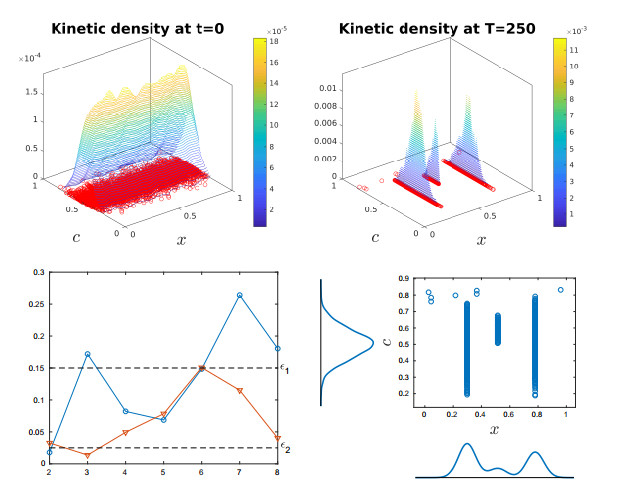
Top row: particles and kinetic density at initial time (left plot) and at equilibrium (right plot). Bottom row: at left, analysis of the distances between clusters in (blue line with circle markers) and direction (red line with triangle markers); at right, plot of the marginals. Confidence levels are and
Figure 8.
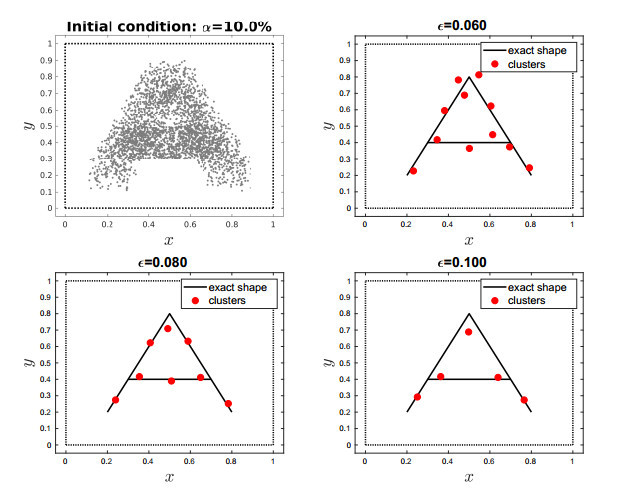
Shape detection of the letter "A" initialized with of a uniform additive noise. Top left panel shows the initial condition. We show clusters obtained with bounded confidence values (top right), (bottom left) and (bottom right)
Figure 9.
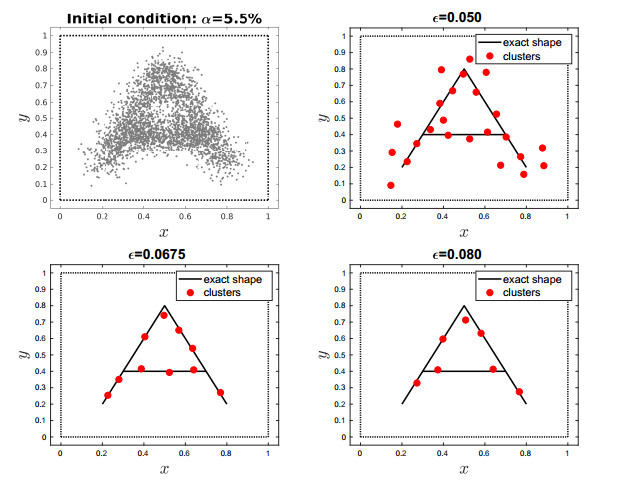
Shape detection of the letter "A" initialized with of a Gaussian additive noise. Top left panel shows the initial condition. We show clusters obtained with bounded confidence values (top right), (bottom left) and (bottom right)
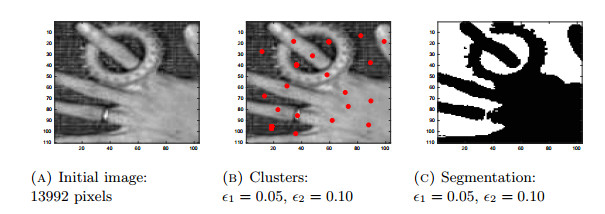
Figure 10.
Left panel: initial image of pixels with four regions with different gray intensity. Middle panel: red dots show the positions of the clusters at equilibrium. Right panel: segmentation of the initial image in two regions
G. Albi, N. Bellomo, L. Fermo, S.-Y. Ha and J. Kim, et al., Vehicular traffic, crowds, and swarms.: From kinetic theory and multiscale methods to applications and research perspectives, Math. Models Methods Appl. Sci., 29 (2019), 1901-2005.
doi: 10.1142/S0218202519500374.
[2]
G. Albi and L. Pareschi, Binary interaction algorithms for the simulation of flocking and swarming dynamics, Multiscale Model. Simul., 11 (2013), 1-29.
doi: 10.1137/120868748.
[3]
G. Albi and L. Pareschi, Modeling of self-organized systems interacting with a few individuals: From microscopic to macroscopic dynamics, Appl. Math. Lett., 26 (2013), 397-401.
doi: 10.1016/j.aml.2012.10.011.
[4]
G. Albi, L. Pareschi, G. Toscani and M. Zanella, Recent advances in opinion modeling: Control and social influence, in Active Particles, Vol. 1, Model. Simul. Sci. Eng. Technol., Birkhäuser/Springer, Cham, 2017, 49–98.
doi: 10.1007/978-3-319-49996-3_2.
D. Borra and T. Lorenzi, Asymptotic analysis of continuous opinion dynamics models under bounded confidence, Commun. Pure Appl. Anal., 12 (2013), 1487-1499.
doi: 10.3934/cpaa.2013.12.1487.
[10]
L. Boudin, R. Monaco and F. Salvarani, Kinetic model for multidimensional opinion formation, Phys. Rev. E, 81 (2010), 9pp.
doi: 10.1103/PhysRevE.81.036109.
[11]
L. Boudin and F. Salvarani, Opinion dynamics: Kinetic modelling with mass media, application to the Scottish independence referendum, Phys. A, 444 (2016), 448-457.
doi: 10.1016/j.physa.2015.10.014.
C. Canuto, F. Fagnani and P. Tilli, An Eulerian approach to the analysis of Krause's consensus models, SIAM J. Control Optim., 50 (2012), 243–265.
doi: 10.1137/100793177.
J. A. Carrillo, M. Fornasier, G. Toscani and F. Vecil, Particle, kinetic, and hydrodynamic models of swarming, in Mathematical Modeling of Collective Behavior in Socio-Economic and Life Sciences, Model. Simul. Sci. Eng. Technol., Birkhäuser Boston, Boston, MA, 2010, 297–336.
doi: 10.1007/978-0-8176-4946-3_12.
F. Dietrich, S. Martin and M. Jungers, Transient cluster formation in generalized Hegselmann-Krause opinion dynamics, 2016 European Control Conference (ECC), Aalborg, Denmark, 2016.
doi: 10.1109/ECC.2016.7810339.
S. Gould, R. Fulton and D. Koller, Decomposing a scene into geometric and semantically consistent regions, 2009 IEEE 12th International Conference on Computer Vision, Kyoto, Japan, 2009.
doi: 10.1109/ICCV.2009.5459211.
[25]
R. Hegselmann and U. Krause, Opinion dynamics and bounded confidence: Models, analysis and simulation, J. Artifical Societies Social Simulation, 5 (2002).
[26]
J. M. Hendrickx, Graphs and Networks for the Analysis of Autonomous Agent Systems, Ph.D thesis, Ecole Polytechnique de Louvain, 2008.
J. Kennedy and R. Eberhart, Particle swarm optimization, Proc. Internat. Conference Neural Networks, Perth, Australia, 1995.
doi: 10.1109/ICNN.1995.488968.
J. MacQueen, Some methods for classification and analysis of multivariate observations, Proc. Fifth Berkeley Sympos. Math. Statist. and Probability, Vol. Ⅰ: Statistics, Univ. California Press, Berkeley, CA, 1967, 281-297.
[32]
D. Martin, C. Fowlkes, D. Tal and J. Malik, A database of human segmented natural images and its application to evaluating segmentation algorithms and measuring ecological statistics, Proc. Eighth IEEE Internat. Conference Comp. Vision, Vancouver, Canada, 2001.
doi: 10.1109/ICCV.2001.937655.
A. Nedić and B. Touri, Multi-dimensional Hegselmann-Krause dynamics, 2012 IEEE 51st IEEE Conference on Decision and Control (CDC), Maui, HI, 2012.
doi: 10.1109/CDC.2012.6426417.
G. Oliva, D. La Manna, A. Fagiolini and R. Setola, Distributed data clustering via opinion dynamics, Internat. J. Distributed Sensor Networks, 11 (2015).
doi: 10.1155/2015/753102.
J. A. Sethian, Level Set Methods and Fast Marching Methods. Evolving Interfaces in Computational Geometry, Fluid Mechanics, Computer Vision, and Materials Science, Cambridge Monographs on Applied and Computational Mathematics, 3, Cambridge University Press, Cambridge, 1999.
[44]
P. Shan, Image segmentation method based on K-mean algorithm, EURASIP J. Image Video Processing, 81 (2018).
doi: 10.1186/s13640-018-0322-6.
[45]
L. Tian, L. Han and J. Yue, Research on image segmentation based on clustering algorithm, Internat. J. Signal Process. Image Process. Pattern Recognition, 9 (2016), 1-12.
doi: 10.14257/ijsip.2016.9.2.01.
X. Zheng, Q. Lei, R. Yao, Y. Gong and Q. Yin, Image segmentation based on adaptive -means algorithm, EURASIP J. Image Video Processing, 68 (2018).
doi: 10.1186/s13640-018-0309-3.
Trend to the steady–state of the one–dimensional Hegselmann–Krause model (1) with agents equally spaced at initial time and non–symmetric interactions (top row) and of the mean–field model (12) computed with Algorithm 1 (bottom row) up to final time . Left panels show the case for , the right panels show the case for
Figure 2.
Evolution in time of the first moment (left) and of the second moment (right) for the two values of the bounded confidence level (dashed lines) and (solid lines)
Figure 3.
Left: trend to the steady–state of the mean–field model (12) computed with Algorithm 1 with , , and up to final time . Right: energy decay of the mean–field model (12) for several values of interacting particles
Figure 4.
Particle solution (left plots) with and kinetic density (right plots). Results are provided at time (top row) and final time (bottom row). The bounded confidence level is
Figure 5.
Evolution in time of the two–dimensional first moments (left) and second moments (right) for the bounded confidence level
Figure 6.
Top row: particles and kinetic density at initial time (left plot) and at equilibrium (right plot). Bottom row: at left, analysis of the distances between clusters in (blue line with circle markers) and direction (red line with triangle markers); at right, plot of the marginals. Confidence levels are and
Figure 7.
Particle and kinetic density at equilibrium with confidence levels , (left) and , (right)
Figure 8.
Shape detection of the letter "A" initialized with of a uniform additive noise. Top left panel shows the initial condition. We show clusters obtained with bounded confidence values (top right), (bottom left) and (bottom right)
Figure 9.
Shape detection of the letter "A" initialized with of a Gaussian additive noise. Top left panel shows the initial condition. We show clusters obtained with bounded confidence values (top right), (bottom left) and (bottom right)
Figure 10.
Left panel: initial image of pixels with four regions with different gray intensity. Middle panel: red dots show the positions of the clusters at equilibrium. Right panel: segmentation of the initial image in two regions
Figure 11.
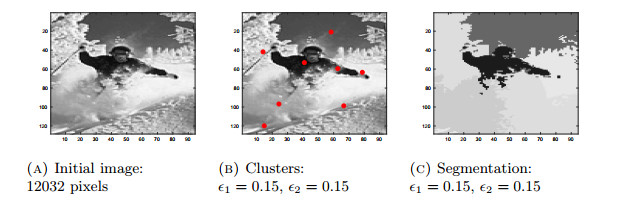
Image segmentation of gray scale image taken by the data–set [6]
Figure 12.
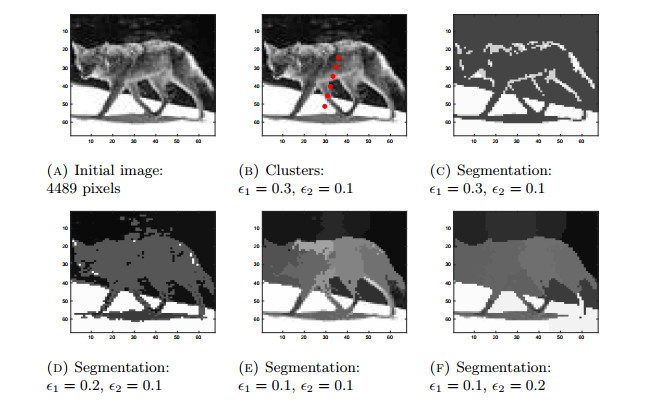
Image segmentation of gray scale image taken by the data–set [24]
Figure 13.
Image segmentation of gray scale image taken by the data–set [32]
Figure 14.
Image segmentation of gray scale image taken by the data–set [32]
Figure 15.
Image segmentation of gray scale image taken by the data–set [32]


 Download:


 {{journal.titleEn}}


