
Abstract
In recent times, researchers in pedagogy have focused on digital learning logs collected by learning tools such as Learning Management Systems and digital textbook systems. By analyzing and visualizing these, they aim to improve learning and/or teaching methodologies in the future. Using a digital textbook system, it is possible to collect information on which textbook pages were browsed by learners. However, these tools cannot decipher which zones of the textbook were browsed. In order to collect this information, eye-tracker technology would be necessary, but providing each learner with an eye-tracker would be too expensive. To solve this problem, a previous work proposed a method that used masks to detect and conceal each section of the slides in a digital textbook. The learner then clicked the masks one by one to delete them while browsing the contents of the digital textbook. By recording the learner’s clicking operations, the method collected information about the zones browsed by the learner. However, this method was found to cause a decline in learning achievement and system usability as a large number of zones were hidden. Therefore, we propose a grouping method, based on the layout information of the slides, in order to identify the appropriate zones to hide with masks.
You have full access to this open access chapter, Download conference paper PDF
Keywords
1 Introduction
The Japanese government announced that digital textbooks will be introduced in K12 schools by 2020 [1]. The policy regarding the digital textbooks focuses on introducing the digital textbook technologies. Here are reasons why digital textbooks are going to be introduced:
-
(1)
Interactive multimedia: The digital textbooks can respond to learners’ actions by presenting contents such as texts, images, animations, videos, audios and video games in themselves.
-
(2)
Portability: Paper-based textbooks can be bulky and heavy. On the other hand, the digital textbooks can be read on a mobile device, enabling learners to access more than a hundred textbooks.
-
(3)
Functionality: Learners can use functions such as highlight, bookmarks, zoom-in, zoom-out, and copy and paste.
For the reasons stated above, the majority of educational institutions have introduced digital textbook systems in schools and universities, but little attention has been paid to analyzing and visualizing the collected logs to improve learning and teaching.
To tackle the issue, Ogata et al. [2] introduced a digital textbook system in universities and analyzed the logs collected by the system. By analyzing the logs, it is possible to collect information on which textbook pages were browsed by learners. However, it is difficult to collect the more specific information of which zones of the textbook were browsed. Mouri et al. [3, 4] proposed a scratching method to collect information regarding the zones browsed. The method detects and hides with masks each section of the slide in a digital textbook. Thereafter, the learner clicks the masks one by one to delete them while browsing the textbook contents. By recording the learner’s clicking operations, the method can collect information regarding the zones browsed by the learner. However, this method was found to cause a decline in learning achievement and system usability as a large number of zones were hidden.
Therefore, we propose a grouping method based on the layout information of the slides in order to identify the appropriate zones to hide with masks. The rest of this paper is structured as follows. Section 2 describes previous work regarding digital textbook systems. Section 3 describes the system we propose. Finally, Sect. 4 describes our conclusions followed by future works.
2 Digital Textbook Systems
In many countries, their policies regarding the digital textbooks focus only on introducing the technology of the digital textbooks to K12 schools [5,6,7]. For example, the digital textbook system called BookLooper was developed by Kyocera Maruzen Systems Integration Co., Ltd [8]. The system provides a cloud service and the digital textbooks are managed in the cloud based on digital right management. Learners can download the digital textbooks using BookLooper. However, if a certain analyst wants to analyze the log data of the digital textbooks, s/he needs to download them because the company manages the collected logs. Therefore, it is difficult for the analyst to analyze them in real time. If the analyst could analyze the logs in real time, it would be possible to support each learner in accordance with his/her browsing status.
To solve the problem, Mouri et al. [3, 4] developed a digital textbook system called SEA (Smart E-textbook Application) to collect the digital textbook logs. Figure 1 shows the interface of SEA.

Interface of SEA [4]
A learner can read the digital textbooks on a web browser at any time and any place. The system supports six functions: Next, Prev, Bookmark, Highlight, Memo, and Search. By clicking on the Bookmark button, the current page will be saved as a favorite for easier future access. When the learner feels some words, phrases, or sentences important, s/he can Highlight them. When the learner clicks on the Memo button, s/he can post a note about the target words.
Unlike previous digital textbook systems [3, 4, 9,10,11], the proposed system automatically hides the text in the digital textbooks with mask processing before the learner browses the texts. If the learner clicks on a masked text, the system gets rid of the mask and the text appears. Then, the system can identify the x- and y-coordinates of the position where the learner clicked on the texts. From this, the system can identify which zone of the page the learner was browsing in the digital textbook. Table 1 shows the difference between the previous digital textbook systems and SEA.
3 Proposed System
3.1 Overview
In this section, we propose a system for grouping texts in the slide based on the layout information of the slide in order to improve scratching. Figure 2 shows an overview of our system.
-
1.
Input. Teachers prepare lecture slides with PowerPoint. By uploading the slides to the SEA (digital textbook system), SEA can gather information on the character areas and slide images. The details of the input are described in Sect. 3.2.
-
2.
System. Our system executes text processing and image classification.
-
a.
Text processing executes three processes, (1) Single-line processing, (2) Multiple-line processing. The proposed system determines relation among texts through (1) and (2). The detail of these processes is described in 3.3.
-
b.
To process the image, the system extracts shapes from the slide image and detects the corners of each shape. Based on the positions of the corners, the system detects an arrow and a balloon. The detail of image processing is described in 3.3
-
a.
-
3.
Output. The system groups texts based on the result of 2.a and 2.b. The output is shown to teachers; they confirm the relation between texts in a slide, and can apply scratch to the important areas of a slide.
Fig. 2. 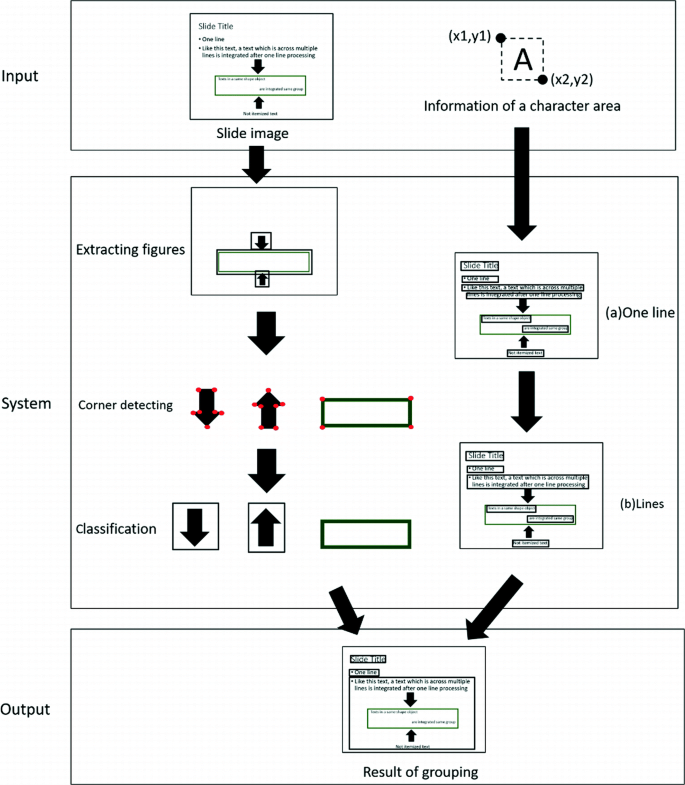
Overview of our system

3.2 Input
We used two types of input data: slide images and information of the character areas. A slide image includes sentences, images and shape objects. As shown in Fig. 3, the information of the character area consists of a single character and the upper-left and bottom-right coordinates (x1, y1), (x2, y2) of the rectangle surrounding the character in the slide image.

Information of a character area
3.3 System
Processing the Information of Character Areas
Integration processing carries out (a) Single-line processing, (b) Multiple-line processing.
-
(a)
Single-line processing
Figure 4 shows the Single-line processing.

Single-line processing
-
(1)
In the slide image, search the top-left character area that is not included in any text area.
-
(2)
If a such character area exists, introduce a new text area that consists of the character area and has a search window whose size is identical to the character area.
-
(3)
Locate the top-left point of the search window to the top-right point of the current text area.
-
(4)
If there is the top-left point of another character area inside the search window, extend the text area so that it contains the character area and go back to (3). Otherwise, the Single-line processing terminates.
-
(b)
Multiple-line processing
This process decides whether there is relation between the vertically juxtaposed text areas. Figures 5 and 6 show the multiple-line processing.

Multiple-line processing

Itemized multiline processing
-
(1)
If there are two text areas that are vertically juxtaposed as shown in Fig. 5(1), select the upper text area.
-
(2)
Locate the search window so that its top-left point overlaps the bottom-left point of the upper text area.
-
(3)
Note that the size of the search window is identical to the size of the character area of the top-left character of the upper text area.
-
(4)
Search the text area below the upper text area. If an item symbol is included in the search window, recognize that the lower text area does not belong to the upper text area. If the text area is not detected, the processing terminates.
-
(5)
Otherwise, that is, if a text area is detected, integrate the upper and lower text areas into a new text area, and go back to (1).
-
(1)
If there are two text areas that are vertically juxtaposed as shown in Fig. 6(1), select the upper area.
-
(2)
Locate the search window so that its top-left point overlaps the bottom-right point of the top-left character of the upper text area.
-
(3)
Note that the size of the search window is identical to the size of the character area of the top-left character of the upper text area.
-
(4)
Search the text area below the upper text area. If an item symbol is included in the search window, recognize that the lower text area does not belong to the upper text area. If the text area is not detected, the processing terminates.
-
(5)
Otherwise, that is, if a text area is detected, integrate the upper and lower text areas into a new text area, and go back to (1).
Shape Object Classification
In the slide, in order to extract shape objects such as circles, squares, triangles, and so on, this study carries out the following image processing.
-
(1)
Generate a binary image by binarizing the slide image. After binarization, label each shape object.
-
(2)
By using a corner detection technology [12], classify shape objects. This paper describes how to classify arrows.
-
(3)
Judge if the shape object is an arrow or not by using the pattern in Fig. 7. That is, judge if the shape object is an arrow or not by overlapping it onto the 3 × 3 zones shown in Fig. 7 and checking the number of the corners in each zone to be equal to the corresponding integer in Fig. 7.
Fig. 7. 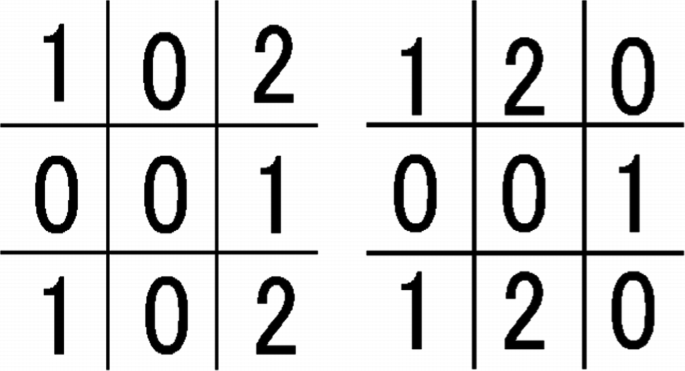
A 3 × 3 detection pattern for a right arrow using horizontal and vertical lines
-
(4)
If the shape object is not judged to be an arrow in (3), Judge if the shape object is an arrow or not by using the pattern in Fig. 8. For example, as shown in Fig. 9, each red point means each corner. From the results, we can find the arrow and the direction. That is, judge if the shape object is an arrow or not by overlapping it onto the 2 × 2 zones shown in Fig. 8 and checking the number of the corners in each zone to be equal to the corresponding integer in Fig. 8.
Fig. 8. 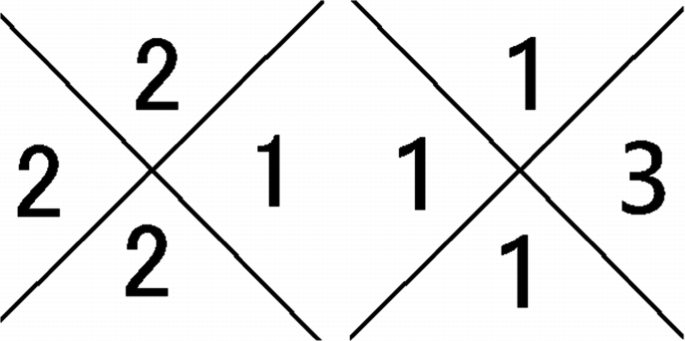
A 2 × 2 detection pattern for a right arrow using diagonal lines
Fig. 9. 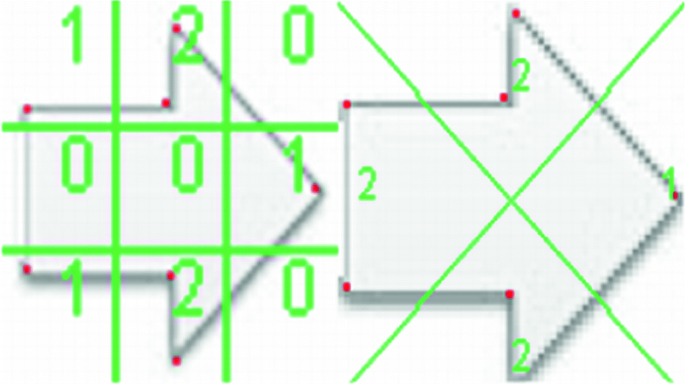
An example of detection of a right arrow (Color figure online)


Output
Figure 10 shows the output of our system. The slide consists of three groups of texts. The two-line texts were successfully integrated. In addition, there are three nested subgroups of texts, which are related by the up and down arrows. The system also successfully integrated them into one group by detecting the arrows. The system can output the result of grouping as a two-dimensional array. The size of the array is equal to the resolution of the input image. Each element of the array has a natural number, which represents a group number. That is, if a point in the slide belongs to a group whose group number is 2, the corresponding element of the array has the value 2. If the point does not belong to any group, the element has the value 0.

Example of output of the system
4 Conclusions and Future Works
In this paper, we proposed a system for grouping areas in a slide of a digital textbook. Grouping is based on the layout information of the slide. The input of the system is the information of character areas and the slide images. The system detects the relationship among texts using the information of character areas. Based on the position of each character, the system decides the positions and the sizes of the text areas. In addition, the system extracts shape objects from slide images. Among shape objects, arrows represent context of text groups. Therefore, the system classifies arrows to extract context of the text groups in the slide. The system uses the positions of corners in a shape object extracted from the slide image. In other word, the system groups texts in the slide with the relation among the texts and the shape objects.
The system helps to extract the appropriate zones to hide with masks by grouping texts in a slide. Note that the system doesn’t extract the appropriate zones themselves. Grouping the texts prevents hiding too many zones, but it doesn’t show the appropriate zones to hide. To solve this problem, it is necessary to define priority of masking.
References
MEXT, Japanese Ministry of Education, Culture, Sports, Science and Technology. “The Vision for ICT in Education” (2011). http://www.mext.go.jp/b_menu/houdou/23/04/__icsFiles/afieldfile/2012/08/03/1305484_14_1.pdf
Ogata, H., Yin, C., Okubo, F., Shimada, A., Kojima, K., Yamada, M.: E-book-based learning analytics in university education. In: Proceedings of the International Conference on Computers in Education, pp. 401–406 (2015)
Mouri, K., Shimada, A., Yin, C., Kaneko, K.: Discovering hidden browsing patterns using non-negative matrix factorization. In: Proceedings of the 11th International Conference on Educational Data Mining (2018)
Mouri, K., Uosaki, N., Shimada, A., Yin, C., Kaneko, K., Ogata, H.: Redesign of a data collection in digital textbook systems. In: Proceedings of the International Conference on Learning Technologies and Learning Environments (2018)
Shin, J.H.: Analysis on the digital textbook’s different effectiveness by characteristics of learner. Int. J. Educ. Learn. 1(2), 23–38 (2012)
Shepperd, J.A., Grace, J.L., Koch, E.J.: Evaluating the electronic textbook: is it time to dispense with the paper text? Teach. Psychol. 35(1), 2–5 (2008)
Fang, H., Liu, P., Huang, R.: The research on e-book-oriented mobile learning system environment application and its tendency. In: Proceedings of the International Conference on Computer Science and Education, pp. 1333–1338 (2011)
BookLooper. https://www.kccs.co.jp/ict/service/booklooper/
Kiyota, M., Mouri, K., Uosaki, N., Ogata, H.: AETEL: supporting seamless learning and learning log recording with e-book system. In: Proceedings of the 24th International Conference on Computers in Education, pp. 306–314 (2016)
Yin, C., Okubo, F., Shimada, A., Kojima, K., Yamada, M., Ogata, H.: Smart-phone based data collecting system for analysing learning behaviors. In: Proceedings of the International Conference on Computers in Education, pp. 575–577 (2014)
Shimada, A., Mouri, K., Ogata, H.: Real-time learning analytics of e-book operation logs for on-site lecture support. In: Proceedings of the 17th IEEE International Conference on Advanced Learning Technologies, pp. 274–275 (2017)
Harris, C., Stephens, M.: A combined corner and edge detector. In: Proceedings of the 4th Alvey Vision Conference, pp. 147–151 (1988)
Acknowledgments
This part of this research was supported by the Grant-in-Aid for Scientific Research No.17K12947 from the Ministry of Education, Culture, Sports, Science and Technology (MEXT) in Japan.
Author information
Authors and Affiliations
Corresponding author
Editor information
Editors and Affiliations
Rights and permissions
Copyright information
© 2019 Springer Nature Switzerland AG
About this paper

Cite this paper
Suzuki, F., Mouri, K., Uosaki, N., Shimada, A., Yin, C., Kaneko, K. (2019). Elicitation of Appropriate Scratching Zones Based on Lecture Slide Layouts. In: Streitz, N., Konomi, S. (eds) Distributed, Ambient and Pervasive Interactions. HCII 2019. Lecture Notes in Computer Science(), vol 11587. Springer, Cham. https://doi.org/10.1007/978-3-030-21935-2_33
Download citation
DOI: https://doi.org/10.1007/978-3-030-21935-2_33
Published:
Publisher Name: Springer, Cham
Print ISBN: 978-3-030-21934-5
Online ISBN: 978-3-030-21935-2
eBook Packages: Computer ScienceComputer Science (R0)