
Abstract
Road traffic has become a main source of air pollution in urban areas. For this reason, governments are applying traffic regulations trying to fulfill the recommendations of Air Quality (AQ) standards in order to reduce the pollution level. In this paper, we present a novel proposal to improve AQ in cities by combining fuzzy logic and Complex Event Processing (CEP) technology. In particular, we propose a flexible fuzzy inference system to improve the decision-making process by recommending the actions to be carried out on each pollution scenario. This fuzzy inference system is fed with pollution data obtained by a CEP engine and weather forecast from domain experts.
This study was funded in part by the Spanish Ministry of Science and Innovation and the European Union FEDER Funds under Grants TIN2015-65845-C3-2-R, TIN2015-65845-C3-3-R and TIN2016-81978-REDT, and also by the JCCM regional projects SBPLY/17/180501/000276/1 and SBPLY/17/180501/000276/2, both of them co-financed by the European Union FEDER Funds.
You have full access to this open access chapter, Download conference paper PDF
Keywords
1 Motivation
Nowadays, Air Quality (AQ) in cities is becoming a great environmental problem, posing multiple challenges in terms of management and mitigation of harmful pollutants. A poor air quality can cause health problems and reduce the quality of life, with children, elderly people and those with existing heart and lung conditions begin the most affected. The World Health Organization (WHO) [13] has estimated that atmospheric pollution caused around 4.2 million premature deaths worldwide in 2016. As an illustration of the public awareness importance of this problem, different organizations worldwide report daily air quality on the basis of major pollutants such as EPA (Environmental Protection Agency) [2] in the USA and EEA (European Environment Agency) [5] in the EU.
Nevertheless, data reported by air quality monitoring stations indicate that very often air pollutants levels exceed the limits and guidelines reported by these international agencies, which have harmful effects on human health and/or the environment as a whole. Clearing up the air in big cities is not an easy challenge because it necessarily involves taking concrete actions, even if they are not popular. Therefore governments and local authorities face to a complex make-decision process.
In an increasingly interconnected world, the role of computational science with novel models, algorithms and tools driving efficient application in environmental systems can be crucial to find proposals to reduce air pollution in large urban centers implementing new policies. In the present paper, our aim is to propose the combined use of Complex Event Processing (CEP) [6] –a technology that allows us to process and correlate large volumes of data by matching event patterns- and Fuzzy Inference System (FIS) –a mechanism based on fuzzy logic [14], which provides a formal methodology for representing, manipulating, and implementing a heuristic knowledge about how to control a system allowing to model complex systems in a more intuitive manner. In this way, our proposal presents an unprecedented work combining fuzzy logic and CEP to improve the decision-making process by recommending the actions to be carried out on each pollution scenario.
In particular, this approach allows us to make decisions about traffic regulations on a daily basis, considering the levels of environmental pollution according to the air quality levels accepted by the international recommendations. For this purpose, both the automatically monitored pollution levels for the previous days and the weather forecast for the following day provided by the domain expert are used to make a decision about the specific type of traffic regulation to be applied, if necessary.
The rest of the paper is organized as follows. Section 2 describes the proposal based on CEP and fuzzy logic to improve AQ using traffic regulation, then Sect. 3 tested it on a real AQ dataset. Finally, Sect. 4 concludes the paper and provides possible lines of future work.
2 An Approach to Improve AQ in Cities
We focus on the \(NO_2\) pollutant, since this is possibly the most significant pollutant in the case of large cities, due to the high values it reaches with respect to the AQ standards under the Air Quality Directive from the European Environment Agency (EEA), and WHO air quality guidelines. This pollutant is mainly produced by combustion engines, so traffic restrictions are applied during episodes of high pollution, for instance, banning vehicles from driving [8]. However, this methodology could be applied over any other pollutants or a combination of them. Specifically, we focus on the limit value of 40 \(\upmu \mathrm{g/m}^3\) annual average, and our objective is to address long-term improvements to AQ in order not to exceed this limit value. Other policies and proposals for AQ improvement could also be applied in combination with our proposal, such as investing in public transport, cycling lanes, etc.
2.1 Methodology
Our main objective is to outline an easy and readable methodology combining CEP technology and fuzzy logic in order to establish an action plan to reduce \(NO_2\) emissions of road traffic in each possible scenario.
A Fuzzy Inference System (FIS) is a system that uses fuzzy set theory to map inputs (features in the case of fuzzy classification) to outputs (classes in the case of fuzzy classification). This mapping provides a basis from which decisions can be made. One of the most commonly FIS used is Mamdani’s fuzzy inference method [9], proposed by Ebrahim Mamdani in 1975. This mechanism involves the following steps: (1) Definition of the fuzzy sets and fuzzification of each input, (2) Definition of fuzzy if-then rules, (3) Aggregation of the consequent by applying the rules, and (4) Defuzzification of the output. In this way, we consider as an input of our FIS three parameters: \((\alpha , \beta ,\gamma )\), where \(\alpha \) is the last day average of \(NO_2\); \(\beta \) is a weighted average of \(NO_2\) for the two previous days, and \(\gamma \) is the weather forecast for tomorrow. In this way, \(\alpha \) and \(\beta \) are data obtained for the monitored places by using a CEP engine and \(\gamma \) is a parameter provided from a domain expert. The output of the FIS is the \(\mu \) parameter, which is a natural value ranging from 0 to 10 that determines the action plan. We will use the fuzzy logic designer of the fuzzy logic MATLAB toolbox [10] for our proposed FIS.
Our methodology to improve the AQ in cities consists of several steps, which are introduced as follows:
-
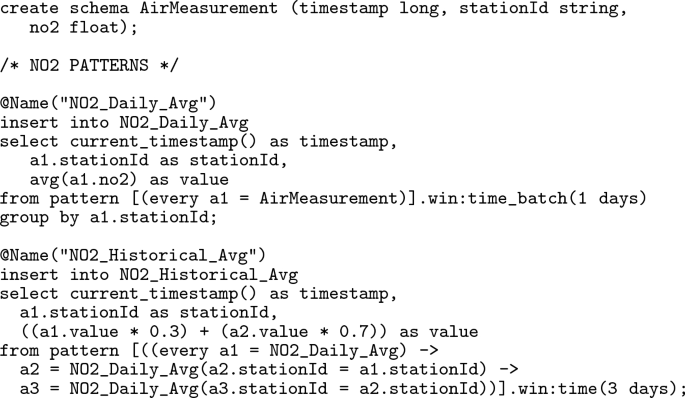
Step 1. The implementation of the event patterns to compute the \(\alpha \) and \(\beta \) FIS inputs. These patterns are encoded in Esper EPL [3, 4], by using the AirMeasurement schema defined below, which has three attributes: the time at which the measure was taken, the station identifier, and the \({ NO}_2\) value. For each station, the NO2_Daily_Avg pattern computes its daily average of \(NO_2\) (i.e. \(\alpha \)), while the NO2_Historical_Avg pattern calculates the (0.3 and 0.7) weight averages of \(NO_2\) (i.e. \(\beta \)) for the day before yesterday and yesterday, respectively. Note that other periods of time and weights could also be considered.
-
Step 2. Define the corresponding classification for \((\alpha ,\beta ,\gamma )\) inputs and the \(\mu \) output, establishing different rating levels for these inputs and outputs. To not exceed the limit value of 40 \(\upmu \mathrm{g/m}^3\) annual average of \(NO_2\), we propose the classification for \(\alpha \) and \(\beta \) shown in Table 1, but other possibilities can be studied.
The \(\gamma \) parameter is provided by a domain expert according to Pasquill Stability Classes [12], with values ranging from 0 to 8 (Table 2). Nevertheless, and for greater simplicity only 3 levels will be considered (but any other number of levels would be possible). Then, ratings A and B are considered as Favourable, C, D and E as Neutral, and F and G Unfavourable. Furthermore, five action plans are proposed depending on the \(\mu \) value (see Table 3).
-
Step 3. Definition of the fuzzy sets for \(\alpha \), \(\beta \), \(\gamma \) inputs and the \(\mu \) output. We consider the Gaussian combination membership function (gauss2mf) for \(\alpha \) and \(\beta \) (Fig. 1) and the Triangular-shaped membership function (trimf) for \(\gamma \) and \(\mu \) (the details in each case can be found in [7]). Note that it is possible to change membership functions (parameters and type) according to domain expert’s recommendations based on previous experiences.
-
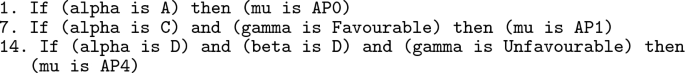
Step 4. Definition of the rules for the fuzzy inference process. The whole proposal [7] includes 17 fuzzy if-then- rules (all of them with the same priority). Some of these rules are the following:


Fuzzy sets for \(\alpha \) and \(\beta \)
3 Discussion
We have tested our methodology on an AQ dataset of Madrid city, available at [8]. As an example, we have considered the data set obtained from the Aguirre’s school station on April \(09^{th}\), \(10^{th}\) and \(11^{th}\), 2018 (shown in Table 4), obtaining the values \(\alpha = 61.75\) and \(\beta =50.12\). Furthermore, the weather forecast was obtained from the weather archive available at [11], obtaining the value \(\gamma =3\). In a real time scenario, these values would be produced in real time by the CEP engine by applying the patterns described in the first step of the proposed methodology. The data set to reproduce the results obtained using this data is available at [7], where readers can find the schema, patterns and data used in this scenario. Readers are committed to use the on-line software https://www.esperonline.net/ to reproduce this scenario.
Using the FIS defined in the previous section we obtain that \(\mu =5.53\) and then both action plans AP2 and AP3 could be considered for application, but the membership grade for \(\mu =5.53\) is higher for the fuzzy set corresponding to the AP2 (0.735) action plan than that of the AP3 plan (0.265), so the AP2 action plan will be finally recommended.
4 Conclusions and Future Work
In this paper, a methodology combining CEP and fuzzy logic has been proposed for improving the AQ in large cities. Thanks to the use of CEP technology, some of the input parameters required by the proposed FIS are automatically calculated. Additionally, fuzzy logic improves the decision-making process by recommending the actions to be carried out on each scenario.
One of the main advantages of our proposal is its flexibility and feasibility to be adapted to new scenario requirements. For instance, new input variables and fuzzy rules can easily be included in the FIS model as well as new modifications of the action plan in order to reduce more the air pollution.
As future work, we plan to extend this work by including other relevant pollutants (and the interactions between them) specified in the AQ international standards, for instance PM and/or \(O_3\), as well as considering other objectives for \(NO_2\) pollution reduction such as not exceeding the value of 200 \(\upmu \mathrm{g/m}^3\) of the \(NO_2\) hourly average more than 18 times in a year. Moreover, more experiments would be included together with a deep study of the optimality of the proposal.
Furthermore, this approach could be integrated with our ITS proposed in [1], by including an appropriate Fuzzy Inference System following this methodology. This would allow us to improve the traffic regulation by means of a more realistic approach.
References
Díaz, G., Macià, H., Valero, V., Boubeta-Puig, J., Cuartero, F.: An intelligent transportation system to control air pollution and road traffic in cities integrating CEP and colored petri nets. Neural Comput. Appl. (2018). https://doi.org/10.1007/s00521-018-3850-1
Environmental Protection Agency: Air Pollution. https://airnow.gov/. Accessed 23 Jan 2019
EsperTech: Esper EPL Online. http://esper-epl-tryout.appspot.com/epltryout/index.html. Accessed 10 Jan 2019
EsperTech: Esper reference documentation. http://www.espertech.com/esper/esper-documentation/. Accessed 10 Jan 2019
European Environmental Agency: Air Pollution. https://www.eea.europa.eu/themes/air/air-quality-index. Accessed 23 Jan 2019
Luckham, D.: Event Processing for Business: Organizing the Real-Time Enterprise. Wiley, Hoboken (2012)
Macià, H., Díaz, G., Boubeta-Puig, J., Valero, E., Valero, V.: A dataset for the paper “Combining fuzzy logic and CEP technology to improve air quality in cities”. https://dx.doi.org/10.17632/4njddyw68t.1. Accessed 3 Apr 2019
Madrid City Council: Portal web de Calidad del Aire del Ayuntamiento de Madrid. http://www.mambiente.munimadrid.es/sica/scripts/. Accessed 23 Jan 2019
Mamdani, E., Assilian, S.: An experiment in linguistic synthesis with a fuzzy logic controller. Int. J. Man-Mach. Stud. 7(1), 1–13 (1975). https://doi.org/10.1016/S0020-7373(75)80002-2
MathWorks: MATLAB. http://www.mathworks.com. Accessed 10 Jan 2019
meteoblue: Archivo meteorológico Madrid. https://www.meteoblue.com/es/tiempo/pronostico/archive/madrid_espa%C3%B1a_3117735. Accessed 23 Jan 2019
Pasquill, F., Michael, P.: Atmospheric Diffusion, 2nd edition. Phys. Today 30, 55 (1977). https://doi.org/10.1063/1.3037599
World Health Organization: Air Pollution. https://www.who.int/airpollution/ambient/health-impacts/en/. Accessed 23 Jan 2019
Zadeh, L.: Fuzzy sets. Inf. Control 8(3), 338–353 (1965). https://doi.org/10.1016/S0019-9958(65)90241-X
Author information
Authors and Affiliations
Corresponding author
Editor information
Editors and Affiliations
Rights and permissions
Copyright information
© 2019 Springer Nature Switzerland AG
About this paper

Cite this paper
Macià, H., Díaz, G., Boubeta-Puig, J., Valero, E., Valero, V. (2019). Combining Fuzzy Logic and CEP Technology to Improve Air Quality in Cities. In: Rodrigues, J., et al. Computational Science – ICCS 2019. ICCS 2019. Lecture Notes in Computer Science(), vol 11540. Springer, Cham. https://doi.org/10.1007/978-3-030-22750-0_51
Download citation
DOI: https://doi.org/10.1007/978-3-030-22750-0_51
Published:
Publisher Name: Springer, Cham
Print ISBN: 978-3-030-22749-4
Online ISBN: 978-3-030-22750-0
eBook Packages: Computer ScienceComputer Science (R0)