
Abstract
Diffusion MRI tractography produces massive sets of streamlines that contain a wealth of information on brain connections. The size of these datasets creates a need for automated clustering methods to group the streamlines into anatomically meaningful bundles. Conventional clustering techniques group streamlines based on their spatial coordinates. Neuroanatomists, however, define white-matter bundles based on the anatomical structures that they go through or next to, rather than their spatial coordinates. Thus we propose a similarity metric for clustering streamlines based on their position relative to cortical and subcortical brain regions. We incorporate this metric into a hierarchical clustering algorithm and compare it to a metric that relies on Euclidean distance, using data from the Human Connectome Project. We show that the anatomical similarity metric leads to a \(20\,\%\) improvement in the agreement of clustering results with manually labeled tracts, without introducing prior information from a tract atlas into the clustering.
You have full access to this open access chapter, Download conference paper PDF
Keywords
1 Introduction
Diffusion MRI (dMRI) allows us to estimate the preferential direction of water molecule diffusion at each voxel in white matter (WM). Tractography algorithms follow these directions to reconstruct continuous paths of diffusion. The most common approach to segmenting WM from dMRI data is to use every voxel in the brain as a seed for tractography and to group the resulting streamlines into bundles. Recent advances in dMRI acquisition hardware and software have increased both spatial and angular resolution, yielding large tractography datasets that are difficult to parse manually. This creates a need for computational methods that can extract anatomically meaningful bundles automatically.
Typical methods for unsupervised clustering of streamlines use similarity measures based on spatial coordinates [1–3]. This is not consistent with the approach followed by neuroanatomists, who define WM bundles based on the brain structures that they go through or next to, rather than their spatial coordinates in a template space. Our goal is to develop a similarity measure that mimics this approach, comparing streamlines based on their anatomical neighborhood. Previous attempts to incorporate anatomical information in streamline clustering mostly used the termination regions of the streamlines, either in a post-hoc manner [3] or in the similarity metric itself [4, 5]. The similarity measure that we propose in this work includes a detailed description of all the regions that form the anatomical neighborhood of a streamline, everywhere along its trajectory. Such a description was previously used to incorporate prior information from a set of training subjects in the tractography step itself [6]. However, that was a supervised approach, limited to a set of predefined bundles from an atlas.
We incorporate the proposed anatomical similarity measure into a hierarchical spectral clustering algorithm [1–3]. The benefit of a hierarchical approach is that it models the structure of large WM tracts, which are known to be subdivided into multiple smaller bundles. We compare our similarity metric to one based on Euclidean distance between streamlines, using data from the MGH/UCLA Human Connectome Project. We show that clustering streamlines based on their anatomical neighborhood rather than their spatial coordinates leads to a \(20\,\%\) improvement in the agreement of the clusters with manual labeling by a human rater. Importantly, we achieve this without using prior information from manual labels, which allows us to explore whole-brain structure without being constrained to a predetermined set of bundles.
2 Methods
2.1 Normalized Cuts
Spectral methods approach clustering as a graph partitioning problem. The graph weights, which represent local information, are used to form a similarity matrix. Clusters are defined globally based on the eigenvectors of this matrix. Given a connected graph G, the Normalized Cuts algorithm searches for a graph cut that divides G into sets A and B (\( A\cap B = \emptyset \)), by minimizing similarity between A and B and maximizing similarity within A and B. Clusters are split recursively, generating a top-down hierarchical structure [7].
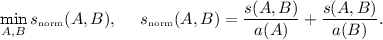
When clustering tractography data, each streamline represents a node on a graph G, and the weight of each edge is the similarity between the nodes it connects. For the purpose of finding the optimal cut of the graph into A and B, we need to quantify the similarity between A and B. This is defined as the sum of the weights of the edges between them: \( s(A,B)= \sum _{u \in A, v \in B} w(u,v)\), where \(w(\cdot ,\cdot )\) is a similarity function between two streamlines. To avoid trivial solutions where A or B is a single isolated node, s is normalized by an association measure \(\text {a}(A)=\sum _{u \in A, t \in G} w(u,t)\). Thus the minimum cut is defined by:
Embedding the problem in the real-valued domain, it can be efficiently solved by the following equation:
where \(\mathbf {D}\) is a diagonal matrix with \(D_{ii} = \sum _{j} w(i,j)\), \(\mathbf {W}\) is the similarity matrix with \(W_{ij} =w(i,j)\), \(\mathbf {z}=\mathbf {D}\mathbf {y}\), and \(\mathbf {D}-\mathbf {W}\) is a Laplacian matrix. The second eigenvector of the Laplacian matrix is a solution to the above equation. The optimal cut is approximated by assigning the i-th node to A if \(y_i >0 \) and to B otherwise [8]. The algorithm is run iteratively until a desired number of clusters is reached or a threshold for minimum cluster size is met.
2.2 Similarity Measures
Let \(\mathbf {f}_i\) be a tractography streamline, defined as a sequence of N points \(\mathbf {x}_{ik} \in \mathbb {R}^3, k=1,\ldots ,N\). Each tractography dataset consists of a set of M streamlines, \(F=\{\mathbf {f}_1,\ldots ,\mathbf {f}_M\}\).
We define a similarity measure based on Euclidean distances between two streamlines \(\mathbf {f}_i\) and \(\mathbf {f}_j\) as:
We incorporate anatomical information in the clustering with a cortical and subcortical segmentation, \(S(\mathbf {x})\), \( \mathbf {x} \in \mathbb {R}\). We then find the segmentation labels that each streamline goes through or next to. Specifically, each point \(\mathbf {x}\) on a streamline is associated with a set of segmentation labels, \(S(\mathbf {x} + d_l(\mathbf {x}) \mathbf {v}_l )\), \(l=1,\ldots ,P\), where \(d_l(\mathbf {x})\) is the minimum \(d > 0\) such that \(S(\mathbf {x} + d \mathbf {v}_l ) \ne S(\mathbf {x} )\). That is, for each point \(\mathbf {x}\), we find the nearest neighboring segmentation labels in a set of directions \(\mathbf {v}_l\), \(l=1,\ldots ,P\). For a neighborhood of \(P=26\) elements, \(\mathbf {v}_l =[ e_1,e_2,e_3 ]\), where \(e_{1,2,3} \in \{-1,0,1\}\). In the case of \(e_1=e_2=e_3=0\), we get the label that the streamline goes through. In all other cases we get its neighboring labels.
For each neighborhood element \(l=1,\ldots ,P\), we compute a histogram \(\mathbf {H}_{il}\) that represents the frequency with which different segmentation labels are the l-th neighbor across all points on the i-th streamline. We then define our anatomical similarity between two streamlines \(\mathbf {f}_i\) and \(\mathbf {f}_j\) as:
where \(\langle \cdot ,\cdot \rangle \) is the inner product, and \(L_i\), \(L_j\) are the sets of all neighboring labels for streamlines \(\mathbf {f}_i\), \(\mathbf {f}_j\). The normalization term \(| L_i \cap L_j |\), which is the number of common neighbors between the streamlines, penalizes trivial streamlines with too few neighbors. The sum in the above equation can be seen as the joint probability of the anatomical neighborhoods of two streamlines.
3 Results
3.1 Data Analysis
We used dMRI and structural MRI (sMRI) data from 32 healthy subjects, scanned as part of the Human Connectome Project (humanconnectomeproject.org). The data was acquired with the MGH Siemens Connectom, a Skyra 3T MRI system with a custom gradient capable of maximum strength 300 mT/m and slew rate 200 T/m/s. The sMRI data was acquired with MEMPRAGE [9], TR=2530 ms, TE=1.15 ms, TI=1100 ms, 1 mm isotropic resolution. The dMRI data was acquired with 2D EPI, TR = 8800 ms, TE=57.0 ms, 1.5 mm isotropic resolution, 512 gradient directions, \(b_{max}=10,000\,\text {s/mm}^2\).
We reconstructed orientation distribution functions using the generalized q-sampling imaging model [10] and performed deterministic tractography using DSI Studio [11]. We obtained a total of 500 k streamlines. As we are interested in long-range connections, and to make computations tractable, we excluded any streamlines shorter than 55 mm, leaving on the order of 100 k streamlines per subject. Streamlines were then downsampled to \(N=10\) equispaced points.
For comparison with unsupervised clustering, a trained rater labeled the 18 major WM bundles manually for each subject: corticospinal tract (cst), inferior longitudinal fasciculus (ilf), uncinate fasciculus (unc), anterior thalamic radiation (atr), cingulum - supracallosal bundle (ccg), cingulum - infracallosal (angular) bundle (cab), superior longitudinal fasciculus - parietal bundle (slfp), superior longitudinal fasciculus - temporal bundle (slft), corpus callosum - forceps major (fmaj), corpus callosum - forceps minor (fmin) [12].
Each subject’s dMRI and sMRI data was co-registered with an affine transformation. The anatomical segmentation was obtained by processing the sMRI data with the automated cortical parcellation and subcortical segmentation tools in FreeSurfer [13, 14]. In addition, subcortical WM labels were defined by classifying each WM voxel that was within 5 mm from the cortex based on its nearest cortical label. This resulted in a total of 261 cortical and subcortical labels.
We performed unsupervised clustering with the two similarity measures described in the previous section. For the anatomical similarity measure we evaluated neighborhoods with 6, 14 and 26 elements. Due to space constraints, we show here results with the 26-element neighborhood only as it performed best.
We iterated the clustering algorithm until a total of 200 clusters were generated. To evaluate the algorithm for different numbers of clusters, we pruned the hierarchical clustering tree to keep the first 75, 100, 125, 150 or 200 clusters.
3.2 Comparison with Manual Labeling
We use the 18 manually labeled bundles to evaluate correspondence between unsupervised clustering and labeling by a human rater. We compare the Dice coefficient [15] between each manually labeled bundle and the union of all clusters for which at least \(5\,\%\) of streamlines belong to the manually labeled bundle. Figure 1(a) shows the average Dice coefficient over all 18 tracts and 32 subjects, as a function of the total number of clusters. Figure 1(b) shows the average Dice coefficient over all subjects by tract, when the total number of clusters is 200. The anatomical similarity measure is \(20\,\%\) better than the Euclidean similarity measure in terms of its agreement with bundles defined by a human rater. We also compute homogeneity and completeness, two metrics that are commonly used to evaluate clustering quality [16]. In Fig. 2 we show homogeneity (a) and completeness (b) for both the anatomical and Euclidean similarity measure. This comparison takes into account only streamlines that belong to one of the manually labeled tracts, as it requires ground truth classes. Our anatomical similarity measure outperforms the Euclidean similarity measure in both homogeneity and completeness (\(p\,<\,.0001\)).

(a) Average Dice coefficient of clusters and manually labeled tracts over 18 tracts and 32 subjects, as a function of the total number of clusters. (b) Average Dice coefficient over all subjects by tract, when the total number of clusters is 200.

Average homogeneity (a) and completenes (b) over 18 tracts and 32 subjects, as a function of the number of clusters.
3.3 Anatomical and Spatial Consistency of Clusters
One might expect streamlines that are close to each other in Euclidean space to also have common anatomical neighbors, and vice versa. Here we evaluate the extent to which streamlines that are clustered based on the anatomical similarity metric \(w_{\tiny {\textsc {a}}}\) are also similar with respect to the Euclidean similarity metric \(w_{\tiny {\textsc {e}}}\) and vice versa. To this end, we calculate the average of all streamlines in a cluster, and find the streamline closest to this average. We refer to this streamline as the centroid of the cluster. We then evaluate \(w_{\tiny {\textsc {e}}}\) and \(w_{\tiny {\textsc {a}}}\) between every element in a cluster and the cluster centroid. Average similarities are shown in Fig. 3. Figure 3(a) shows plots of \(w_{\tiny {\textsc {e}}}\) for clusters derived by optimizing either \(w_{\tiny {\textsc {e}}}\) or \(w_{\tiny {\textsc {a}}}\). Figure 3(b) shows plots of \(w_{\tiny {\textsc {a}}}\) for clusters derived by optimizing either \(w_{\tiny {\textsc {e}}}\) or \(w_{\tiny {\textsc {a}}}\). Of course we expect that the \(w_{\tiny {\textsc {e}}}\)-optimal clusters will have higher \(w_{\tiny {\textsc {e}}}\) than the \(w_{\tiny {\textsc {a}}}\)-optimal clusters, and vice versa. This is confirmed in the plots. However, we find that the \(w_{\tiny {\textsc {a}}}\)-optimal clusters are also near-optimal in terms of \(w_{\tiny {\textsc {e}}}\) but the reverse is not true. Based on a two-way analysis of variance, where the factors are the clustering methods and the number of clusters, we find that the difference in \(w_{\tiny {\textsc {e}}}\) between the \(w_{\tiny {\textsc {a}}}\)-optimal clusters and the \(w_{\tiny {\textsc {e}}}\)-optimal clusters is not statistically significant (\(p = .48\)), whereas the difference in \(w_{\tiny {\textsc {a}}}\) between them is (\(p < .0001\)). This implies that, while \(w_{\tiny {\textsc {a}}}\) tends to group together streamlines that are also close to each other in the Euclidean space, \(w_{\tiny {\textsc {e}}}\) does not necessarily yield clusters that are anatomically consistent.

Average Euclidean similarity (a) and anatomical similarity (b) for each of the two clustering methods, as a function of the number of clusters.
In Fig. 4 we show, for four pairs of anatomical ROIs, the clusters for which at least 5 % of streamlines pass through both ROIs when the number of clusters is 200. The Euclidean similarity measure produces noisier and less anatomically consistent clusters than the anatomical similarity measure. For example, streamlines that lie on opposite sides of the midline but are close to each other in space may be erroneously clustered together by \(w_{\tiny {\textsc {e}}}\), but not by \(w_{\tiny {\textsc {a}}}\) (see Fig. 4(d)).

Union of clusters containing at least 5 % of streamlines passing through a pair of anatomical ROIs: (a) precentral and brainstem, (b) superior parietal and brainstem, (c) superior temporal and precentral, (d) isthmus cingulate and rostral anterior cingulate
To evaluate the robustness of our method to the accuracy of the anatomical segmentation, we randomly perturbed the label borders by 1.5 mm. This experiment did not lead to significant changes in the performance of our method (\(p=.7\) for homogeneity, .7 for completeness, .3 for Dice). Although we show results only on the long-range (>55 mm) streamlines to reduce computation, preliminary tests on full tractography datasets indicate that the algorithm also works when shorter streamlines are included. The algorithm runs in \(\sim \)45 min with the anatomical similarity measure when all anatomical neighbors are parallelized. It runs in \(\sim \)1 h when the Euclidean similarity measure is used. Segmentations are computed in \(\sim \)12 h per subject.
4 Conclusion
We present a method for unsupervised hierarchical clustering of dMRI tractography data based on anatomical similarity. We compare this to the conventional approach of using a similarity based on Euclidean distance. We find that the anatomical similarity yields results more consistent with manual labeling. That is, without introducing any training data from human raters, we are able to obtain results that are in closer agreement with such a rater. We achieve this simply by using a similarity metric that is better at replicating how a human with neuroanatomical expertise would segment WM tracts, i.e., based on the anatomical structures that they either intersect or neighbor, everywhere along the tracts’ trajectory. This allows us to obtain anatomically meaningful WM bundles without being limited to a small set of tracts included in an atlas. We expect that our approach, which relies on the relative positions between streamlines and a set of anatomical structures that is encountered in all subjects, will allow us to identify bundles that are consistent across subjects and populations. We plan to investigate this further in the future.
References
O’Donnell, L., et al.: Automatic tractography segmentation using a high-dimensional white matter atlas. IEEE Trans. Med. Imaging 26, 1562–1575 (2007)
Guevara, P., et al.: Robust clustering of massive tractography datasets. NeuroImage 54(3), 1993–1975 (2010)
Wassermann, D., et al.: Unsupervised white matter fiber clustering and tract probability map generation: applications of a Gaussian process framework for white matter fibers. NeuroImage 51(1), 228–241 (2010)
Wang, Q., et al.: Application of neuroanatomical features to tractography clustering. Hum. Brain Mapp. 34(9), 2089–2102 (2013)
Tunc, B., et al.: Automated tract extraction via atlas based adaptive clustering. NeuroImage 102, Part 2:596–607 (2014)
Yendiki, A., et al.: Automated probabilistic reconstruction of white-matter pathways in health and disease using an atlas of the underlying anatomy. Front. Neuroinform. 5(23), 12–23 (2011)
Shi, J., et al.: Normalized cuts and image segmentation. IEEE Trans. Pattern Anal. Mach. Intell. 22(8), 888–905 (2000)
Golub, G.H., et al.: Matrix Computations. Johns Hopkins University, Baltimore (1996)
van der Kouwe, A., et al.: Brain morphometry with multiecho MPRAGE. NeuroImage 40(2), 559–569 (2008)
Yeh, F.C., et al.: Generalized q sampling imaging. IEEE Trans. Med. Imaging 29(9), 1626–1635 (2010)
Yeh, F.C., et al.: Deterministic diffusion fiber tracking improved by quantitative anisotropy. PLoS ONE 8(11), 11 (2013)
Wakana, S.: Reproducibility of quantitative tractography methods applied to cerebral white matter. NeuroImage 36(3), 630–644 (2007)
Fischl, B., et al.: Whole brain segmentation: automated labeling of neuroanatomical structures in the human brain. Neuron 33(3), 341–355 (2002)
Fischl, B., et al.: Automatically parcellating the human cerebral cortex. Cereb. Cortex 14(1), 11–22 (2004)
Dice, L.R.: Measures of the amount of ecologic association between species. Ecology 26(3), 297–302 (1945)
Rosenberg, A., et al.: V-measure: a conditional entropy-based external cluster evaluation measure. In: Proceedings of 2007 Joint Conference on Empirical Methods in Natural Language Processing and Computational Natural Language Learning (EMNLP-CoNLL), pp. 410–420 (2007)
Acknowledgement
This research was supported by the Boston Adolescent Neuroimaging of Depression and Anxiety project (U01-MH108168), and was made possible by the resources provided by Shared Instrumentation Grants 1S10RR023401, 1S10RR019307, and 1S10RR023043. Data were provided by the MGH/UCLA Human Connectome Project (5U01-MH093765).
Author information
Authors and Affiliations
Corresponding author
Editor information
Editors and Affiliations
Rights and permissions
Copyright information
© 2016 Springer International Publishing AG
About this paper
Cite this paper
Siless, V., Chang, K., Fischl, B., Yendiki, A. (2016). Hierarchical Clustering of Tractography Streamlines Based on Anatomical Similarity. In: Ourselin, S., Joskowicz, L., Sabuncu, M., Unal, G., Wells, W. (eds) Medical Image Computing and Computer-Assisted Intervention – MICCAI 2016. MICCAI 2016. Lecture Notes in Computer Science(), vol 9900. Springer, Cham. https://doi.org/10.1007/978-3-319-46720-7_22
Download citation
DOI: https://doi.org/10.1007/978-3-319-46720-7_22
Published:
Publisher Name: Springer, Cham
Print ISBN: 978-3-319-46719-1
Online ISBN: 978-3-319-46720-7
eBook Packages: Computer ScienceComputer Science (R0)