
Abstract
According to Takashina’s research on art history, Ukiyo-e (Japanese woodblock prints) painters began to use the vanishing point as a mechanism to attract viewer’s point of view. They did this by setting the main motif on the vanishing point. In this study, we attempted to clarify experimentally the effect created by a composition in which a painter draws the main motif on the vanishing point of a one-point perspective. For this purpose, we performed an experiment to measure gaze points in viewing paintings. In the experiment, we presented six paintings: two paintings with main motifs on the vanishing points, two edited paintings in which the main motifs on the vanishing points were deleted, and two paintings with main motifs not at the vanishing points. For each painting, we measured the gaze for 30 s. The number of participants analyzed was 18. We observed that viewers looked more at main motifs on vanishing points than at other regions. The same result was demonstrated even when the main motifs were deleted. We also observed that viewers looked more at the vanishing point than at the main motif, which is not on the vanishing point. This suggests that viewers enjoy the main motif by seeing it within peripheral visual field. In addition, viewers looked more at the vanishing point than at other regions even when there was no main motif originally. These results demonstrate the powerful effect of vanishing points.
You have full access to this open access chapter, Download conference paper PDF
Keywords
1 Introduction
According to Takashina’s research on art history, one-point perspective was originally proposed as a method to draw 3D space on a 2D canvas in Europe [1]. She also pointed out that the vanishing point was a tentative point, which we cannot see and which is set experientially. However, after the introduction of the one-point perspective in Japan in the Yedo era, Ukiyo-e (Japanese woodblock prints) painters began to use the vanishing point as a mechanism to attract viewer’s gaze points by setting the main motifs of their works on the vanishing point. Though we can find few works with such compositions among Western-style paintings, there are many such works in Japan Ukiyo-e in the Yedo and Meiji eras. These can also be found in Western-style oil paintings in the Meiji era in which main motifs were placed on the vanishing points.
In this study, we clarify experimentally the effect of composition in which a painter draws the main motif on the vanishing point of a one-point perspective. For this purpose, we measured gaze points in viewing paintings. For successfully accomplishing this, we used eye-tracking, which has been known to be an effective tool for a long time [2].
We selected four typical paintings as shown in Fig. 1(a) “View of Yamagata City”, an oil painting by Takahashi Yuichi with its main motif on the vanishing point; (b) “Nihonbashi in Edo”, a Ukiyo-e from “Thirty-six Views of Mount Fuji” by Hokusai with its main motif near the vanishing point; (c) “The Bell which Resounds for Ten Thousand Leagues in the Dutch Port of Frankai”, a Ukiyo-e by Utagawa Toyoharu in which we can see influence of the Western one-point perspective; and (d) “Nakanocho in the Yoshiwara, n.d.”, a Ukiyo-e in the formative era by Masanobu Okumura, which he drew with his original perspective inspired from Chinese paintings. In the paintings in Fig. 1(c) and (d), there were originally no main motifs on the vanishing points.

Four typical paintings related to compositions.
2 Experimental Setup
We measured gaze points by using our original eye-tracker as shown in Fig. 2, in which we introduced an aspherical model of the eye [3]. The accuracy of the system was about 0.71° and this can be realized by one point calibration.

Experimental setup using an eye-tracker.
In the experiment, we measured in viewing four paintings shown in Fig. 1. In addition, we prepared two paintings—Fig. 3(a)ʹ View of Yamagata City and Fig. 3(b)ʹ Nihonbashi in Edo—by deleting the main motifs on their vanishing points. By using graphic editor, we removed the Yamagata prefectural office in Fig. 3(a)ʹ and the Edo Castle in Fig. 3(b)ʹ at (near) the vanishing points.

Two edited paintings without main motifs.
We presented these six paintings as stimuli and measured the gaze points in viewing them. First, we calibrated the eye-tracker and presented Fig. 1(a) or Fig. 3(a)ʹ on display for 30 s. Next, we presented a cross shape as a target at the center of the display for 5 s to serve as an interval between the stimuli. When changing images, we displayed a black screen for 2 s. Further, we moved to Fig. 1(b) or and Fig. 3(b)ʹ and the cross-shape interval. Subsequently, we moved to Fig. 1(c), Fig. 1(d), Fig. 1(a) or Fig. 3(a)ʹ, and Fig. 1(b) or and Fig. 3(b)ʹ. We counterbalanced the order of presentation of the edited paintings to avoid order effects. While presenting the paintings, we let the participants view the images freely. We asked participants to look at the cross shape during the interval. We used a 15.6 in. 1920 × 1080 monitor as a stimulus. The distance between the participants and the display was 500 mm. The framerate of the eye-tracker was 15.4 fps. The participants were 41 university or graduate students (average 20.85 in age, SD = 1.25).
Before the analysis, we selected and corrected the data. We used the first and fifth cross shape for data correction. In the following sections, we clarify the procedure used for data selection:
-
(1)
Choosing a participant
-
i.
Removal of outliers
We removed coordinates out of monitor resolution from tracking data as errors. Then, we removed coordinates that were more or less than 1.5 times the distance from the median to the first quartile or third quartile. This is shown in Fig. 4. We defined the remaining data as tracked points.
Fig. 4. 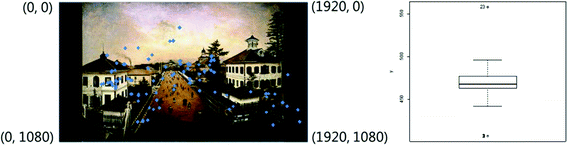
Removal of outliers.
-
ii.
Calculation of median
We calculated the median of both x and y coordinates. We defined the coordinates as the center of measured data obtained during looking at the cross shape. This meant that the measured data included calibration error as bias, and it could be corrected by calculating the difference as shown in Fig. 5.
Fig. 5. 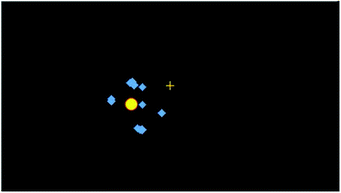
Calculation of median.
-
iii.
Removal of participant
We calculated distances between each tracked point obtained in step i and the center of measured data obtained in step ii. When the distance was over 125 px (2.5° field of view), we considered the tracked points as errors. If the number of errors exceeded 20% in both cross shapes, we removed the participant from the analysis. For this procedure, we used the data obtained from 18 participants (average 21.67 in age, SD = 1.25) (Fig. 6).
Fig. 6. 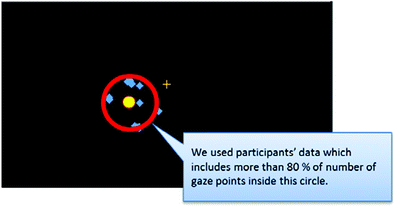
Selection of data obtained from participants.
-
i.


-
(2)
Data correction
We calibrated the data measured by using the difference between the calculated median and the coordinates of the center of the cross shape. Further, we calibrated all the measured data during viewing paintings and used this after-correction data for analysis (Fig. 7).
Fig. 7. 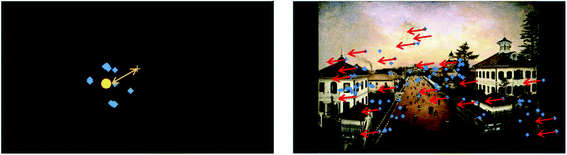
Data correction.

3 Vanishing Region
To confirm the difference among the compositions of the main motifs and their effects on attraction to viewer’s point of view, we determined a vanishing region, which is the internal region of a rectangle located around the vanishing point. For example, in Fig. 1(a) View of Yamagata City, we set a rectangle just around the Yamagata prefectural office, its main motif. Next, we compared the number of gaze points inside and outside the vanishing region. For a quantitative comparison, we divided these numbers by the area (Fig. 8).

Determined vanishing region in View of Yamagata City.
4 Results
Using a two-way analysis of variance, we examined the influence of two independent variables—with or without the main motif, and inside or outside the vanishing region—on the number of gaze points as a dependent variable. Figure 9 shows the results of Figs. 1(a) and 3(a)ʹ View of Yamagata City and of Figs. 1(b) and 3(b)ʹ Nihonbashi in Edo. The results show that viewers look around the vanishing point with or without the main motif. We can see the main effects only inside or outside the vanishing region: (a) F (1,17) = 17.35, p = .001, \( \eta_{p }^{2} \) = .51, (b) F (1,17) = 8.30, p = .01, \( \eta_{p }^{2} \) = .33).

Numbers of gaze points in viewing paintings with main motif on the vanishing point.
Figure 10 shows the results of Fig. 1(c) The Bell which Resounds for Ten Thousand Leagues in the Dutch Port of Frankai and Fig. 1(d) Nakanocho in the Yoshiwara, n.d. The results indicate that the viewers looked more inside the vanishing point than outside. Again, we can see the main effects only inside or outside the vanishing region: F (1,17) = 15.51, p = .001, \( \eta_{p }^{2} \) = .48.

Numbers of gaze points in viewing paintings without main motifs on the vanishing points.
Next, we divided the paintings into small regions: 9 horizontal regions and 16 vertical regions. Each region is 120 × 120 px. Subsequently, we colored each small region by treating the total number of gaze points of all 18 participants as heat maps. Figures 11, 12 and 13 show the results. The number in each small region indicates the rate gaze points where participants looked. The results were similar to those of the two-way analysis of variance and demonstrated that the vanishing regions were attractive.


Rate of numbers of gaze points in (c) and (d).
5 Discussion
As a result of the experiment, we clarified four effects caused by the composition in which painters draw their main motifs on vanishing points.
First, we showed that viewers looked more at the main motif on a vanishing point than at other regions as shown in Figs. 9, 11 and 12. The original idea was proposed by Takashina, but we proved it experimentally. As shown in Fig. 14, this effect is remarkable in case of the painting in Fig. 1(b) Nihonbashi in Edo. According to Takashina, the Edo Castle was arranged just on the vanishing point, and it attracted attention. We can explain this with our experimental results—Mount Fuji, which is the main motif, was arranged within the peripheral visual field of the Edo Castle.

An example of gaze points in viewing Nihonbashi in Edo.
Second, we demonstrated that viewers looked more at the vanishing point than other regions even when we deleted the main motif on the vanishing point as shown in Figs. 9, 11 and 12. As Takashina pointed out, the vanishing point is not a tentative point, but a mechanism to attract viewer’s gaze. Originally, this idea was proposed as a composition in the Yedo era, but it can be concluded that we can see this effect even when there is no main motif.
According to Molnar, a viewer looks more at the center of the picture [4]. However, as shown in Fig. 14, the effect of the vanishing point was stronger than that of the center of the picture. This result shows that the vanishing point comprises the figure of figure-ground.
Third, it was shown that viewers looked more at the vanishing point than the main motif, which is not on the vanishing point, as revealed in the results of Nihonbashi in Edo. Viewers looked more at the Edo Castle than Mt. Fuji. We can see other paintings that use this effect as shown in Fig. 15. We can see the challenge of constructing a new expression when the Western idea of perspective was introduced in the Yedo era in Japan.

Enoshima in Sagami Province—an example in which Mt. Fuji was drawn separately from the vanishing point, and it could be enjoyed by seeing it within the peripheral visual field, which is just the same as the way we see Mt. Fuji.
Forth, viewers looked more at the vanishing point than other regions even when originally there was no main motif as shown in Figs. 10 and 13. This result is a more clear evidence of the second result, because the painters had no idea of how to lead viewer’s gaze point while painting their works. This also should be discussed related to the center effect.
In the future work, we would consider the relationship highlighted by many researchers between gaze, fixation, attention, and what we see, look, and appreciate [5] and would clarify these findings, especially for the analysis of the peripheral visual field.
6 Conclusion
In this study, we clarified experimentally the effect of the compositions in which painters draw their main motifs on the vanishing point in a one-point perspective. For this purpose, we performed an experiment to measure different gaze points in viewing paintings. In the experiment, we presented six paintings: two paintings with main motifs on the vanishing points, two edited paintings in which the main motifs on the vanishing points were deleted, and two paintings with main motifs not at the vanishing points. We measured the gaze for 30 s for each painting. The participant to be analyzed was eighteen. As a result, we clarified that viewers looked more at the main motif on the vanishing point than other regions. They also looked more at the vanishing point when the main motif was deleted. We also clarified that viewers looked more at the vanishing point than the main motif, which is not on the vanishing point. This suggests that viewers enjoy the main motif by seeing it within the peripheral visual field. In addition, viewers looked more at the vanishing point than other regions even when there was no motif originally. These results demonstrate the strong influence of vanishing points.
References
Takashina, E.: Takahashi Yuichi’s view of Yamagata City and the famous views of Yedo. Zinbun Gakuhō J. Humanit. 101, 19–35 (2011). (in Japanese)
Yarbus, A.L.: Eye Movements and Vision. Prenum Press, New York (1967)
Yamamoto, M., Nagamatsu, T., Watanabe, T.: Development of eye-tracking pen display based on stereo bright pupil technique. In: Proceedings of the 2010 Symposium on Eye-Tracking Research & Applications, pp. 165–168 (2000)
Molnar, F.: About the role of visual exploration in aesthetics. In: Advances in Intrinsic Motivation and Aesthetics, pp. 385–413 (1981)
Wooding, D.S.: Fixation maps: quantifiying eye-movement traces. In: Proceedings of ETRA 2002, pp. 31–36 (2002)
Acknowledgement
This research was partially supported by JSPS KAKENHI 16H03225, 16H02860, etc.
Author information
Authors and Affiliations
Corresponding author
Editor information
Editors and Affiliations
Rights and permissions
Copyright information
© 2017 Springer International Publishing AG
About this paper
Cite this paper
Matsuo, R., Sugimoto, H., Sakata, M., Yamamoto, M. (2017). A Study on Extracting Attractive Regions from One-Point Perspective Paintings. In: Kurosu, M. (eds) Human-Computer Interaction. User Interface Design, Development and Multimodality. HCI 2017. Lecture Notes in Computer Science(), vol 10271. Springer, Cham. https://doi.org/10.1007/978-3-319-58071-5_37
Download citation
DOI: https://doi.org/10.1007/978-3-319-58071-5_37
Published:
Publisher Name: Springer, Cham
Print ISBN: 978-3-319-58070-8
Online ISBN: 978-3-319-58071-5
eBook Packages: Computer ScienceComputer Science (R0)