
Abstract
A common understanding of the state of a research project is vital for project planning and decision making in interdisciplinary research cooperation. Surveys in a production technology based environment shows, that project planning and decision support tools exist and are known, however they are not used in practice. Interviews indicate that the poor usage of such tools originate from the complexity of the tools and that there is no perceptible added value for the performing researcher in using these tools. A requirements analysis is performed to extract the non-functional and functional requirements of a web-based project planning tool, which is developed and tested in an interdisciplinary research cooperation, called the Cluster of Excellence for production research at the RWTH Aachen University. User interviews show that the acceptance of such tools is strongly related to the presence of all features that are considered vital by the user for project planning and decision support.
You have full access to this open access chapter, Download conference paper PDF
Keywords
1 Introduction
In larger research collaborations, scientists from many disciplines are involved in research planning and project realization. In the occurrence of decision points during any project phase, it is vital to provide the essential amount of information on the state of the project to all related participants. To visualize the current state of the project, an intuitively understandable representation of research processes in interdisciplinary research cooperation is implemented as a web-based research planning and representation tool. The so called FlowChart tool is developed, implemented and tested inside a large research collaboration, the Cluster of Excellence (CoE) for production research at the RWTH Aachen University [1] which consists of more than 150 researchers from various departments and disciplines situated in the broad field of production technology. The FlowChart tool displays the initial state, the objectives, the current state and the interlinking of the work packages in one single view. The aim of this tool is to provide a basis for decision making during project meetings and to support the planning process during the whole project. The usability, acceptance and added value to the project is object of current research.
2 Problem Definition
Scientific research projects in interdisciplinary research collaborations bring multiple partners from different scientific disciplines and scientific cultural background together. During project initialization, planning, realization and finalization a clear communication and common understanding about scientific objectives and the allocation of work in the project is vital for project success. Decision points play an important role during the project realization where different options have to be evaluated and the best possible option to realize the project objectives has to be chosen. This usually requires a modification of the project plan by adding or removing work packages. Also the reordering of work packages or adjustment of work package durations might become necessary during the project. This process of modifying the project plan reflects the iterative trial and error approach of scientific research and is typical for collaborative research projects. These readjustments in the project plan usually occur during project meetings, when multiple partners from multiple institutions are present and discuss the progress of the project. Not all partners have the same knowledge about project details and the progress inside the individual work packages, therefor it is necessary to provide an as simple as possible pictorial representation of the project state to offer all project partners the best possible decision support to find the best possible solution to achieve the project objectives.
Project planning tools of different complexity exist, however the acceptance of existing tools in the investigated scientific community suffers from the lack of flexibility. A strong disadvantage of the tools examined is that the added value of the effort to use these tools does not become noticeable to the research assistants that carry out the work inside the project. The essential character of scientific working, fast iterations, systematic trial and error and rapid adjustments, is not represented by tools currently on the market.
3 State of the Art
Tools to generate project plans and extend all elements of a project by additional information exist. The effectiveness of such tools on project or even multi-project management is analyzed by Jaafri and Manivong [2], who introduces the term Smart Project Management Information Systems (smart PMIS). As essential requirements of SPMISs Jaafri invokes (1) management and real time adjustment of all important data belonging to an individual project (2) integration of all information along the project life cycle to provide decision support at any phase of the project (3) processing, reporting, alerts and measurement of the impact of decisions (4) proactivity facilitation by objective functions like total life cycle cost and (5) inter-operability and compatibility to existing systems and to provide all partners of the project team with the necessary amount of information. Jaafari’s paper includes 25 functions of an idealized PMIS. Raymond and Bergeron [3] studies the influence of PMISs on project leaders and project success according to a success model including five components: (1) quality of the system (2) quality of the results provided by the system (3) usability and acceptance (4) impact on individual success and (5) impact on project success. Raymond carries out a quantitative analysis by questionnaires and draws the conclusion, that PMISs contribute significantly to project success.
Ngai and Chan [4] posts five essential requirements for Knowledge Management Systems (KMS): (1) web-based system to provide easy access via a web browser (2) scalability to manage thousands of users (3) access control and security of the system (4) customizability of the user interface (5) integration into the current working environment. Ngai also provides guidelines for the evaluation of KMSs using the Analytic Hierarchy Process method, which is based on pairwise comparisons between distinct tools.
Marques et al. [5] provides a metric for fine grained performance measurement based on (1) key performance indicators (2) effectiveness, efficiency and relevance and (3) tasks. The resulting performance cube is intended to provide dedicated decision support for project managers. Caniëls and Bakens [6] detects a spillover effect in multi-project PMISs, if the system offers poor information quality. Project managers tend to assume poor information quality by the whole system, if poor information quality was provided for single projects. Therefor it is of major importance that PMISs offer good quality information to become an accepted tool for decision support. Tromp and Homan [7] analyzed the implementation phase of a PMIS using the complex responsive process approach and concluded that the success and acceptance of a PMIS highly depends on the quality of information that can be retrieved from the system.
4 Methodology
Interview studies show, that the principal reasons for missing acceptance of the existing tools refer to poor usability for untrained users and the missing ability of these tools to adapt and track changes within the project. To provide a proper project planning and decision making tool for research projects and to analyze the essential objectives usability, acceptance and added value, a completely new tool is implemented and tested in the Cluster of Excellence. A requirements analysis carried out by expert interviews revealed three essential needs of such a tool: view of the current project state on a single screen, an easy and intuitively usable interface and the ability to rapidly change the planning of a project and keep track of these changes. Focusing on the usability and the acceptance aspect, additional requirements include seamless integration into existing work flows and compatibility to commonly used tools, little or even zero learning effort and easy access to the tool itself.
4.1 Requirements Analysis
During a scientific colloquium of the Cluster of Excellence a World Café survey [8] was performed to collect keywords about knowledge management tools in scientific environments. Around 80 active researchers took part in this colloquium and during coffee breaks, they were asked to write down small notes regarding three questions: (1) Which tools and methods are being used at your institution for your internal knowledge management? (2) Which tools and concepts you can imagine to enhance the knowledge management inside the Cluster of Excellence? (3) Which requirements a web-based scientific cooperation platform should meet? The answers for question 1 are grouped into four classes:
-
Software solutions: Wiki, Jammar, Citavi, internal web pages, version control systems
-
Documentation: QM-documents, handbooks, publication collections
-
Social: Conversations, regular know-how transfer meetings, regulars’ table, after work beer
-
Other: Work instructions, international conference visits
The following concepts for knowledge-management inside the cluster were written down: Know-how transfer meetings, chat programs, journal-club, regular knowledge exchange meetings, StackExchange (as example).
As requirements for a web-based scientific cooperation portal these notes were indicated: single-sign on, “that it makes me smarter”, RSS-feeds, email notifications, easy to use, modification of files online without downloading them, WebDAV file space.
Using these keywords as a starting point for a requirements analysis on knowledge management and knowledge transfer systems, expert interviews were planned and conducted in the institution of the author.
4.2 Expert Interviews
The interview session was divided into three parts: (1) Which type of project planning do you perform today? (2) Which demands do you have for an ideal project planning tool? (3) What are the reasons, that project planning tools are not well established in scientific environments?
The interviewed subjects were research assistants, senior scientists and the leading professor of the modeling and simulation group at Fraunhofer institute for laser technology. The first question block also included a description of typical research projects. Three typical scenarios were identified:
-
1.
Individual project performed by one individual scientist. Typically these type project is publicly funded and proposed, planned, performed and reported by one single scientist with supervision of his/her professor. These type of project usually requires little planning effort during project realization since only one person is involved and a clear research plan has been formulated in the proposal.
-
2.
Bilateral projects including two project partners from two different institutions. This type of project is either publicly funded or university/industry co-operation, funded by the industrial partner. Especially for the latter case there is a strong need for proper project planning as industry partners often demand clear project planning and monitoring during the realization as these partners have to justify the use of funds to their administration. Bilateral projects including industry partners often have short project durations in the order of several months. In an ideal case there are multiple consecutive projects between two research partners, which depict the rapid development cycles in industrial environments.
-
3.
Multi-lateral projects in larger research collaborations, usually publicly funded including partners from university and sometimes also from industry. These projects are usually split into multiple sub-projects, so that the number of partners involved in a specific research project is comparable to a bilateral project. A major difference to industry funded projects is the project duration which is often split into multiple phases, typically in the order of several years.
As tools known for project management there were only three different types: Microsoft Project, Excel (GANTT-charts) and the written project plan in the corresponding research proposal. Another pictorial representation of a research plan was performed in Microsoft PowerPoint and is depicted in Fig. 1. The latter representation was the most used one in the inspected research group and provided the base for the developed FlowChart tool.

Example of an initial version of a research plan used in the analyzed research group. The plan is generated using Microsoft PowerPoint.
As demands for an ideal project planning tool in scientific research environments the following non-functional requirements were summarized from the interviews: decentralized and easy access including per project permissions, no additional software requirements, intuitive and easy to learn user interface, easy updateable project plans “modifications in less than a minute, including access to the tool itself”, agile project planning during project meetings, tracking of changes during project realization and compatibility to tools currently used. These non-functional requirements were translated into functional requirements in the form of Volere SnowCards [9]. The essential requirements are:
-
1.
Client/server architecture using a web-frontend: to meet the easy and decentralized access and the use of available software requirement, the only remaining option is to create the tool as a web application.
-
2.
Single project view: the tool should provide a view of the project state on a single screen without the need to scroll, zoom or hide elements from the project plan.
-
3.
Initial situation: the project view should provide a dedicated areal to depict the starting point of a project. This is important to demonstrate project partners the state and value of preliminary works before the project starts.
-
4.
Objectives: the project view should provide a dedicated region for project objectives. The representation of project objectives should ensure that all steps during project planning are focused to the project objectives.
-
5.
Time schedule: initial situation and project objectives should be connected by a time schedule on which work package boxes can be allocated.
-
6.
Grouping: The time schedule should include one or more regions to represent different resources or partners involved in the project. These resources can either represent different topics (model, experiment, evaluation) or different project partners. For a better distinguishability the resource regions should be assigned perpendicular to the separators of the time schedule. For example horizontal resource bars placed below vertical month separators of the time schedule. (see Fig. 2)
Fig. 2. 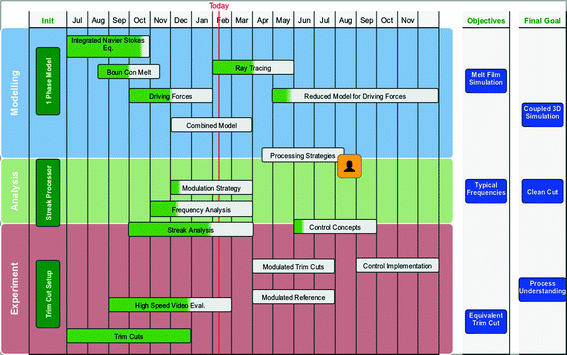
View of the new developed FlowChart tool
-
7.
Work packages: individual work packages should be placed on the time schedule. The left and right edges of a work package indicate start and end date, the vertical position in the time-schedule displays the association to an individual resource. Using gradient filling, the fulfillment level of a work package can be represented.
-
8.
Dependencies: relationships between work packages should be indicated by arrows. The direction of the arrow expresses a dependency between the work packages and the system should be aware of this dependency, so alerts can be implemented if there is a risk detected, that certain dependencies cannot be met.
-
9.
Resource allocation: resources like researchers or machines should be assignable to individual work packages. If resources are multiply assigned in different projects, the system should post an alert.
-
10.
Points of interest: important events inside the project like milestone meetings or decision points have to be clearly indicated in the project plan.
-
11.
Change tracking: all changes undertaken in the project plan should be tracked and browsable for the user. An element-wise undo function should exist and a snapshot-functionality to create revisions should exist.
-
12.
Comments: all elements should include optional comments fields, where every user can post comments for this element.

Taking these requirements into account a class and database design of the FlowChart tool has been carried out and the tool was implemented as web application.
4.3 Implementation Cycles
As the FlowChart tool should depict the agile character of project planning in a research project, an agile implementation approach was chosen. After the realization of essential features, the tools was rolled out for beta-testing and small usage studies aimed at the latest implemented feature were conducted. The results of these studies were directly used for bug fixing and enhancement of the tool. As soon as the results were satisfying, the next feature was implemented, chosen by the result of the question which feature is missed the most. One important finding from these implementation cycles is, that an already working tool is not used by the researchers as long as they do not experience a clear advantage of the planning tool for their daily work.
4.4 Usability Studies
The usability studied of the tool are carried out as expert interviews at the end of the implementation cycles qualitatively. As the tool has not reached its full functionality today, the acceptance of the tool is not that high, that an elaborated usage study incorporating a larger test group can be performed. As the participation on the test phase of the tool is on a voluntary base, the user has to experience a direct advantage on the use of the tool. The expectation is, that as soon as the tool provides good planning capabilities for research projects, the users will accept it and are willing to take part in a survey. Therefor the acceptance and usability of the tool is analyzed by short interviews with a small number of subjects to gain direct feedback on the capabilities of the tool. These interviews are split into three parts: (1) Solution of specific tasks like create a new flow-chart or create new work packages (2) questions about the performance of the task (3) general questions about the tool and its ability to provide support in project planning and decision making. The last part also includes a question about the feature that should be implemented next.
5 Results
The substantial result of the initial survey is, that tools for project planning exist and are known to the users. However they are not used in scientific environments because they do not offer a perceptible added value for the researcher. To cope with the agile character of iterative trial and error cycles in scientific projects a new tool has been implemented to support project planning and decision making.
5.1 The FlowChart Tool
To meet the requirements gathered by the requirements analysis, the FlowChart tool is implemented as a web based application which is integrated into the scientific corporation portal [10] of the Cluster of Excellence. Its client-server approach allows the decentralized view and modification of research plans interactively. To track user actions and update all connected clients, modern web techniques like Asynchronous Javascript and XML (AJAX) and web sockets are used to ensure that all users share the same view. All user actions are recorded in a central database as individual changelets and sent to all connected clients. Due to this changelet approach, the change history of every FlowChart item can be tracked and inspected by every user who has access to the corresponding project.
Details of Implementation.
Ruby on Rails version 5 [11] is used as web application development framework. It is designed for agile web development using a strict model-view-control pattern to separate back-end and front-end parts of the implementation. The front-end view makes heavy use of bootstrap [11] design elements for menus and dialogs. The FlowChart view itself is utilized as a scalable vector graphics (SVG) which is modified via JavaScript. To manage the interactions between the SVG flow-chart elements, the Data Driven Documents JavaScript library D3js is used. The d3 library provides an easy to use interface to create callback functions for almost any user interaction on any of the SVG elements visible for the user. User actions that need to be transferred to the server are sent with the Asynchronous JavaScript and XML technique. These browser built-in objects provide callback functions that can handle the answer of the server, so that error or success messages can be generated. Since the FlowChart tool is a web based application, a concurrent access of one single flow-chart may occur, if two users open the same project at a time and modify the content of one of the elements inside. To prevent outdated information in the view of one of the users, changes performed by any user connected to a specific flow-chart have to be transmitted to all users, who have an active view of this flow-chart. Therefor a return-channel from the server to the browser is required. Basically there exist four different approaches to provide such a return-channel: short polling, long polling, server-sent events and web-sockets. For reasons of performance and complexity of the implementation, the polling approaches have been dismissed. An early implementation using server-sent events (SSE) worked as intended. However modern virus scanning software including a download protection feature interpret the SSE channel as a never-ending download and therefor do not hand over retrieved data packages directly to the front-end. This fact makes SSEs unsuitable for real-time updates of changes performed by a single user, if such a download protection is activated. Because of this, the only remaining technique for the return channel is web-sockets. Thankfully the latest version of the Ruby on Rails frame-work provides an easy to use mechanism for web-sockets, called action cables. These incorporate easy-to-use real-time features into the corresponding application and are supported by all modern browsers, virus scanners, proxy servers and web servers.
Change Tracking.
An essential feature of an agile project management system is the ability to perform changes on project tasks in an easy manner and track these changes along the whole project duration. The FlowChart tool allows the modification of project tasks or other elements by direct user interaction. Each element inside the flow-chart view carries various properties (e.g. start date, end date, fulfillment level, y-position) which are initialized upon creation of the object. By modifying the object, for example drag the right edge of a project task box to another end date, specific properties of the object are changed. The collection of changed properties by one individual change action is called ChangeLet and is assigned to the corresponding flow-chart element. As an example the motion of a project task inside the flow-chart view will change up to three properties: start-date, end-date and y-position. The new values of these properties are stored along with the user-id of the logged-in user, the date and time of the change action and a boolean flag if this ChangeLet is applied or not. This allows an element-wise undo action and also an element-wise history of changes. By storing the ids of not applied ChangeLets and the id of the latest ChangeLet a revision feature for flow-charts can be easily implemented. These revisions allow users to save and restore states of flow-charts.
5.2 Missing Features
According to the initial requirements analysis, there are still features that are missing for a complete version of the tool. Interviews indicate that the acceptance of the tool would rise instantly, if these features were implemented. Users even accept unintuitive work flows or a handling of the tool that is considered complicated, as long as all required features are supported. Any missing feature that is considered vital by the user eliminates the acceptance of the tool and the willingness of the user to use this tool in practice. For the current version of the FlowChart tool the missing features which are considered vital are:
-
Arrows: users which are familiar with Microsoft PowerPoint expect an arrow-tool feature, which connects boxes by placing the arrow start and end nodes on the frame of the boxes.
-
Free-form boxes and texts: beyond the strict set of elements provided by the FlowChart tool, users expect the capability of the tool to provide free elements like boxes and texts that can be placed anywhere inside the flow-chart view to add customized highlights.
-
PowerPoint export: as the flow-chart view itself is provided as SVG graphics, an export as SVG or PDF is available. An export as PNG picture is also possible, however users expect a PowerPoint export which allows modification of the individual elements inside the flow-chart in PowerPoint slides.
Especially the last expectation posed by the users is critical. The intention of the user is to include the current state of the project into slides for a project report or a project meeting. This expectation is understandable, however it breaks the idea of a centralized project planning and decision tool to cut off the capability of direct user interaction and agile project planning during project meetings. As the tool relies on the acceptance of the user to be used in practice, this feature will be added in future versions of the FlowChart tool, however there will be no import feature for project plans changed in PowerPoint slides.
Other features that were collected in the requirements analysis are considered as important by the users, but not vital for the acceptance of the tool and indicated as “nice-to-haves”. These include resource allocation to work packages and conflict detection mechanisms inside one project and across multiple projects, to check if resources are over-allocated.
6 Conclusion and Outlook
The tool supports communication behavior between project partners and tightens cooperation activities identifying the fast and frugal research path towards the objectives or even adapting the objectives itself. In particular, the planning process be-comes flexible enough to follow the propositions during repetitive project meetings.
A first working version of the implemented FlowChart tool is installed as web-app on the collaboration portal of the Cluster of Excellence and tested by users of the portal. In the initial state, usability and acceptance aspects are key issue in current research. The much harder measureable aspect of added value to the project is investigated qualitatively by expert interviews. Generating quantitative measures for this aspect will be part of future research. The main finding in rolling out a tool for project planning and decision making in scientific environments is, that as long as any feature that is considered vital by the user, the acceptance of the tool is nonexistent.
7 Limitations
The findings presented in this paper were obtained by qualitative expert interviews in a production technology based environment. The tool developed here is tailored for close university/university or university/industry collaboration depicting short project cycles with the demand for agile project planning. To gain quantitative results, elaborated usability studies including questionnaires have to be performed on a larger test group. This type of study will be performed, when qualitative interviews indicate a final state of the software and the missing features declared in this paper are implemented.
References
Brecher, C., et al.: Integrative Production Technology for High-Wage Countries. Springer, Heidelberg (2012)
Jaafari, A., Manivong, K.: Towards a smart project management information system. Int. J. Project Manag. 16(4), 249–265 (1998)
Raymond, L., Bergeron, F.: Project management information systems: an emperical study of their impact on project managers and project success. Int. J. Project Manag. 26, 213–220 (2008)
Ngai, E.W.T., Chan, E.W.C.: Evaluation of knowledge management tools using AHP. Expert Syst. Appl. 29, 889–899 (2005)
Marques, G., Gourc, D., Lauras, M.: Multi-criteria performance analysis for decision making in project management. Int. J. Project Manag. 29, 1057–1069 (2010)
Caniëls, M.C.J., Bakens, R.J.J.M.: The effects of Project Information Systems in decision making in a multi project environment. Int. J. Project Manag. 30, 162–175 (2012)
Tromp, J.W., Homan, T.: How unplanned changes emerge while implementing a Project Management Information System (PMIS) in a complex multi project R&D environment. Procedia – Soc. Behav. Sci. 194, 211–220 (2015)
Brown, J., Isaacs, D.: The World Café. Shaping Our Futures Through Conversations That Matter. McGraw-Hill Professional, New York (2005). ISBN 978-1-57675-258-6
Robertson, J., Volere, S.: Requirements Specification Template, 15th edn. Atlantic Systems Guild, London (2010)
Vaegs, T. et al.: Enhancing scientific cooperation of an interdisciplinary cluster of excellence via a scientific cooperation portal. In: The International Conference on E-Learning in the Workplace ICELW 2014. June 11–13. New York (2014)
Ruby, S., Thomas, D., Hansson, D.H.: Agile Web Development with Rails 4. Pragmatic Bookshelf, Dallas (2013). ISBN: 1937785564, 9781937785567
Bootstrap framework. https://getbootstrap.com
Acknowledgement
The authors would like to thank the German Research Foundation (DFG) for its support within the Cluster of Excellence “Integrative Production Technology for High-Wage Countries” at RWTH Aachen University.
Author information
Authors and Affiliations
Corresponding author
Editor information
Editors and Affiliations
Rights and permissions
Copyright information
© 2017 Springer International Publishing AG
About this paper
Cite this paper
Jansen, U., Schulz, W. (2017). FlowChart Tool for Decision Making in Interdisciplinary Research Cooperation. In: Duffy, V. (eds) Digital Human Modeling. Applications in Health, Safety, Ergonomics, and Risk Management: Health and Safety. DHM 2017. Lecture Notes in Computer Science(), vol 10287. Springer, Cham. https://doi.org/10.1007/978-3-319-58466-9_24
Download citation
DOI: https://doi.org/10.1007/978-3-319-58466-9_24
Published:
Publisher Name: Springer, Cham
Print ISBN: 978-3-319-58465-2
Online ISBN: 978-3-319-58466-9
eBook Packages: Computer ScienceComputer Science (R0)