
Abstract
A target recognition method based on adaptive fusion of multiple matching results was proposed, in order to take advantage of the gray information and feature information in forward-looking infrared (FLIR) target recognition. On the basis of gray-value matching and feature matching, the primary decision based on the proposed adaptive analytic hierarchy process (AHP) and the secondary decision based on the overlap area and the local searching were utilized, thereby the final matching result was generated. Experimental results show that the proposed method can overcome the false matching caused by feature template matching effectively, and improve the accuracy of target matching, and especially in case of complicated background, scale difference or viewpoint difference, the proposed algorithm has better robustness.
You have full access to this open access chapter, Download conference paper PDF
Keywords
1 Introduction
Infrared target recognition is the key technology of infrared imaging guidance, which plays an important role in improving the performance and accuracy of the precision guidance weapon. Template matching is the main method of infrared target recognition. In the terminal guidance stage, the infrared real-time image and template are matched to obtain the relative position of the two images, thus the target identification position is achieved [1].
At present, the target recognition in IR imaging guidance mainly adopts template matching algorithm based on feature information [2], in which the templates are mostly visible image. CAO [3] used the characteristics of visible and infrared images in the shape of fuzzy similarity, and put forward an infrared and visible image matching algorithm based on the fuzzy shape context relation. Heterogeneous images matching was realized by using gradient radial angle histogram which is not affected by image gray level nonlinear transformation and image rotation [4]. Robust edge contour descriptors were proposed from the edge contour between the heterogeneous images, and the accurate matching between IR and visible images is realized [5,6,7]. A heterogeneous image registration is proposed based on an invariant feature designed at the pixel level, the orientation-moment, which describes the similarity of a pixel with its neighbors in different orientation [8]. Li [9] proposed a Hausdorff distance template matching method based on gradient phase and significant constraint to achieve the matching positioning of planar target contour. The noise statistic model [10] and the correlation filter [11] were introduced respectively, to realize the infrared small target detection under the complex background; Ming [12] took full advantage of the gradient value and gradient direction information of the pixel, and proposed an infrared target matching algorithm based on gradient vector correlation coefficient. These algorithms can realize the target recognition task well under the specific application background.
The template matching method theoretically takes the position of the peak of the correlation matrix as the matching position. However, in practical application, because of the great difference between the template and the real-time image, the real matching position usually is another peak of the correlation matrix, which leads to the failure of matching. Moreover, the template matching algorithm based on feature information is sensitive to the accuracy of feature extraction and feature matching, which loses the gray information of the image during the matching. Therefore, it is easy to have the mismatching problem when the background is complex, or when there are great differences between the real-time image and the template. If the infrared image of a typical target can simulated on the basis of the IR model, it can provide more identification information for infrared target recognition and improve the accuracy of infrared target recognition. Through SE-Workbench-IR software, Li [13] simulated the infrared images of typical target area based on the visible image, and the gray-value of the infrared simulation image is similar to the infrared real-time image.
In view of this, we propose an adaptive fusion algorithm for infrared target recognition. Firstly, the matching images are matched with gray matching and feature matching, each obtains a set of matching results; On this basis, the adaptive AHP is proposed to fuse the characteristic parameters of the two sets of matching results, and to obtain two relative best matching points; Finally, the final matching point is acquired by the secondary decision which is based on the overlap area of the matching points corresponding to the matching regions.
2 Proposed Method
As shown in Fig. 1, the proposed algorithm mainly consists of three parts: template matching based on multiple references, the primary decision based on adaptive analytic Hierarchy process, and the secondary decision of overlap region and local search.

Flowchart of the proposed algorithm
2.1 Template Matching Based on Multiple References
In this paper, the gray-normalized cross-correlation method and the gradient vector cross-correlation method are used as the bottom matching algorithms, which are more representative of gray matching algorithms and feature matching algorithms. The infrared simulation template and the infrared real-time image are matched by the gray-normalized cross-correlation method and the gradient vector cross-correlation method in [7] is utilized to match the visible template and the infrared real-time image. In view of the fact that the real matching position of template matching is usually located in the secondary peak of the correlation matrix, in order not to miss the true matching position, the first four peaks are retained as the candidate matching points, which participate in the subsequent fusion positioning.
As shown Fig. 2, Fig. 2(a) is IR simulation template, Fig. 2(b) are gradient feature templates obtained by the visible template in both horizontal and vertical directions, the four block diagrams in Fig. 2(c) and (d) are the matching region, in which the white block diagram area corresponds to the highest correlation coefficient, namely the theoretic matching position of the algorithm, while the other three black diagram areas correspond to the correlation coefficient secondary peaks.

The results of image matching
However, as shown in Fig. 2(d), the best matching point of the method is the point 1 in the white block diagram, but the visual interpretation indicates that the best matching position should be the Black block diagram labeled “2”, which obviously fails the feature match. Although the best matching point of the gray-scale matching shown in Fig. 2(c) is correct, there are still large deviations, so a single matching algorithm based on gray information or feature information has the problem of inaccurate matching or even mismatching.
2.2 Adaptive Analytic Hierarchy Process Based on Entropy Weight Method
For the purpose of improving the adaptability of matching accuracy and enhancing the applicability of the method, the fusion idea is introduced to optimize the matching result. The key of fusion is to set weights; And analytic hierarchy process is a classical algorithm for weighting.
Analytic Hierarchy Process (AHP) is a kind of systematic and hierarchical decision-making analysis method, which is applicable to multiple objectives or multiple schemes, quantitative and qualitative. However, the weights obtained by conventional AHP are too subjective and lack of objectivity.
In view of this, we use the entropy weight method with objectivity to improve the objectivity of the AHP, and use the improved AHP to make the primary decision on the matching results of each group to determine the best matching position in the group. The steps are as follows:
-
(1)
Building a hierarchy model
The hierarchy model typically consists of three layers, as shown in Fig. 3. The upper level is the target layer, which is the best matching result for the decision; The middle layer is the criteria layer, the criteria layer adopts the commonly used image matching evaluation index: correlation coefficient, RMSE and Sharpness [1]; The lowest level is the scheme layer, here is the four initial match results.
Fig. 3. 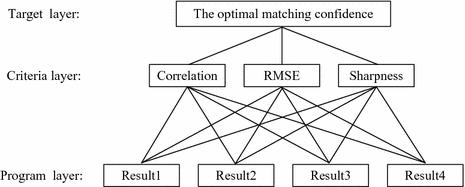
Structural model of AHP
-
(2)
Constructing Adaptive Judgment Matrix
The judgment matrix is usually constructed by paired comparison method and 1–9 comparison scale, which indicates the influence of each factor on the upper layer. However, it is concluded that the judgment matrix is too subjective, and lacks objectivity; And because of the different image data, the three indexes of the criteria layer have different influence on the result of the matching; So it is not possible to use single or multiple group of experiments to fix the values of each element in the judgment matrix.
Therefore, we use the entropy weight method with objectivity to adaptively determine the weights of these three indexes in the experiment according to the specific values of three characteristic indices in the initial matching region. This not only makes the AHP from subjective weighting to objective empowerment, but also improves the adaptive of the algorithm.
Correlation coefficient, RMSE and Sharpness have different trends: the bigger correlation coefficient and Sharpness are, the better, while the smaller RMSE is, the better. So we must first calculate the reciprocal of the RMSE index, so that the bigger the reciprocal is, the better.
Due to the three indicators have different dimension units, it’s necessary to normalize of the index as shown in formula (1), where \( X_{ij} \) (\( i = 1,2,3,4 \); \( j = 1,2,3 \)) is the value of the \( j^{th} \) indicator corresponding to the \( i^{th} \) matching point.
$$ R_{ij} = \frac{{X_{ij} }}{{\sum\limits_{i = 1}^{4} {X_{ij} } }} $$(1)Then, the entropy value of the \( j^{th} \) index is given by
$$ E_{j} = - \frac{1}{\ln 4}\sum\limits_{i = 1}^{4} {\frac{{R_{ij} }}{{\ln R_{ij} }}} $$(2)And the weight of the evaluation indicator is defined as
$$ W_{j} = \frac{{1 - E_{j} }}{{3 - \sum\limits_{j = 1}^{3} {E_{j} } }} $$(3) -
(3)
Calculate weight vector and do consistency check
The eigenvector method is used to find the maximum eigenvalue \( \lambda_{\hbox{max} } \) and corresponding eigenvector of each judgment matrix, and the random consistency ratio \( CR \) of each judgment matrix is given by
$$ CR = {{CI} \mathord{\left/ {\vphantom {{CI} {RI}}} \right. \kern-0pt} {RI}} $$(4)with \( RI \) is the average random consistency index and \( CI \) is defined as
$$ CI = {{(\lambda_{\hbox{max} } - n)} \mathord{\left/ {\vphantom {{(\lambda_{\hbox{max} } - n)} {(n - 1)}}} \right. \kern-0pt} {(n - 1)}} $$(5)where \( n \) is the order of the matrix, and the value of \( n \) in this paper is 3; The average random consistency index is based on sufficient number of random judgment matrices, and it’s only related to the order of matrices, as shown in Table 1.
Table 1. Average random consistency index -
(4)
Calculate the index comprehensive value and obtain the best match position
The comprehensive value of the corresponding indices for each initial matching point can be computed by
$$ \varvec{Q} = \varvec{X} \cdot \varvec{W}^{T} $$(6)where \( \varvec{Q} \) is the comprehensive value matrix of the three indexes corresponding to four matching points; \( \varvec{X} \) is the three index value matrices corresponding to each matching point; \( \varvec{W} \) is the weight vector matrix of the three indices. The matching point with the maximum element value in \( \varvec{Q} \) is the best matching position of the primary decision. Matching results of the primary decision are shown in Fig. 4(a) and (b), and visual interpretation can illustrate that the primary decision can correct the results of the initial matching of gray-scale and feature.
Fig. 4. 
Matching results of the primary decision


2.3 Fusion Method Based on Overlap Region and Local Search
In order to rectify the problem of selecting the second best matching points and reducing the matching accuracy after the primary decision, the secondary decision is utilized to fuse two optimal matching points obtained in Sect. 2.2.
According to the overlap area of the two best matching regions, the corresponding secondary decision scheme is determined and the matching result is more accurate than Sect. 2.2. The secondary decision scheme are as follows:
-
I.
If the overlap area is larger than the threshold \( T \), it is considered that both of the results of the two matching methods in the primary decision are accurate, and the matching result of the secondary decision is obtained directly by the weighted average of the two optimal matching points, that is, the final matching result;
-
II.
If the overlap area is less than the threshold \( T \), that is, the two best matching points of the primary decision are not in the same region, it is considered that the gray match result and the feature matching result have the wrong decision; then follow these steps to make the secondary decision:
-
①
Centering on the gray matching point and feature matching point obtained in Sect. 2.2, respectively, carry out local searching in each matching graph, and record the number of matching points appearing in each search area, that is \( a_{1} \) and \( b_{1} \), respectively;
-
②
Centering on the initial best matching point of gray matching and feature matching obtained in Sect. 2.1, respectively, carry out local searching in each matching graph, and record the number of matching points appearing in each search area, that is \( a_{2} \) and \( b_{2} \), respectively;
-
③
Compare with the two searching. If \( a_{1} \ne a_{2} \) and \( b_{1} = b_{2} \), the gray matching result is effective; Otherwise, the feature matching result is effective;
-
④
Calculate the average value of the valid results, and obtain the final matching position.
-
①
The threshold \( T \) is determined by the actual size of the template. Set the size of the template as \( a * b \), the two matching results are considered to be in accordance with the requirements when the top and bottom distance \( \left| {dx} \right| \) of the two points is less than \( {a \mathord{\left/ {\vphantom {a {10}}} \right. \kern-0pt} {10}} \), and the left and right distance \( \left| {dy} \right| \) is less than \( {b \mathord{\left/ {\vphantom {b {10}}} \right. \kern-0pt} {10}} \); And the overlap area of the two matching areas is the threshold value \( T \). The calculation shows that the relationship between the threshold value and the size of the template is \( T = 0.81ab \).
Taking the matching result of Sect. 2.2 as an example, the secondary decision is made, and the result is shown in Fig. 5. In this group of experiment, the ideal matching position is (62, 123), the gray matching result and the feature matching result of the primary decision are (57, 121), and (69, 123), respectively; And the result of the secondary decision is (63, 122). Obviously, the secondary decision effectively improves the accuracy of target matching.

Matching result of the secondary decision
3 Simulation Experiments and Results Analysis
The proposed algorithm has been tested on two groups of representative image sequences to evaluate the effectiveness and performance. The real-time images are obtained by infrared camera, while the reference images are simulated by Se-workbench-IR.
3.1 Complicated Background Interference
In this group of experimental sequences, there are a large number of building disturbances in the background area, including buildings of similar shapes. The experimental results are shown in Fig. 6. Figure 6(a) are the IR simulation template and the horizontal and vertical gradient feature templates obtained by the visible template; Fig. 6(b) and (c) are the initial matching results of gray matching and feature matching, respectively, in which the white block diagram is the initial optimal matching position; Fig. 6(d) and (e) are the results of gray-scale matching and feature matching filtered by primary decision, respectively; Fig. 6(f) is final matching position of the group experiment after the secondary decision. As shown in Fig. 6, that the gray matching in the initial match is mismatched, and the result of the feature matching has a large deviation, while the decision based on the adaptive AHP corrects the matching errors in the initial match.

Matching experiment in case of complicated background interference
3.2 Different Scale and Sight Interference
As shown in Fig. 7, there are some small scale difference and small angle rotation difference between two images, including complex background environment. In Fig. 7, part (a) are the IR simulation template and the horizontal and vertical gradient feature templates obtained by the visible template; Fig. 7(b) and (c) are the initial matching results of gray matching and feature matching, in which the white block diagram is the initial optimal matching position; Fig. 7(d) and (e) are the results of gray-scale matching and feature matching filtered by primary decision, respectively; Fig. 7(f) is final matching position of the group experiment after the secondary decision. In this group of experiments, the initial matching results of the feature matching are in the white block, but the actual best matching point should be in the black box labeled “3”, and the primary decision failed to correct the error matching problem in the initial match, there is still a mismatching point after the decision; After the secondary decision, the position of the matching point can be corrected, and the final matching position is more accurate than before.

Matching experiment in case of different scale and sight interference
The accuracy of matching points in each matching step is objectively represented by the Euclidean distance, given by
with \( \Delta x = \left| {x_{1} - x_{0} } \right| \) and \( \Delta y = \left| {y_{1} - y_{0} } \right| \), where \( (x_{0} ,y_{0} ) \) is the ideal matching position and \( (x_{1} ,y_{1} ) \) is the real matching position.
In the first set of matching experiment, the template size is 33 * 44, the ideal matching position is (140, 41), and the matching result is shown in Table 2. In the second group matching experiment, the template size is 54 * 48, the ideal matching position is (135, 236), and the matching result is shown in Table 3.
It can be seen from Tables 2 and 3 that compared with the initial matching results, the Ed of matching results obtained by the primary decision is less than the initial matching result, and the matching result of the secondary decision is more accuracy than the primary decision; When the mismatching problem still occurs in the result after the primary decision, the secondary decision can correct the mismatching point well. So, the proposed algorithm can effectively correct the mismatching in single matching algorithm under the interference of the complex background and certain scale and rotation difference, and can effectively improve the matching accuracy with fully preserving the advantages of the gray matching and feature matching.
4 Conclusions
A target recognition method based on adaptive fusion of multiple matching results was proposed for the decrease in template matching performance due to the fact that the true matching position usually located in the other peak of the correlation matrix. The proposed algorithm makes full use of the gray information and feature information between the template and the infrared real-time image, takes parallel operation of two kinds of matching methods for IR real-time image; Then, the weight of each index in AHP is calculated objectively and adaptively by the entropy weighting method, and then the best matching point of each of the two matching algorithms is obtained by the primary decision; After that, the secondary decision based on overlap region and local search is utilized to rectify the mismatching, and also take advantage of the matching results of the two matching methods and improve the matching accuracy. The results of the experiment indicate that compared with the single matching method, in spite of the slightly higher of operation efficiency, the proposed algorithm has higher accuracy and higher precision; And it’s more suitable for the infrared target recognition task in the complex scene, with better robustness and applicability to the scale and rotation change between heterogeneous images.
References
Su, J., Xu, Q.S., Liu, G.: A forward looking infrared target recognition algorithm based on edge matching. Acta Armamentarii 33(3), 271–277 (2012)
Omachi, S., Omachi, M.: Fast template matching with polynomials. IEEE Trans. Image Process. 16(8), 2139–2149 (2007)
Cao, Z.G., Yan, R.C., Song, Z.: Approach on fuzzy shape context matching between infrared images and visible images. Infrared Laser Eng. 37(6), 1095–1100 (2008)
Li, Z., Lei, Z.H., Yu, Q.F.: Matching multi-sensor images based on gradient radius angle pyramid histogram. Acta Geodaeticaet Cartograph. Sinica 40(3), 318–325 (2011)
Wang, J.W., Bai, X., You, X., et al.: Shape matching and classification using height functions. Pattern Recogn. Lett. 33(2), 134–143 (2012)
Wang, P., Qu, Z.G., Wang, P., et al.: A coarse-to-fine matching algorithm for FLIR and optical satellite image registration. IEEE Geosci. Remote Sens. Lett. 9(4), 599–603 (2012)
Zhao, Y.: Research on multi-modality image matching technology based on salient contour. Nanjing University of Aeronautics and Astronautics, Nanjing (2014)
Li, X., Zhu, Z.S., Shang, Y., et al.: Multimodal image registration based on orientation-moment. J. Nat. Univ. Defense Technol. 37(1), 153–158 (2015)
Li, Z.J., Liu, S.L., Niu, Z.D., et al.: Hausdorff distance template matching method based on gradient phase and significance constraints. Infrared Laser Eng. 44(2), 775–780 (2015)
Li, A.D., Lin, Z.P., An, W., et al.: Infrared small target detection in compressive domain based on self-adaptive parameter configuration. Chin. J. Lasers 42(10), 1008003 (2015)
He, Y.J., Li, M., Zhang, J.L., et al.: Infrared small target detection method based on correlation filter. Acta Optica Sinica 36(5), 0512001 (2016)
Ming, D.L., Tian, J.W.: Automatic infrared condensing tower target recognition using gradient vector features. J. Astronaut. 31(4), 1190–1194 (2010)
Li, B., Su, J., Hao, Y.Y.: Infrared image simulation based on SE-Workbench-IR. Infrared Technol. 38(8), 683–687 (2016)
Author information
Authors and Affiliations
Corresponding author
Editor information
Editors and Affiliations
Rights and permissions
Copyright information
© 2017 Springer International Publishing AG
About this paper

Cite this paper
Li, B., Su, J., Chen, D., Wu, W. (2017). Multi-template Matching Algorithm Based on Adaptive Fusion. In: Zhao, Y., Kong, X., Taubman, D. (eds) Image and Graphics. ICIG 2017. Lecture Notes in Computer Science(), vol 10666. Springer, Cham. https://doi.org/10.1007/978-3-319-71607-7_53
Download citation
DOI: https://doi.org/10.1007/978-3-319-71607-7_53
Published:
Publisher Name: Springer, Cham
Print ISBN: 978-3-319-71606-0
Online ISBN: 978-3-319-71607-7
eBook Packages: Computer ScienceComputer Science (R0)
