
Abstract
In order to examine the relationship between risk cognitive variables and flight exceedance behaviors of airline transport pilots, the concepts of ‘risky pilots’ was put forward, and the existence of ‘risky pilots’ was verified based on flight exceedance events statistics. Three risk cognitive variables of pilots involving risk tolerance, hazardous attitude and risk perception were investigated through the use of a series of psychological scales. Then one-way ANOVA and Pearson Correlation Analysis were used to study the influence of risk cognitive variables on airline transport pilots’ exceedance behaviors. Results indicated that ‘risky pilots’ do exist among airline transport pilots. Additionally, a hazardous attitude has significant positive effects on pilots’ severe exceedance behaviors, which means that pilots who have high levels of a hazardous attitude would cause exceedance behaviors easily and induce higher occurrence rates of unsafe events. The conclusion of the study indicates that targeted education and training for improving risky pilots’ hazardous attitudes should be carried out for the purpose of reducing exceedance behaviors in flight, which would then make flight safer.
You have full access to this open access chapter, Download conference paper PDF
Keywords
1 Introduction
According to the accident proneness theory [1], there are great individual differences among human beings. The viewpoint that some people who possess accident proneness are essentially more prone to accidents compared to others due to their physiological and psychological differences has been widely recognized in the automotive industry. The research on the correlation between driving behaviors, accidents and personality characteristics of accident-prone drivers has also been widely conducted [2, 3].
Since the 1990s, aeronautical psychologists have begun to focus on the impact of risk factors in personality traits of pilots on flight safety. Hunter [4] called the factor risk tolerance, which refers to the quantity and extent of willingness to accept the risk in order to achieve a particular goal. Pauley et al. [5] held that for the purpose of accomplishing specific tasks, or achieving specific goals, pilots may need to tolerate or accept high-level risk to execute flight plans while flying. Related studies have shown that there is a close interconnection between risk tolerance and the safety performance of pilots [6,7,8], and a negative correlation between the risk tolerance level and the safety behaviors of pilots [4]. Berlin et al. [9] initially offered that hazardous thought patterns and the influence of pilots’ hazardous attitudes on driving safety behaviors have been deliberately examined by researchers. The Federal Aviation Administration (FAA) found that hazardous attitudes, such as manliness, anti-authoritarian attitudes, impulsiveness, compliance and tenacity could affect the level of decision-making of pilots [10]. Ji et al. [11] noticed that hazardous attitudes promote the negative effects of risk tolerance on flight safety. Meanwhile, risk perception is considered as a type of situational risk awareness, individuals’ subjective cognition and evaluation of potential hazards in their external environment, and corresponding preparatory behavior [12], also attracted concern from psychologists. Hunter [4] found that risk perception is negatively correlated with risk tolerance among pilots. Ji et al. [11] posited that risk perception plays a regulatory role in the process of risk tolerance, affecting pilots’ driving safety behaviors. Ji et al. [11] also suggested that a high level of risk perception will weaken the negative effect of risk tolerance on driving safety behaviors. Additionally, the study showed that such risk perception will also regulate the effect of hazardous attitudes on the impact of risk tolerance on pilots’ driving safety behaviors.
An exceedance event is an unsafe event in which the monitoring parameters of any quick access recorder exceed the standard of Flight Operations Quality Assurance (FOQA), specifically aiming at the “collection and analysis system of flight data in daily flight” [13, 14], and is independently reported by the Flight Operations Quality Assurance software. Exceedance event risk management based on Quick Access Recorder (QAR) data is the core content of the FOQA of airlines. Similar to the idea of big data, the flight data of QAR could be used to analyze and evaluate the operant level and exceedance behavior of pilots. Wang et al. [15,16,17,18,19] carried out research on the evaluation of flight operation risk by using QAR data, especially the in-depth study of flaring operational characteristics of long landing and hard landing events, which specifically analyze the impact of flaring operation on landing performance. Overall, related research on exceedance events using QAR data that pertains to the detection, diagnosis, and prediction of exceedance events but lack of studies on the relationship between risk-related personality traits and exceedance behaviors.
Therefore, statistics and analysis of the exceedance events of airline transport pilots will be conducted, to verify whether the minority, who are more prone to exceedance events compared to others, exist among airline transport pilots as motorists. In addition, differences of QAR exceedance events of airline transport pilots, at different levels of risk cognition, will be analyzed. The results can provide a theoretical reference for the Flight Operations Quality Assurance work and selection of airline transport pilots.
2 Methods
2.1 Exceedance Events Statistics
In order to verify the existence of “risky pilots”–there are some pilots who are more prone to exceedance events compared to others–a study of the exceedance cases (including mild exceedance and severe exceedance) of airline transport pilots within the past one year were gathered and analyzed, and then contrasted in detail. The findings of the types of specific exceedance events and the occurrence rate of each exceedance event are shown in Table 1.
On the basis of obtaining the statistical information of the airline’s exceedance events within the past year, an correspondence statistic for each pilots’ exceedance times were conducted further, and the pilots who undertook the task of operation in each flight were confirmed through the airline’s flight management software. If the pilot completed a take-off or a landing operation as the pilot in operation, it was recorded accordingly. However, the take-off or landing operations of the non-main operators were not included in the exceedance times.
In order to analyze the exceedance cases of airline transport pilots with different risk cognition, occurrence rate of exceedance events–exceedance rate being the ratio of the cumulative times of exceedance events over a year to the overall take-off and landing–was put forward to evaluate the risk behavior tendency of airline transport pilots as an index. For instance, the findings discovered that the higher the exceedance rate was evaluated, the higher the tendency of risky behavior. After the statistics of each pilots’ exceedance times were recorded within the past year, the number of flights during the year were analyzed.
2.2 Measurement of Risk Cognitive Variables
In order to measure the degree of pilots’ risk tolerance, risk perception and hazardous attitude shown in flight, the total scale of airline transport pilots’ risk cognition were established by consultation and translation of the risk tolerance scale of pilots, risk perception scale of pilots, and hazardous attitude scale of pilots, compiled by Hunter [4] and Ji et al. [11].
2.2.1 Scale Structure
-
(1)
Risk Tolerance. The airline transport pilots’ risk tolerance scale is made up of 17 kinds of flight situations, which were established according to the study of Hunter [4] by Ji et al. [11]. The total scale of risk tolerance consists of 3 parts: risk tolerance for aircraft system failure (3 topics), risk tolerance for crew operation (7 topics), and risk tolerance for flight environment (7 topics). The risk tolerance score is measured in 5 grades: 1. pilots who said they are extraordinarily willing to accept, or to agree with, the flight situation given in the scale; 2. pilots who said they are willing to accept, or to agree with, the flight situation given in the scale; 3. pilots who said they are generally willing to accept, or to agree with, the flight situation given in the scale; 4. pilots who said they are reluctant to accept, or to agree with, the flight situation given in the scale; and 5. pilots who said they are very reluctant to accept, or to agree with, the flight situation given in the scale. The score of the scale is the average of all the topics; hence, the higher the score, the higher the level of risk tolerance.
According to Ji et al. [11], the reliability and validity of the test results of the scale reveal that the Cronbach’s α coefficient on the scale is 0.81, whereas the test results of the scale translated to the Cronbach’s α coefficient is 0.94.
-
(2)
Risk Perception. The risk perception scale of airline transport pilots consists of 26 kinds of flight situations or flight events. It has been widely applied in pilots’ research since it was compiled by Hunter [4]. The total risk perception scale consists of 5 parts: general flight risk (5 topics), high flight risk (7 topics), flight altitude risk (7 topics), automobile driving risk (3 topics) and daily life risk (4 topics). The grades of risk situations, or risk events, listed in the scale are 0–100. The score of the scale is the average of all the topics. Hence, the higher the score, the higher is the level of risk perception.
According to Ji et al. [11], the test results of the reliability and validity of the scale exhibit that the Cronbachs’s α coefficient of scale is 0.89, whereas the test results of the scale translated to that of the Cronbachs’s α coefficient is 0.910.
-
(3)
Hazardous Attitude. The airline transport pilots’ hazardous attitude scale consists of 24 kinds of behaviors that are closely related to modern airline activities. The study was conducted in China by Ji et al. [20]. The hazardous attitude scale consists of 6 parts: confidence (6 topics), impulses (5 topics), manliness (3 topics), anxiety (4 topics), obedience (3 topics) and risk awareness (3 topics). The scale is a Likert-type five point scale. 1. pilots who said they are extraordinarily willing to accept, or to agree with, the flight situation given in the scale; 2. pilots who said they are willing to accept, or to agree with, the flight situation given in the scale; 3. pilots who said they are generally willing to accept, or to agree with, the flight situation given in the scale; 4. pilots who said they are reluctant to accept, or to agree with, the flight situation given in the scale; and 5. pilots who said they are very reluctant to accept, or to agree with, the flight situation given in the scale. The score of the scale is the average of all the topics. Hence, the higher the score, the higher is the level of the hazardous attitude.
According to Ji et al. [11], the reliability and validity of test results of the scale exhibit that the Cronbach’s α coefficient of scale is 0.89, whereas the test results of the scale translated to that of the Cronbach’s α coefficient is 0.912.
2.2.2 Scale Implementation
After the distribution of the questionnaires, 66 completed questionnaires were collected from the airline. The basic statistical data of the subjects are shown in Table 2.
Of the 66 completed questionnaires, 51 agreed with using the individual’s real name to participate in the follow-up research and analysis. Also, the participants polled agreed to have their exceedance records taken from the Flight Operations Quality Assurance system of their airline. Sample selection was based on the following conditions: (1) at least one year of service time; (2) more than 100 h of flight hours within the past year; (3) no occurrences of accidents or accidental signs occurring as the main operator; (4) more than 50 (including 50) sorties per year in total. Five out of 51 questionnaires did not meet the screening criteria. The scores of each sample were calculated separately, and then matched one-to-one with their exceedance rate. Finally, 46 effective samples were considered.
2.2.3 Sample Analysis
After obtaining 46 effective samples, with the aim of examining the relationship between risk cognitive variables and the exceedance situations of airline transport pilots, one-way ANOVAs and Pearson Correlation Analyses were conducted through SPSS data analysis software.
In relation to studying the difference shown by pilots’ risk cognitive variables at different exceedance rate levels, the mild and severe exceedance rates of the 46 samples were divided into three groups: high (M + SD), medium (M), low (M − SD). The boxplot indicates that outliers exist in the samples, but there are no extreme outliers. In order to ensure the integrity and authenticity of the samples, the outlier cannot be excluded. Based on the Shapiro-Wilk test, each group of data obeys a Gaussian distribution (P > 0.05). Through Levene’s test of homogeneity of variances, each group was shown to be consistent (P > 0.05).
In order to examine the correlation coefficient between the hazardous attitude and the severe exceedance rate further, Pearson Correlation Analysis was carried out to analyze the relationship between risk cognitive variables and exceedance rates. By scattergram, there is no obvious outlier in the data. However, in reference to the Shapiro-Wilk test, all the continuous variables conform to a Gaussian distribution (P > 0.05), and there is no obvious skewness in the 46 samples.
3 Results
3.1 Verification of Risky Pilots
The population composition proportion and exceedance times proportion were compared, as is exhibited with their corresponding outcomes in Fig. 1.

Comparison of population composition proportion and exceedance times proportion
As shown in Fig. 1:
-
(1)
There are 193 pilots in the airlines. Thirty-three pilots did not take part in exceedance events within the past year, which accounted for 17.10% of the total; whereas, 160 pilots did take part in exceedance events, accounting for 82.90%.
-
(2)
Pilots whose exceedance events were less than 10 times (including 10 times) within the past year accounted for 69.95% of the total. The 69.9% pilots’ population composition proportion was higher than the exceedance times proportion. Pilots whose exceedance events were more than 10 times within the past year accounted for 30.05% of the total. The 30.05% pilots’ population composition proportion was lower than the exceedance times proportion. The more intuitive results can be shown in Figs. 2 and 3.
Fig. 2. 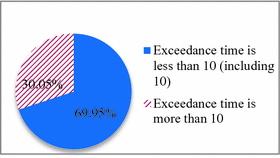
Population composition proportion
Fig. 3. 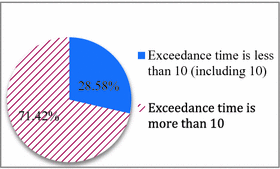
Exceedance times proportion


By percentage analysis, a preliminary comparative result of exceedance frequency within the past year could be produced. Thus, a small number of pilots in the airline accounted for a large proportion of the total exceedance events, and their exceedance rates are significantly higher than other pilots’, which proves that a specified minority of pilots often take part in exceedance events. That is to say, these pilots are more prone to exceedance events than others.
3.2 Correlation Between Risk Cognitive Variables and Exceedance Behaviors
The one-way ANOVA exhibited that there were significant differences in hazardous attitudes among the groups with different levels of severe exceedance rates, and the difference was statistically significant; F (2, 43) = 3.497, P < 0.05. According to the Tukey-Kramer multiple comparison post test results, the following could be seen: the hazardous attitude score of the “high severe exceedance rate” group was 0.44 higher than the “low severe exceedance rate” group (95% CI: 0.01–0.87), and the difference was statistically significant (P < 0.05). The specific results are as shown in Table 3 and Fig. 4.

The differences of hazardous attitudes at different levels of severe exceedance rate
The results of Pearson Correlation Analysis showed that there was a moderate positive linear correlation between hazardous attitudes and severe exceedance rates, R (44) = 0.400, P < 0.05. The specific results are shown in Table 4.
4 Discussion
4.1 Existence of Risky Pilots
Accident proneness theory posits that some people are inherently more prone to accidents than others in the same environment [1]. This study shows that there are a small percentage of people whose exceedance times in the last three years number far more than others in the airline, after the airline’s frequency of exceedance times in the last three years was compared initially using the percentage method. Statistics and tests analyzed regarding the distribution of exceedance times and exceedance rates of pilots driving two different types of aircraft show that the distribution of exceedance times of pilots exhibited an obvious “right deviation” configuration, whereas the distribution of exceedance rates remained the same. This partly reflects the fact that the occurrence of exceedance events is biased towards a specific group of people. The study shows that there is a significant correlation between exceedance rates of pilots in different periods, which means the exceedance rates of pilots with a high exceedance rate in the previous stage will be higher than the exceedance rate in the later stage. The exceedance rate of pilots is a relatively stable indicator. These results show that the occurrence of exceedance events is not completely random, like traffic accidents in the driving area, but rather is attributable to a particular group who, when compared to other pilots, were more likely to exceed the exceedance rates. Hence, there are “risky pilots” in the pilot population.
4.2 The Positive Effect of Hazardous Attitudes on Severe Exceedance Behaviors
Hazardous attitudes are influenced by personal needs and the external environment. It is undeniable that attitudes are unstable and subjective but will affect the behaviors of individuals with respect to the population, environment and various situations, whether or not they can be manifested as a kind of perception that has been known for a considerable amount of time (Wilkening 1973) [21]. The results show that the level of hazardous attitudes with a high severe exceedance rate is significantly higher than that with a low severe exceedance rate (F (2, 43) = 3.497, p < 0.05, η2 = 0.468). Whereas the scores of hazardous attitudes decrease in the order of a high severe exceedance rate group, a middle severe exceedance rate group, and a low severe exceedance rate group, as shown in Fig. 2, Tukey’s test results show that the level of hazardous attitudes decreases by 0.26 (95% CI: −0.22414–0.7491), with no statistical significant difference between the high severe exceedance rate group and the middle severe exceedance rate group. Hence, the level of hazardous attitudes decreases by 0.18 (95% CI: −0.14610–0.5001), with no statistically significant difference between the middle severe exceedance rate group and the low severe exceedance rate group. As the level of hazardous attitudes decreases by 0.44 (95% CI: −0.22414–0.7491), it does so with the statistically significant difference between the high severe exceedance rate group and the low severe exceedance rate group. Hence, this conclusion indicates that the level of hazardous attitudes of pilots with high severe exceedance rates is significantly more than that of pilots with low severe exceedance rates. This is consistent with Hunter’s study [23], which exhibits that pilots with high levels of hazardous attitudes will have even more risk events. The research of Pauley et al. [5] also finds that hazardous attitudes can effectively predict the adventure tendency and dangerous aviation activities of pilots.
The results of Pearson Correlation Analysis show that there is a significant positive correlation between hazardous attitudes and severe exceedance rates, which are consistent with the results of one-way ANOVA. Hence, hazardous attitudes can be used as a valid indicator for predicting such things as the pilots’ personality traits, exceedance situations, and risk events, to effectively evaluate the flight performance of a pilot and for use as screening criteria in the selection of flight students.
4.3 The Impact of Risk Tolerance and Risk Perception on Exceedance Behaviors
However, the risk tolerance of pilots doesn’t show statistically significant correlation with mild exceedance rates and severe exceedance rates, neither does risk perception. It is similar to the findings of Hunter [22] that no significant relationship between risk tolerance and pilot risk driving behavior. Also, high levels of risk perception will significantly affect the impact of risk tolerance on driving safety behavior. Additionally, as shown by Hunter and Stewart [23], hazardous attitudes and risk tolerance can be used as independent variables to explain an individual’s risk-behavior predisposition. However, with that stated, hazardous attitudes are more useful for explaining risky driving than risk tolerance. Studies by Ji et al. [11] also show that risk tolerance has a significant positive effect on hazardous attitudes. Therefore, risk tolerance plays a direct role in hazardous attitudes and thus affects pilots’ risk behaviors through the adjustment of risk perception. Risk perception also plays a role in the influence of hazardous attitudes on risky driving behavior. Since hazardous attitudes affect the pilots’ severe exceedance rates, it is necessary to reduce the pilots’ hazardous attitudes through training and to then reduce their severe exceedance rate. Concomitantly, such a reduction to exceedance rate will improve the safe level of a pilot’s operation, including such aspects as flight system knowledge, situational awareness, risk decision-making and other non-technical skills. This result supports the findings of Berlin [9], in which training in hazardous attitudes can significantly improve the decision-making of pilots in the short term. (Federal Aviation Administration 1991; Buch and Diehl 1984; Diehl 1991) [10, 24, 25]. The hazardous attitudes of pilots include the six dimensions of confidence, impulses, manliness, anxiety, obedience and risk awareness. Exceedance rates reflect the risk tendencies of the pilots only from the event level itself, and the follow-up study would further examine the impact of each dimension of risk attitude on the risk behaviors of pilots themselves. Concomitantly, it is also more valuable to extend the research object to the relationship between the QAR data corresponding to the risk-related personality traits and the pilots’ operational behaviors.
5 Conclusions
This study examined the relationship between risk cognitive variables and flight exceedance behaviors of airline transport pilots. Three risk cognitive variables of pilots involving risk tolerance, hazardous attitude and risk perception were investigated through the use of a psychological scale.
There is a population group of “accidental drivers” in the pilot community, which we define as “risky pilots.” Although the “risky pilots” account for only a small percentage of the total pilot population, they trigger typical exceedance warnings at a higher frequency than their counterparts, meaning they are more prone to exceedance events than other pilots.
The pilots with high severe exceedance rates have generally higher hazardous attitudes scores than the pilots with a low severe exceedance rate. However, there is a moderate positive correlation found between the hazardous attitudes and severe exceedance rates of pilots.
It is suggested that targeted education and training for improving risky pilots’ hazardous attitudes is a good way for reducing exceedance behaviors in flight.
References
Greenwood, M.: Accident proneness. Biometrika 37(1/2), 24–29 (1950)
Li, Z., Sun, J.T., Xu, K.H., Chen, Y.X., Zhao, S.M.: Predicting accident proneness of pilot with Eysenck personality questionnaire. Chin. J. Aerosp. Med. 10(4), 234–236 (2007)
Yan, H.: Building model for relationship between road traffic accident and drivers’ psychological quality. China Saf. Sci. J. 26(2), 13–17 (2016)
Hunter, D.R.: Risk perception and risk tolerance in aircraft pilots (Report No. DOT/FAA/AM-02/17). Federal Aviation Administration Office of Aviation Medicine, Washington DC (2002)
Pauley, K., O’Hare, D., Wiggins, M.: Risk tolerance and pilot involvement in hazardous events and flight into adverse weather. J. Saf. Res. 39(4), 403–411 (2008)
O’Hare, D.: Pilots’ perception of risks and hazards in general aviation. Aviat. Space Environ. Med. 61(7), 599–603 (1990)
Platenius, P.H., Wilde, G.J.: Personal characteristics related to accident histories of Canadian pilots. Aviat. Space Environ. Med. 60(1), 42–45 (1989)
Wiggins, M., Connan, N., Morris, C.: Weather-related decision making and self-perception amongst pilots. In: Haywood, B.J., Lowe, A.R. (eds.) Applied Aviation Psychology: Achievement, Change and Challenge, Proceedings of 3rd Australian Psychology Symposium, pp. 193–200. Avebury Ashgate Publishing Ltd., Aldershot (1996)
Berlin, J.I., Gruber, E.V., Holmes, C.W., Jensen, P.K., Lau, J.R., Mills, J.W.: Pilot judgment training and evaluation (Report No. DOT/FAA/CT-81/56-I), vol. 1. Federal Aviation Administration, Washington, DC (1982)
Federal Aviation Administration: Aeronautical decision making. Advisory Circular: 60–22 FAA, Washington, DC (1991)
Ji, M., You, X.Q., Lan, J.J., Yang, S.Y.: The impact of risk tolerance, risk perception and hazardous attitude on safety operation among airline pilots in China. Saf. Sci. 49(10), 1412–1420 (2011)
Tränkle, U., Gelau, C., Metker, T.: Risk perception and age-specific accidents of young drivers. Accid. Anal. Prev. 22(2), 119–125 (1990)
Civil Aviation Administration of China: Implementation and management of flight operation quality assurance. Advisory Circular: 121/135–FS–2012–45. CAAC, Beijing (2012)
Yang, Y.X.: Research on flight operation risk based on quick access recorder data. Unpublished Master’s dissertation, Civil Aviation University of China (2016)
Wang, L., Sun, R.S., Wu, C.X., Cui, Z.X., Lu, Z.: A flight QAR data based model for hard landing risk quantitative evaluation. China Saf. Sci. J. 24(2), 88–92 (2014)
Wang, L., Wu, C.X., Sun, R.S.: An analysis of flight Quick Access Recorder (QAR) data and its applications in preventing landing incidents. Reliabil. Eng. Syst. Saf. 127, 86–96 (2014)
Wang, L., Wu, C., Sun, R., Cui, Z.: An analysis of hard landing incidents based on flight QAR data. In: Harris, D. (ed.) EPCE 2014. LNCS (LNAI), vol. 8532, pp. 398–406. Springer, Cham (2014). https://doi.org/10.1007/978-3-319-07515-0_40
Wang, L., Wu, C., Sun, R.: Pilot operating characteristics analysis of long landing based on flight QAR data. In: Harris, D. (ed.) EPCE 2013. LNCS (LNAI), vol. 8020, pp. 157–166. Springer, Heidelberg (2013). https://doi.org/10.1007/978-3-642-39354-9_18
Wang, L., Ren, Y., Wu, C.X.: Effects of flare operation on landing safety: a study based on ANOVA of real flight data. Saf. Sci. 102, 14–25 (2018)
Ji, M., Liu, Z., Yang, S.Y., Bao, X.H., You, X.Q.: A study on the relationship between hazardous attitudes and safe operation behaviors among airline pilots in China. J. Psychol. Sci. 35(1), 202–207 (2012)
Wilkening, H.E.: The Psychology Almanac. Brooks/Cole, Monterey (1973)
Hunter, D.R.: Measurement of hazardous attitudes among pilots. Int. J. Aviat. Psychol. 15(1), 23–43 (2005)
Hunter, D.R., Stewart, J.E.: Locus of control, risk orientation, and decision making among U.S. army aviators. Technical report No. 1260, Army Research Institute for the Behavioral and Social Sciences (DTIC No. ADA452056), Arlington (2009)
Buch, G., Diehl, A.: An investigation of the effectiveness of pilot judgment training. Hum. Fact.: J. Hum. Fact. Ergon. Soc. 26(5), 557–564 (1984)
Diehl, A.E.: The effectiveness of training programs for preventing aircrew ‘error’. In: Jensen, R.S. (eds.) Proceedings of 6th International Symposium on Aviation Psychology, pp. 640–655. Ohio State University, Columbus (1991)
Acknowledgments
We appreciate the support of this work from the National Natural Science Foundation of China (Grant No. U1733117) and the National Key Research and Development Program of China (Grant No. 2016YFB0502405).
Author information
Authors and Affiliations
Corresponding author
Editor information
Editors and Affiliations
Rights and permissions
Copyright information
© 2018 Springer International Publishing AG, part of Springer Nature
About this paper

Cite this paper
Wang, L., Zhang, J., Sun, H., Ren, Y. (2018). Risk Cognition Variables and Flight Exceedance Behaviors of Airline Transport Pilots. In: Harris, D. (eds) Engineering Psychology and Cognitive Ergonomics. EPCE 2018. Lecture Notes in Computer Science(), vol 10906. Springer, Cham. https://doi.org/10.1007/978-3-319-91122-9_57
Download citation
DOI: https://doi.org/10.1007/978-3-319-91122-9_57
Published:
Publisher Name: Springer, Cham
Print ISBN: 978-3-319-91121-2
Online ISBN: 978-3-319-91122-9
eBook Packages: Computer ScienceComputer Science (R0)