Abstract
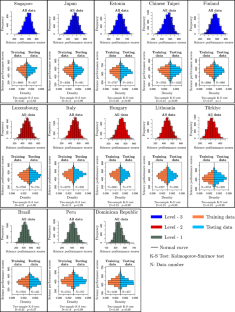
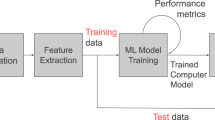
In this study, the performance of machine learning methods was examined in terms of predicting the science education achievement scores of the students who took the exam for the next term, PISA 2018, and the science average scores of the countries, using PISA 2015 data. The research sample consists of a total of 67,329 students who took the PISA 2015 exam from 13 randomly selected countries (Brazil, Chinese Taipei, Dominican Republic, Estonia, Finland, Hungary, Italy, Japan, Lithuania, Luxembourg, Peru, Singapore, Türkiye). In this study, multiple linear regression, support vector regression, random forest, and extreme gradient boosting (XGBoost) machine learning algorithms were used. For the machine learning process, a randomly determined part from the PISA-2015 data of each country researched was divided as training data and the remaining part as testing data to evaluate model performance. As a result of the research, it was determined that the XGBoost algorithm showed the best performance in estimating both PISA-2015 test data and PISA-2018 science academic achievement scores in all researched countries. Furthermore, it was determined that the highest PISA-2018 science achievement scores of the students who participated in the exam, estimated by this algorithm, were in Luxembourg (r = 0.600, RMSE = 75.06, MAE = 59.97), while the lowest were in Finland (r = 0.467, RMSE = 79.38, MAE = 63.24). In addition, the average PISA-2018 science scores of the countries were estimated with the XGBoost algorithm, and the average science scores calculated for all the countries studied were estimated with very high accuracy.


Data availability
Data will be made available upon request.
References
Aydın A, Erdağ C, Taş N (2011) A comparative evaluation of pisa 2003–2006 results in reading literacy skills: an example of top-five OECD countries and Turkey. Educ Sci Theory Pract 11:665–673
PISA (2021) Programme for ınternational student assessment. https://www.oecd.org/pisa/. Accessed 25 Nov 2021
Aksu G (2018) PISA başarısını tahmin etmede kullanılan veri madenciliği yöntemlerinin incelenmesi (in Turkish). Dissertation, Hacettepe University, Ankara, Türkiye.
Hu J, Yu R (2021) The effects of ICT-based social media on adolescents’ digital reading performance: a longitudinal study of PISA 2009, PISA 2012, PISA 2015 and PISA 2018. Comput Educ 175:104342. https://doi.org/10.1016/J.COMPEDU.2021.104342
Rolfe V (2021) Tailoring a measurement model of socioeconomic status: applying the alignment optimization method to 15 years of PISA. Int J Educ Res 106:101723. https://doi.org/10.1016/J.IJER.2020.101723
Gomes M, Hirata G, e Oliveira JBA (2020) Student composition in the PISA assessments: evidence from Brazil. Int J Educ Dev 79:102299. https://doi.org/10.1016/J.IJEDUDEV.2020.102299
Delprato M, Antequera G (2021) Public and private school efficiency and equity in Latin America: new evidence based on PISA for development. Int J Educ Dev 84:102404
Kim HJ, Yi P, Hong JI (2021) Are schools digitally inclusive for all? Profiles of school digital inclusion using PISA 2018. Comput Educ 170:104226. https://doi.org/10.1016/J.COMPEDU.2021.104226
Spruyt B, Van Droogenbroeck F, Van Den Borre L et al (2021) Teachers’ perceived societal appreciation: PISA outcomes predict whether teachers feel valued in society. Int J Educ Res 109:101833. https://doi.org/10.1016/J.IJER.2021.101833
Odell B, Gierl M, Cutumisu M (2021) Testing measurement invariance of PISA 2015 mathematics, science, and ICT scales using the alignment method. Stud Educ Eval 68:100965. https://doi.org/10.1016/J.STUEDUC.2020.100965
Stadler M, Herborn K, Mustafić M, Greiff S (2020) The assessment of collaborative problem solving in PISA 2015: an investigation of the validity of the PISA 2015 CPS tasks. Comput Educ 157:103964. https://doi.org/10.1016/J.COMPEDU.2020.103964
Song X, Mitnitski A, Cox J, Rockwood K (2004) Comparison of machine learning techniques with classical statistical models in predicting health outcomes. Stud Health Technol Inform 107:736–740. https://doi.org/10.3233/978-1-60750-949-3-736
Bühlmann P (2012) Bagging, boosting and ensemble methods. In: Gentle J, Härdle W, Mori Y (eds) Handbook of computational statistics. Springer, Berlin, pp 985–1022
Skurichina M, Duin RPW (2002) Bagging, boosting and the random subspace method for linear classifier. Pattern Anal Appl 5:121–135. https://doi.org/10.1007/s100440200011
Dietterich TG (2000) An experimental comparison of three methods for constructing ensembles of decision trees: bagging, boosting, and randomization. Mach Learn 402(40):139–157. https://doi.org/10.1023/A:1007607513941
Smola AJ, Schölkopf B (2004) A tutorial on support vector regression. Stat Comput 143(14):199–222. https://doi.org/10.1023/B:STCO.0000035301.49549.88
Masci C, Johnes G, Agasisti T (2018) Student and school performance across countries: a machine learning approach. Eur J Oper Res 269:1072–1085. https://doi.org/10.1016/j.ejor.2018.02.031
Chen J, Zhang Y, Wei Y, Hu J (2021) Discrimination of the contextual features of top performers in scientific literacy using a machine learning approach. Res Sci Educ 51:129–158. https://doi.org/10.1007/s11165-019-9835-y
Pejic A, Molcer PS, Gulaci K (2021) Math proficiency prediction in computer-based international large-scale assessments using a multi-class machine learning model. İn: SISY 2021–IEEE 19th ınternational symposium on ıntelligent informatics, proceedings, pp 49–54. https://doi.org/10.1109/SISY52375.2021.9582522
Bozak A, Aybek EC (2020) Comparison of artificial neural networks and logistic regression analysis in PISA science literacy success prediction. Int J Contemp Educ Res 7:99–111. https://doi.org/10.33200/ijcer.693081
Lezhnina O, Kismihók G (2021) Combining statistical and machine learning methods to explore German students’ attitudes towards ICT in PISA. Int J Res Method Educ 45(2):180–199. https://doi.org/10.1080/1743727X.2021.1963226
Zeybekoglu Ş, Koğar H (2022) Investigation of variables explaining science literacy in PISA 2015 Turkey sample. J Meas Eval Educ Psychol 13:145–163. https://doi.org/10.21031/epod.798106
Saarela M, Yener B, Zaki MJ, Kärkkäinen T (2016) Predicting math performance from raw large-scale educational assessments data: a machine learning approach. In: JMLR workshop and conference proceedings, vol 48, pp 1–8. http://medianetlab.ee.ucla.edu/papers/ICMLWS3.pdf
Toprak E (2017) Yapay sinir ağı, karar ağaçları ve ayırma analizi yöntemleri ile PISA 2012 matematik başarılarının sınıflandırılma performanslarının karşılaştırılması (in Turkish). Dissertation, Hacettepe University, Ankara, Türkiye.
Aksu G, Doğan N (2018) Veri Madenciliğinde Kullanılan Öğrenme Yöntemlerinin Farklı Koşullar Altında Karşılaştırılması (in Turkish). Ankara Univ J Fac Educ Sci (JFES) 51:71–100. https://doi.org/10.30964/auebfd.464262
Hu X, Gong Y, Lai C, Leung FKS (2018) The relationship between ICT and student literacy in mathematics, reading, and science across 44 countries: a multilevel analysis. Comput Educ 125:1–13. https://doi.org/10.1016/j.compedu.2018.05.021
Bezek-Güre Ö, Kayri M, Erdogan F (2020) Analysis of factors effecting PISA 2015 mathematics literacy via educational data mining. Educ Sci 45:393–415. https://doi.org/10.15390/EB.2020.8477
Aksu N (2019) Farklı ülkelerden PISA sinavina katılan öğrencilerin matematik okur yazarlığını etkileyen faktörlerin tahmin edilmesi (in Turkish). Dissertation, Aydın Adnan Menderes University, Türkiye
Puah S (2020) Predicting students’ academic performance: a comparison between traditional MLR and machine learning methods with PISA 2015. Dissertation, Ludwig-Maximilians-University, Munich,Germany. https://doi.org/10.31234/osf.io/2yshm
Rebai S, Ben Yahia F, Essid H (2020) A graphically based machine learning approach to predict secondary schools performance in Tunisia. Socioecon Plann Sci 70:100724. https://doi.org/10.1016/j.seps.2019.06.009
Kjærnsli M, Lie S (2004) PISA and scientific literacy: Similarities and differences between the nordic countries. Scand J Educ Res 48:271–286. https://doi.org/10.1080/00313830410001695736
Erbaş KE (2005) Factors affecting scientific literacy of students in Turkey in Programme for International Student Assessment (PISA). Dissertation, Middle East Technical University, Ankara, Türkiye
Anıl D (2009) Factors effecting science achievement of science students in programme for international students’ achievement (PISA) in Turkey. Educ Sci 34:87–100
Ho ESC (2010) Assessing the quality and equality of Hong Kong basic education results from PISA 2000+ to PISA 2006. Front Educ China 5:238–257. https://doi.org/10.1007/s11516-010-0016-z
Anagün Ş (2011) The impact of teaching-learning process variables to the students’ scientific literacy levels based on PISA 2006 results. Educ Sci 36:84–102
Acar T, Öğretmen T (2012) Analysis of 2006 PISA science performance via multilevel statistical methods (in Turkish). Educ Sci 37:178–189
Sun L, Bradley KD, Akers K (2012) A multilevel modelling approach to investigating factors impacting science achievement for secondary school students: PISA Hong Kong sample. Int J Sci Educ 34:2107–2125. https://doi.org/10.1080/09500693.2012.708063
Sälzer C, Heine JH (2016) Students’ skipping behavior on truancy items and (school) subjects and its relation to test performance in PISA 2012. Int J Educ Dev 46:103–113. https://doi.org/10.1016/j.ijedudev.2015.10.009
Kahraman Ü, Çelik K (2017) Analysis of PISA 2012 results in terms of some variables. J Hum Sci 14:4797–4808. https://doi.org/10.14687/jhs.v14i4.5136
Chen F, Cui Y (2020) Investigating the relation of perceived teacher unfairness to science achievement by hierarchical linear modeling in 52 countries and economies. Educ Psychol 40:273–295. https://doi.org/10.1080/01443410.2019.1652248
Karakoç-Alatli B (2020) Investigation of factors associated with science literacy performance of students by hierarchical linear modeling: PISA 2015 comparison of Turkey and Singapore. Educ Sci 45:17–49. https://doi.org/10.15390/EB.2020.8188
Rohatgi A, Scherer R (2020) Identifying profiles of students’ school climate perceptions using PISA 2015 data. Large Scale Assess Educ. https://doi.org/10.1186/s40536-020-00083-0
Antonelli-Ponti M, Monticelli PF, Versuti FM et al (2021) Academic achievement and the effects of the student’s learning context: a study on PISA data. Psico-USF 26:13–25. https://doi.org/10.1590/1413-82712021260102
Atasoy R, Çoban Ö, Yatağan M (2022) Effect of ıct use, parental support and student hindering on science achievement: evidence from Pisa 2018. J Learn Teach Digit Age 7:127–140. https://doi.org/10.53850/joltida.945869
Karakus M, Courtney M, Aydin H (2022) Understanding the academic achievement of the first- and second-generation immigrant students: a multi-level analysis of PISA 2018 data. https://doi.org/10.1007/s11092-022-09395-x
OECD (2015) OECD-PISA 2015 database. https://www.oecd.org/pisa/data/2015database/. Accessed 25 Nov 2021
OECD (2018) OECD-PISA 2018 database. https://www.oecd.org/pisa/data/2018database/. Accessed 25 Nov 2021
Vabalas A, Gowen E, Poliakoff E, Casson AJ (2019) Machine learning algorithm validation with a limited sample size. PLoS ONE 14:1–20. https://doi.org/10.1371/journal.pone.0224365
Ihaka R, Gentleman R (1996) R: a language for data analysis and graphics. J Comput Graph Stat 5:299–314. https://doi.org/10.1080/10618600.1996.10474713
R Core Team (2022) R: A language and environment for statistical computing. R Foundation for Statistical Computing. http://www.r-project.org/. Accessed 10 Oct 2022
Karatzoglou A, Smola A, Hornik K, Zeileis A (2004) kernlab—an S4 package for kernel methods in R. J Stat Softw 11:1–20. https://doi.org/10.18637/jss.v011.i09
Liaw A, Wiener M (2002) Classification and Regression by randomForest. R News 2/3:18–22. https://www.r-project.org/doc/Rnews/Rnews_2002-3.pdf
Chen T, Guestrin C (2016) XGBoost: a scalable tree boosting system. In: 22nd ACM SIGKDD ınternational conference on knowledge discovery and data mining, pp 785–794. https://doi.org/10.1145/2939672.2939785
Kuhn M (2008) Building predictive models in R using the caret package. Stat Softw 28(5):1–26. https://doi.org/10.18637/jss.v028.i05
Carslaw DC, Ropkins K (2012) Openair—an r package for air quality data analysis. Environ Model Softw 27–28:52–61. https://doi.org/10.1016/j.envsoft.2011.09.008
Wickham H (2016) ggplot2: elegant graphics for data analysis. Springer, New York
Pan S, Zheng Z, Guo Z, Luo H (2022) An optimized XGBoost method for predicting reservoir porosity using petrophysical logs. J Pet Sci Eng 208:109520. https://doi.org/10.1016/j.petrol.2021.109520
Yeşilkanat CM, Kobya Y, Taşkın H, Çevik U (2017) Spatial interpolation and radiological mapping of ambient gamma dose rate by using artificial neural networks and fuzzy logic methods. J Environ Radioact 175–176:78–93. https://doi.org/10.1016/j.jenvrad.2017.04.015
Fu T, Tang X, Cai Z et al (2020) Correlation research of phase angle variation and coating performance by means of Pearson’s correlation coefficient. Prog Org Coat 139:105459. https://doi.org/10.1016/j.porgcoat.2019.105459
Taylor R (1990) Interpretation of the correlation coefficient: a basic review. J Diagn Med Sonogr 6:35–39. https://doi.org/10.1177/875647939000600106
Kuhn M (2019) The caret Package. https://topepo.github.io/caret/index.html. Accessed 24 Mar 2023
Cortes C, Vapnik V (1995) Support-vector networks. Mach Learn 20:273–297. https://doi.org/10.1111/j.1747-0285.2009.00840.x
Drucker H, Surges CJC, Kaufman L et al (1997) Support vector regression machines. Adv Neural Inf Process Syst 1:155–161
Ibrahem Ahmed Osman A, Najah Ahmed A, Chow MF et al (2021) Extreme gradient boosting (Xgboost) model to predict the groundwater levels in Selangor Malaysia. Ain Shams Eng J 12:1545–1556. https://doi.org/10.1016/j.asej.2020.11.011
Wu J, Liu H, Wei G et al (2019) Flash flood forecasting using support vector regression model in a small mountainous catchment. Water (Switzerland) 11(7):1327. https://doi.org/10.3390/w11071327
Wu CL, Chau KW, Li YS (2008) River stage prediction based on a distributed support vector regression. J Hydrol 358:96–111. https://doi.org/10.1016/j.jhydrol.2008.05.028
Yu PS, Chen ST, Chang IF (2006) Support vector regression for real-time flood stage forecasting. J Hydrol 328:704–716. https://doi.org/10.1016/j.jhydrol.2006.01.021
Breiman L (2001) Random forests. Mach Learn 45:5–32. https://doi.org/10.1023/A:1010933404324
Breiman L (1996) Bagging predictors. Mach Learn 24:123–140. https://doi.org/10.1007/BF00058655
Ho TK (1998) The random subspace method for constructing decision forests. IEEE Trans Pattern Anal Mach Intell 20(8):832–844. https://doi.org/10.1109/34.709601
Yesilkanat CM (2020) Spatio-temporal estimation of the daily cases of COVID-19 in worldwide using random forest machine learning algorithm. Chaos Solitons Fractals 140:110210. https://doi.org/10.1016/j.chaos.2020.110210
Wang H, Yilihamu Q, Yuan M et al (2020) Prediction models of soil heavy metal(loid)s concentration for agricultural land in Dongli: a comparison of regression and random forest. Ecol Indic. https://doi.org/10.1016/j.ecolind.2020.106801
Prasad AM, Iverson LR, Liaw A (2006) Newer classification and regression tree techniques: bagging and random forests for ecological prediction. Ecosystems 9:181–199. https://doi.org/10.1007/s10021-005-0054-1
Gislason PO, Benediktsson JA, Sveinsson JR (2006) Random forests for land cover classification. Pattern Recognit Lett 27:294–300. https://doi.org/10.1016/j.patrec.2005.08.011
Zhang H, Yin S, Chen Y et al (2020) Machine learning-based source identification and spatial prediction of heavy metals in soil in a rapid urbanization area, eastern China. J Clean Prod 273:122858. https://doi.org/10.1016/j.jclepro.2020.122858
Zeng N, Ren X, He H et al (2019) Estimating grassland aboveground biomass on the Tibetan Plateau using a random forest algorithm. Ecol Indic 102:479–487. https://doi.org/10.1016/j.ecolind.2019.02.023
Friedman J (2001) Greedy function approximation: a gradient boosting machine. Ann Stat 29(5):1189–1232
Zhu X, Chu J, Wang K et al (2021) Prediction of rockhead using a hybrid N-XGBoost machine learning framework. J Rock Mech Geotech Eng 13:1231–1245. https://doi.org/10.1016/j.jrmge.2021.06.012
Ma M, Zhao G, He B et al (2021) XGBoost-based method for flash flood risk assessment. J Hydrol 598:126382. https://doi.org/10.1016/j.jhydrol.2021.126382
Hu L, Wang C, Ye Z, Wang S (2021) Estimating gaseous pollutants from bus emissions: a hybrid model based on GRU and XGBoost. Sci Total Environ 783:146870. https://doi.org/10.1016/j.scitotenv.2021.146870
Wang J, He L, Lu X et al (2022) A full-coverage estimation of PM2.5 concentrations using a hybrid XGBoost-WD model and WRF-simulated meteorological fields in the Yangtze River Delta Urban Agglomeration, China. Environ Res. https://doi.org/10.1016/j.envres.2021.111799
Razzak MI, Imran M, Xu G (2020) Big data analytics for preventive medicine. Springer, London
Adi E, Anwar A, Baig Z, Zeadally S (2020) Machine learning and data analytics for the IoT. Neural Comput Appl 32:16205–16233. https://doi.org/10.1007/s00521-020-04874-y
Chen M, Mao S, Liu Y (2014) Big data: A survey. Mob Networks Appl 19:171–209. https://doi.org/10.1007/S11036-013-0489-0
Köhler O, Reiss K, Riecke-Baulecke T (2016) 15 Jahre PISA: Ergebnisse und Perspektiven (in German). Schulmanagemet-Handbuch, vol 157. Cornelsen Verlag, München
Çelen FK, Çelik A, Seferoğlu S (2011) Türk eğitim sistemi ve PISA sonuçları (in Turkish). In: XIII. Academic ınformatics conference, vol 765–773 https://yunus.hacettepe.edu.tr/~sadi/yayin/AB11_Celen-Celik_Seferoglu_PISA-Sonuclari.pdf
Darling-Hammond L (2014) What can PISA tell us about US education policy? New Engl J Public Policy 26(1):1–14. https://scholarworks.umb.edu/nejpp/vol26/iss1/4/
Martens K, Niemann D (2013) When do numbers count? The differential impact of the PISA rating and ranking on education policy in Germany and the US. German Politics 22:314–332. https://doi.org/10.1080/09644008.2013.794455
Aydın A, Selvitopu A, Kaya M (2019) Eğitime Yapılan Yatırımlar ve PISA 2015 Sonuçları: Karşılaştırmalı Bir İnceleme (in Turkish). Elem Educ Online 17:1283–1301. https://doi.org/10.17051/ILKONLINE.2018.466346
Gürlen E, Demirkaya AS, Doğan N (2019) Uzmanların Pısa ve Tımms Sınavlarının Eğitim Politika ve Programlarına Etkisine İlişkin Görüşleri (in Turkish). Mehmet Akif Ersoy Univ J Educ Fac. https://doi.org/10.21764/MAEUEFD.599615
Dobbins M, Martens K (2011) Towards an education approach à la finlandaise? French education policy after PISA. J Edu Policy 27:23–43. https://doi.org/10.1080/02680939.2011.622413
Araujo L, Saltelli A, Schnepf S (2017) Do pisa data justify pisa-based education policy? Int J Comp Educ Dev 19:20–34. https://doi.org/10.1108/IJCED-12-2016-0023/FULL/PDF
Steiner-Khamsi G, Waldow F (2018) PISA for scandalisation, PISA for projection: the use of international large-scale assessments in education policy making—an introduction. Glob Soc Edu 16:557–565. https://doi.org/10.1080/14767724.2018.1531234
Lingard B, Sellar S (2013) Globalisation and sociology of education policy: the case of PISA. Contemp Debates Sociol Educ. https://doi.org/10.1057/9781137269881_2
Figazzolo L (2009) Impact of PISA 2006 on the education policy debate. Education International. https://www.ei-ie.org/file/474
Acknowledgements
The authors would like to express sincere gratitude towards OECD for its generous publication of the data.
Funding
There is no funding for this study.
Author information
Authors and Affiliations
Corresponding author
Ethics declarations
Consent statement
Not applicable.
Conflict of interest
The authors declare that they have no conflicts of interest. The authors alone are responsible for the content and writing of this paper.
Additional information
Publisher's Note
Springer Nature remains neutral with regard to jurisdictional claims in published maps and institutional affiliations.
Supplementary Information
Below is the link to the electronic supplementary material.
Rights and permissions
Springer Nature or its licensor (e.g. a society or other partner) holds exclusive rights to this article under a publishing agreement with the author(s) or other rightsholder(s); author self-archiving of the accepted manuscript version of this article is solely governed by the terms of such publishing agreement and applicable law.
About this article
Cite this article
Acıslı-Celik, S., Yesilkanat, C.M. Predicting science achievement scores with machine learning algorithms: a case study of OECD PISA 2015–2018 data. Neural Comput & Applic 35, 21201–21228 (2023). https://doi.org/10.1007/s00521-023-08901-6
Received:
Accepted:
Published:
Issue Date:
DOI: https://doi.org/10.1007/s00521-023-08901-6


