
Abstract
Interpretive ranking process (IRP) is a multi-criteria decision making method based on paired comparison in an interpretive manner. Due to paired comparisons, the number of interpretations to be made for n ranking variables are \(n(n-1)/2\) to establish dominance with respect to each reference variable or criterion. IRP is a knowledge intensive method and thus a large number of comparisons poses a limitation on the number of rankling as well as reference variables to be considered in the design of the decision problem. This paper is intended to make the process of comparison more efficient so that this limitation on number of variables can be relaxed to handle comparatively large size problems as well. The number of interpretive comparisons can be drastically reduced by considering both implicit and transitive dominance relationships. It provides a critical review of IRP steps and suggests improvements to make it more efficient. It then illustrates the modified IRP method on a couple of already published examples (including an example on post-disaster management) and summarizes the reduction in interpretive comparisons that indirectly gives a measure of increase in its efficiency.
References
Gangotra, A., & Shankar, R. (2016). Strategies in managing risks in the adoption of business analytics practices: A case study of a telecom service provider. Journal of Enterprise Information Management, 29(3), 374–399.
Haleem, A., Sushil, Qadri, M. A., & Kumar, S. (2012). Analysis of critical success factors of world-class manufacturing practices: An application of interpretive structural modelling and interpretive ranking process. Production Planning & Control, 23(10–11), 722–734.
Ho, W., Xu, X., & Dey, P. K. (2010). Multi-criteria decision making approaches for supplier evaluation and selection: A literature review. European Journal of Operational Research, 202(1), 16–24.
Hughes, D. L., Dwivedi, Y. K., & Rana, N. P. (2017). Mapping IS failure factors on PRINCE2\(\textregistered \) stages: An application of interpretive ranking process (IRP). Production Planning & Control. doi:10.1080/09537287.2017.1311431.
Jeng, D. J. F., & Huang, K. H. (2015). Strategic project portfolio selection for national research institutes. Journal of Business Research, 68(11), 2305–2311.
Kaur, H., Singh, S. P., & Glardon, R. (2016). An integer linear program for integrated supplier selection: A sustainable flexible framework. Global Journal of Flexible Systems Management, 17(2), 113–134.
Lamata, M. T., Liern, V., & Pérez-Gladish, B. (2016). Doing good by doing well: A MCDM framework for evaluating corporate social responsibility attractiveness. Annals of Operations Research. doi:10.1007/s10479-016-2271-8.
Luthra, S., Garg, D., & Haleem, A. (2015). Critical success factors of green supply chain management for achieving sustainability in indian automobile industry. Production Planning & Control, 26(5), 339–362.
Mangla, S. K., Kumar, P., & Barua, M. K. (2014). A flexible decision framework for building risk mitigation strategies in green supply chain using SAP-LAP and IRP approaches. Global Journal of Flexible Systems Management, 15(3), 203–218.
Mangla, S. K., Kumar, P., & Barua, M. K. (2015). Flexible decision modeling for evaluating the risks in green supply chain using fuzzy AHP and IRP methodologies. Global Journal of Flexible Systems Management, 16(1), 19–35.
Rouyendegh, B. D., Oztekin, A., Ekong, J., & Dag, A. (2016). Measuring the efficiency of hospitals: A fully-ranking DEA–FAHP approach. Annals of Operations Research. doi: 10.1007/s10479-016-2330-1.
Saaty, T. L. (1980). The analytical hierarchy process: Planning, priority setting, resource allocation. New York: Mcgraw-Hill.
Saaty, T. L. (1990). How to make decision: The analytical decision process. European Journal of Operational Research, 48(1), 9–26.
Sharma, V., Dixit, A. R., & Qadri, M. A. (2016). Modeling lean implementation for manufacturing sector. Journal of Modelling in Management, 11(2), 405–426.
Simon, H. A. (1957). Rationality and decision-making- models of man. New York: Wiley.
Sushil, (2001). SAP-LAP framework. Global Journal of Flexible Systems Management, 2(1), 51–55.
Sushil, (2005). Interpretive matrix: A tool to aid interpretation of management and social research. Global Journal of Flexible Systems Management, 6(2), 27–30.
Sushil, (2009a). Interpretive ranking process. Global Journal of Flexible Systems Management, 10(4), 1–10.
Sushil. (2009b). SAP-LAP linkages: A generic interpretive framework for analyzing managerial contexts. Global Journal of Flexible Systems Management, 10(2), 11–20.
Sushil. (2012). Interpreting the interpretive structural model. Global Journal of Flexible Systems Management, 13(2), 87–106.
Sushil. (2016). How to check correctness of total interpretive structural models? Annals of Operations Research. doi:10.1007/s10479-016-2312-3.
Sushil. (2017a). Multi-criteria valuation of flexibility initiatives using integrated TISM-IRP with a big data framework. Production Planning & Control, 28(11–12), 999–1010.
Sushil. (2017b). Theory building using SAP-LAP linkages: An application in the context of disaster management. Annals of Operations Research. doi:10.1007/s10479-017-2425-3.
Tzeng, G. H., & Huang, C. Y. (2012). Combined DEMATEL technique with hybrid MCDM methods for creating the aspired intelligent global manufacturing and logistics systems. Annals of Operations Research, 197(1), 159–190.
Vaidya, O. S., & Kumar, S. (2006). Analytic hierarchy process: An overview of applications. European Journal of Operational Research, 169(1), 1–29.
Ware, N. R., Singh, S. P., & Banwet, D. K. (2014). Modeling flexible supplier selection framework. Global Journal of Flexible Systems Management, 15(3), 261–274.
Warfield, J. N. (1974). Toward interpretation of complex structural models. IEEE Transactions on Systems, Man and Cybernetics, 4(5), 405–417.
Zavadskas, E. K., Turskis, Z., & Kildienė, S. (2014). State of art surveys of overviews on MCDM/MADM methods. Technological and Economic Development of Economy, 20(1), 165–179.
Author information
Authors and Affiliations
Corresponding author
Appendices
Appendix I
1.1 Example 1: Ranking of actors with respect to processes (Sushil 2009a)
1.1.1 Exhibit I.1: Ranking and reference variables
Variables | |
|---|---|
Ranking variables—Actors | |
A1–CEO of ABB (Parent Company) | |
A2–ABB India’s management | |
A3–ABB India’s employees | |
A4–Government of India | |
Reference variables—Processes | |
P1–Technology and business strategy alignment | |
P2–Mergers and acquisitions | |
P3–Backward integration | |
P4–Offering technological solution to customer |
1.1.2 Exhibit I.2: Cross-interaction matrix ‘Actor \(\times \) Process’
Contextual Relationship : Roles of actors in various processes
-
(a)
Binary Matrix

- (b) :
-
Interpretive Matrix

1.1.3 Exhibit I.3: Interpretive logic—knowledge base-ranking of actors w.r.t. processes
Paired comparison | Interaction with process | Interpretive logic |
|---|---|---|
A1 Dominating A2 | P1 | Vision/global Strategy have more influence than domestic strategy on Technology and Business Strategy Alignment |
P2 | Provision of resources for M&A is more important than Post M&A integration | |
A2 Dominating A3 | P4 | Understanding Customer needs for developing solutions is more important than simply developing technological solutions |
A4 dominating A1 | P2 | Regulation for M&A influence the M&A Process more than provisions of resources |
1.1.4 Exhibit I.4: Pair-wise dominance of actors for different processes
-
(a) Dominating Interaction Matrix of Actors for Process P1

-
(b) Dominating Interaction Matrix of Actors for Process P2
-
(c) Dominating Interaction Matrix of Actors for Process P3
-
(d) Dominating Interaction Matrix of Actors for Process P4


1.1.5 Exhibit I.5: Dominance matrix—ranking of actors w.r.t. processes

Appendix II
1.1 Example 2: Ranking of actions w.r.t. performance areas (Sushil 2009a)
1.1.1 Exhibit II.1: Ranking and reference variables
Variables |
|---|
Ranking variables—Actions |
A1*–Technology management as core function |
A2*–Core competence building agenda |
A3*–Backward integration strategy |
A4*–Develop in-house R&D |
Reference variables—Performance areas |
P1*–Sustainable competitive advantage |
P2*–Customer satisfaction |
P3*–Dependence on imported technology |
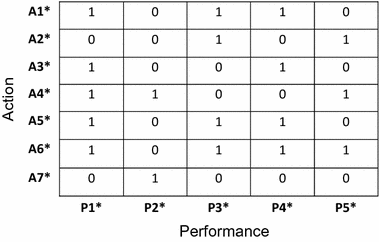
1.1.2 Exhibit II.2: Cross-interaction matrix ‘Action \(\times \) Performance’
Contextual Relationship: Influence of actions on various performance areas
- (a) :
-
Binary Matrix

-
(b)
Interpretive Matrix

1.1.3 Exhibit II.3: Pair-wise dominance of actions for different performance areas
-
(a) Dominating Interaction Matrix of Actions for Performance Area P1*
-
(b) Dominating Interaction Matrix of Actions for Performance Area P2*
-
(c) Dominating Interaction Matrix of Actions for Performance Area P3*
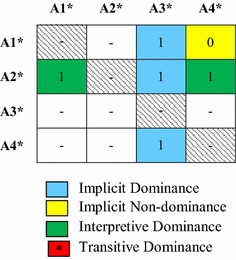


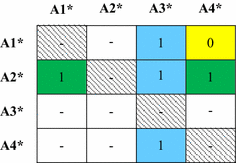
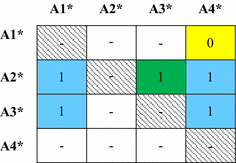
1.1.4 Exhibit II.4: Dominance matrix—ranking of actions w.r.t. performance

Appendix III
1.1 Example 3: Ranking of flexibility initiatives w.e.f. to benefits and costs (Sushil 2017a)
Exhibit III.1: Ranking and reference variables
Variables | |
|---|---|
Ranking Variables—Flexibility Initiatives | |
F1–Variable capacity | |
F2–Multi-skilling | |
F3–Flexi-time/Flexi-place | |
Reference Variables—Benefits | |
B1–Low inventory | |
B2–Ability to handle unprecedented job requirements | |
B3–Reduction in manpower cost | |
B4–Work-life balance | |
Reference Variables—Costs | |
C1–Training cost | |
C2–Coordination cost | |
C3–Cost of technology | |
C4–Complex job allocation |
1.1.1 Exhibit III.2: Cross-interaction Matrix—Flexibility Initiatives \(\times \) Criteria (Benefits/Costs)
Contextual Relationship: Flexibility initiatives generating benefits and incurring costs
-
(a) Binary Matrix

-
(b) Interpretive Matrix

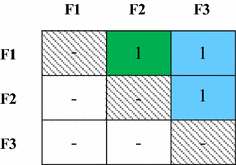
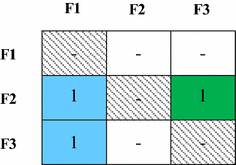
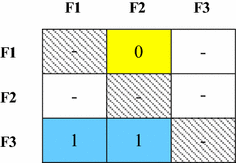
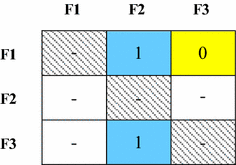
1.1.2 Exhibit III.3: Pair-wise dominance of flexibility initiatives for different benefits and costs
-
(a) Dominating Interaction Matrix of Flexibility Initiatives for Benefit B1
-
(b) Dominating Interaction Matrix of Flexibility Initiatives for Benefit B2
-
(c) Dominating Interaction Matrix of Flexibility Initiatives for Benefit B3
-
(d) Dominating Interaction Matrix of Flexibility Initiatives for Benefit B4
-
(e) Dominating Interaction Matrix of Flexibility Initiatives for Cost C1
-
(f) Dominating Interaction Matrix of Flexibility Initiatives for Cost C2
-
(g) Dominating Interaction Matrix of Flexibility Initiatives for Cost C3
-
(h) Dominating Interaction Matrix of Flexibility Initiatives for Cost C4
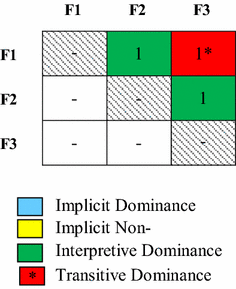


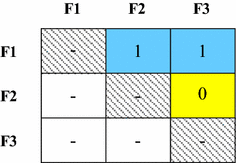
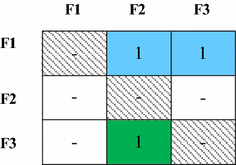
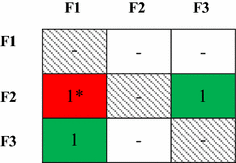
1.1.3 Exhibit III.4: Dominance matrix—ranking of flexibility initiatives w.r.t benefits and costs

Appendix IV
1.1 Example 4: Ranking of post-disaster actions w.r.t. intended performance (Sushil 2017b)
1.1.1 Exhibit IV.1: Ranking and reference variables
Variables | |
|---|---|
Ranking Variables—Action (Post-disaster, on-site) | |
A1*–Improvisation for rescue (Volunteers) | |
A2*–Communication with all modes (Local administration) | |
A3*–Activate medical support (Local bodies/Hospitals) | |
A4*–Channelize supplies (NGOs/Government bodies) | |
A5*–Sending professional rescue teams (Military/NGOs) | |
A6*–Committed supervision (Executives/Political leadership) | |
A7*–Clearing the site (Trained Professionals) | |
Reference Variables—Performance (Intended) | |
P1*–Loss of life | |
P2*–Loss of property | |
P3*–Timeframe for rescue/relief | |
P4*–Relief from injuries | |
P5*–Timely reach of aid |
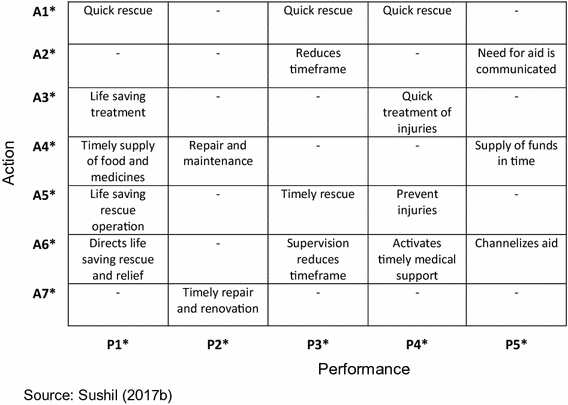
1.1.2 Exhibit IV.2: Cross-interaction matrix: Action (A*) \(\times \) Performance (P*)
Contextual Relationship: Influence of actions on various performance areas
-
(a) Binary Matrix
-
(b) Interpretive Matrix


1.1.3 Exhibit IV.3: Pair-wise dominance of post-disaster actions for different performance areas
Dominating Interaction Matrix of Post-Disaster Actions for Performance P1*

Dominating Interaction Matrix of Post-Disaster Actions for Performance P2*

Dominating Interaction Matrix of Post-Disaster Actions for Performance P3*

Dominating Interaction Matrix of Post-Disaster Actions for Performance P4*

Dominating Interaction Matrix of Post-Disaster Actions for Performance P5*

1.1.4 Exhibit IV.4: Dominance matrix—ranking of post disaster actions w.r.t. intended performance

Rights and permissions
About this article

Cite this article
Sushil Efficient interpretive ranking process incorporating implicit and transitive dominance relationships. Ann Oper Res 283, 1489–1516 (2019). https://doi.org/10.1007/s10479-017-2608-y
Published:
Issue Date:
DOI: https://doi.org/10.1007/s10479-017-2608-y