Abstract
Temperature is a key factor in the growth and development of all organisms1,2. Plants have to interpret temperature fluctuations, over hourly to monthly timescales, to align their growth and development with the seasons. Much is known about how plants respond to acute thermal stresses3,4, but the mechanisms that integrate long-term temperature exposure remain unknown. The slow, winter-long upregulation of VERNALIZATION INSENSITIVE3 (VIN3)5–7, a PHD protein that functions with Polycomb Repressive Complex 2 to epigenetically silence FLOWERING LOCUS C (FLC) during vernalization, is central to plants interpreting winter progression5,6,8–11. Here, by a forward genetic screen, we identify two dominant mutations of the transcription factor NTL8 that constitutively activate VIN3 expression and alter the slow VIN3 cold induction profile. In the wild-type, the NTL8 protein accumulates slowly in the cold, and directly upregulates VIN3 transcription. Through combining computational simulation and experimental validation, we show that a major contributor to this slow accumulation is reduced NTL8 dilution due to slow growth at low temperatures. Temperature-dependent growth is thus exploited through protein dilution to provide the long-term thermosensory information for VIN3 up-regulation. Indirect mechanisms involving temperature-dependent growth, in addition to direct thermosensing, may be widely relevant in long-term biological sensing of naturally fluctuating temperatures.
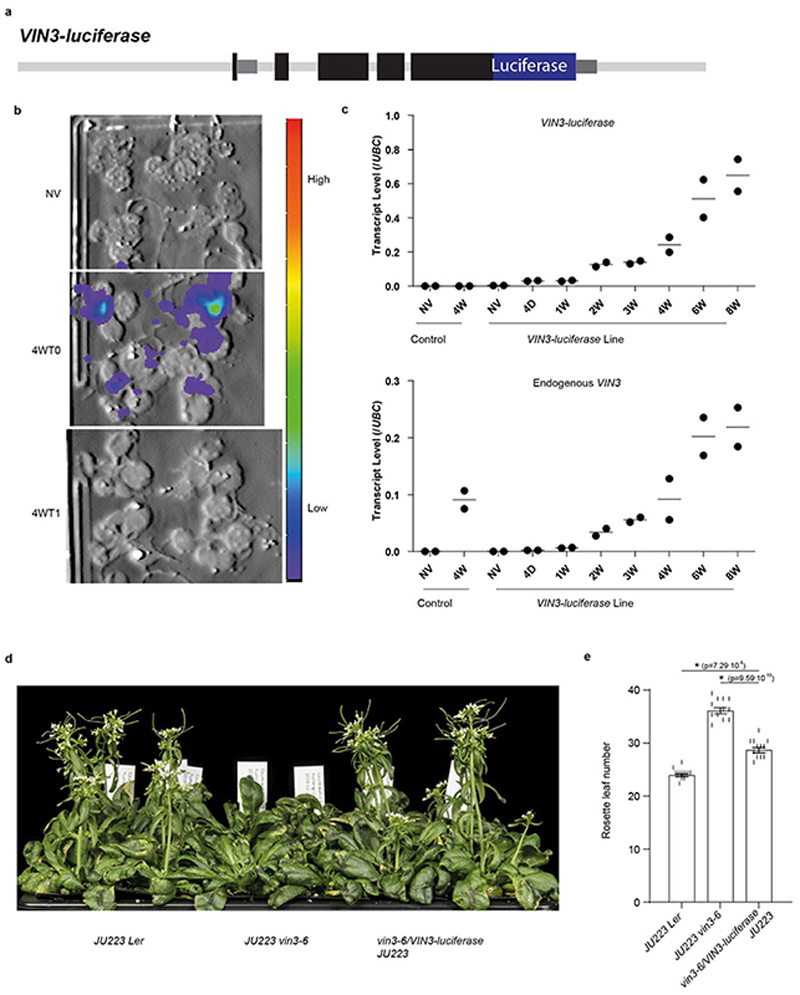
Multiple thermosensory pathways have been shown to regulate VIN3 expression over different timescales10,11, but what accounts for the slow dynamics of VIN3 as plants experience weeks of cold was not known. To investigate this, we identified mutants that showed early cold responses, but could not upregulate VIN3 over longer cold. A VIN3-luciferase translational reporter (Extended Data Fig.1a) was transformed into a Landsberg vin3-6 mutant. A single-copy transgenic line, with VIN3-luciferase expression similar to endogenous VIN3 (Extended Data Fig.1b,c), was selected as the mutagenesis progenitor. The VIN3-luciferase reporter substantially rescued the vernalization defect of vin3-6 (Extended Data Fig.1d,e).
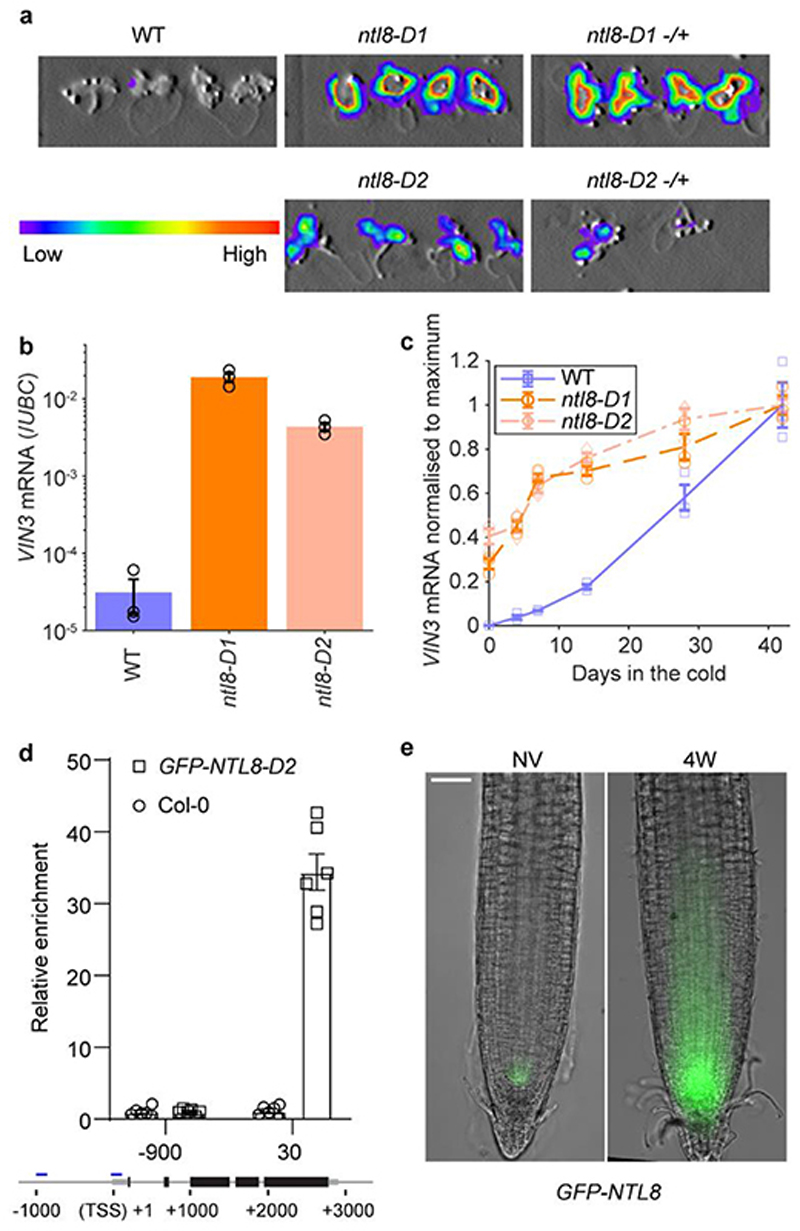
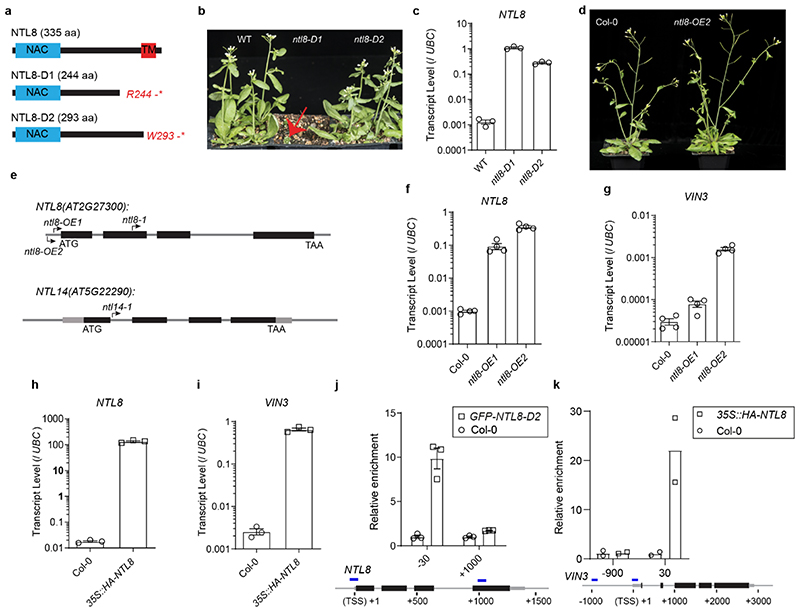
Two dominant mutants were identified showing high VIN3 expression in the warm (Fig.1a,b). The mutations, named ntl8-D1 and ntl8-D2, prematurely terminated NTL8 translation and showed morphological defects (with ntl8-D1 showing more extreme dwarfism and leaf deformation) and high NTL8 expression (Extended Data Fig.2a-c), in addition to VIN3 mis-expression. The ntl8-D allele dominance suggested that the short NTL8 proteins without the C-terminal transmembrane domain are constitutively active, as found in studies linking these NAC transmembrane proteins with salt signalling, ER stress and trichome development12–17. However, protein truncation is not the only path to ectopic activity as T-DNA insertions in the NTL8 promoter also led to NTL8 overexpression and constitutive VIN3 expression prior to cold, but without morphological defects (Extended Data Fig.2d-i). NTL8 binds to NTL8 and VIN3 promoter regions in vitro 18 and in vivo (Fig.1d,Extended Data Fig.2j,k). High VIN3 and NTL8 expression prior to cold for ntl8-D is thus likely through direct NTL8 activation.
Fig. 1. Role for NTL8 in long-term cold-induced accumulation of VIN3.
a, Luminescence assay for ntl8-D1, ntl8-D2 before cold (5°C), homozygous and heterozygous (-/+) plants shown. WT: progenitor line carrying transgenic VIN3-luciferase. 14 independent repeats with similar results. b, qPCR VIN3 transcript levels in warm (20°C) for WT, ntl8-D1 and ntl8-D2, normalized to UBC. Error bars s.e.m. of three biological replicates (data from 0 days timepoint, panel c, not normalized to maximum). c, Increase in normalized qPCR VIN3 transcript levels after different cold durations (5°C). Levels normalized to UBC, and then to 42-day timepoint (maximum VIN3 level) in each genotype. Error bars s.e.m. of three biological replicates. d, ChIP analysis of NTL8 binding at VIN3. Control: Col-0. Error bars s.e.m. of six replicates. -900,30: 900bp upstream, 30bp downstream of transcription start site. e, GFP-NTL8 localization in transgenic plant root tips carrying NTL8prom::GFP-NTL8; left NV: Non-Vernalized (20°C), right 4-week cold (5°C). Scale=50μm. Five independent repeats with similar results (including data in Fig.4d).
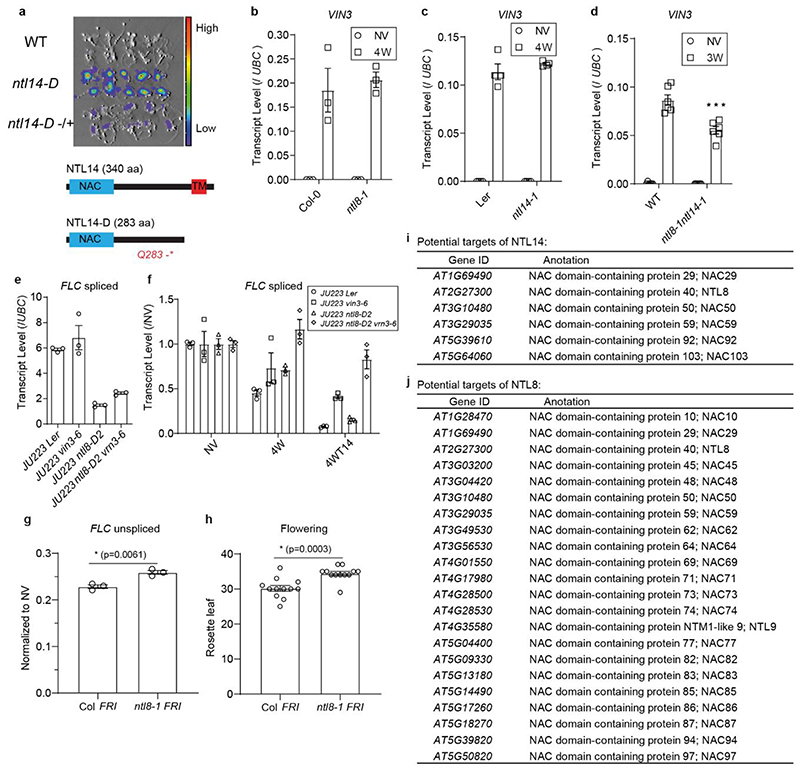
VIN3 expression was unaffected in the loss-of-function ntl8-1. NTL8 belongs to a 14-member NAC transcription factor subfamily14,19–22. NTL14 is the closest homologue to NTL8 and conditionally induced expression causes ectopic VIN3 expression (microarray data,15). Indeed, we identified an ntl14-D mutation as constitutively expressing VIN3 in our VIN3-Luciferase screen (Extended Data Fig.3a). We therefore analysed an ntl8-1, ntl14-1 double loss-of-function mutant, and found VIN3 cold-induction significantly attenuated (Extended Data Fig.2e,3b-d). Interestingly, ntl8-D can overcome the vernalization requirement for FLC silencing, while ntl8-1 showed compromised FLC silencing and cold-acceleration of flowering (Extended Data Fig.3e-h). These data suggest the extensive NAC-TM family (Extended Data Fig.3i,j) function as a redundant network in vernalization and other abiotic responses.
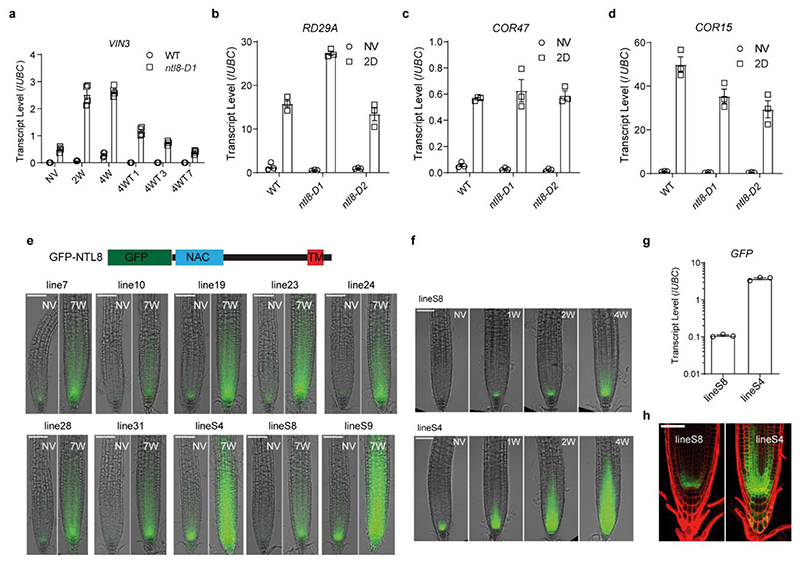
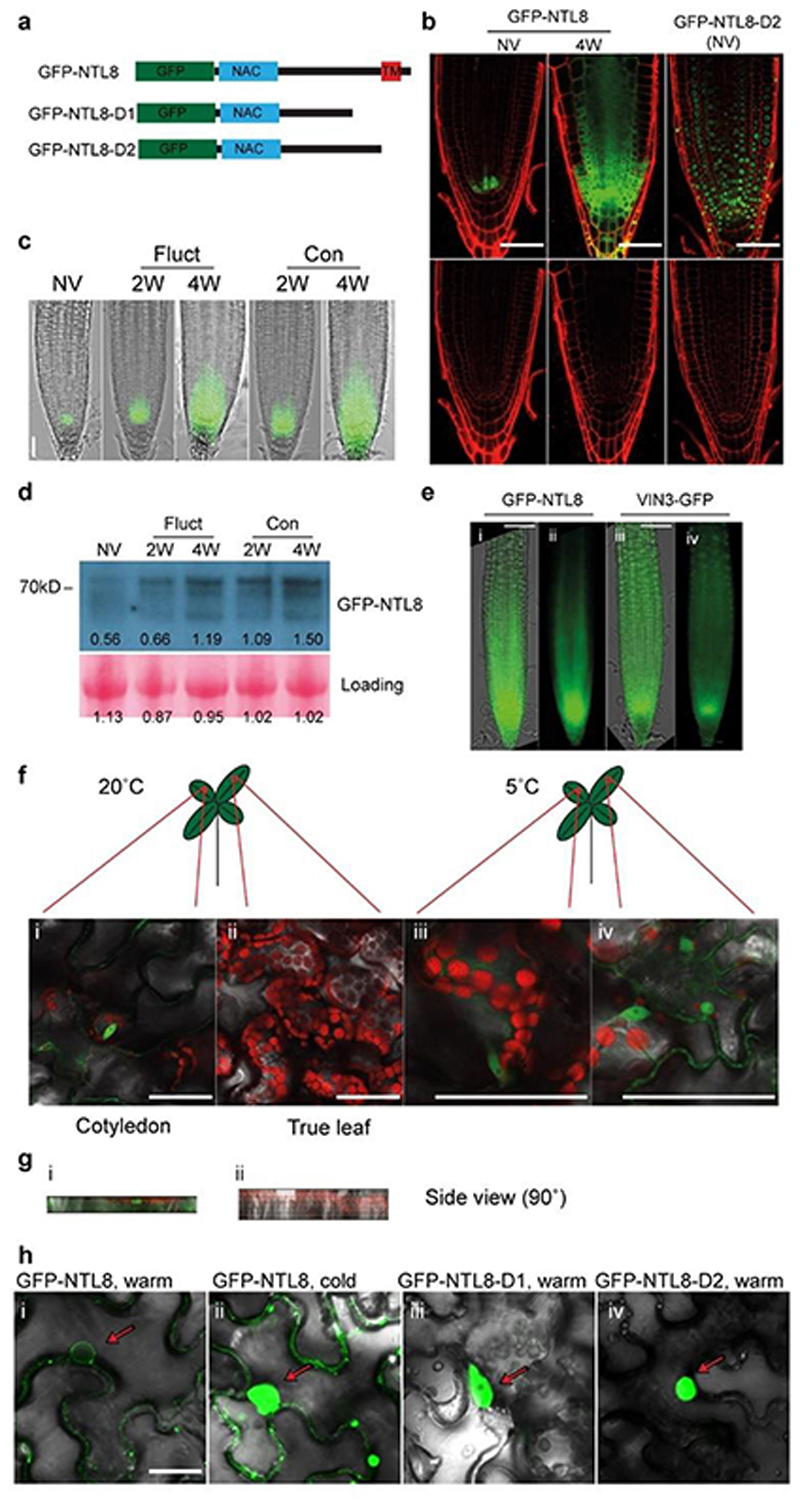
ntl8-D pre-activated VIN3 expression with limited further increase beyond 1 week cold exposure (Fig.1c,Extended Data Fig.4a). Cold stress response genes were not consistently affected in ntl8-D (Extended Data Fig.4b-d). Thus, NTL8’s predominant vernalization role is in long-term VIN3 temperature regulation. To assess NTL8 protein dynamics, we generated transgenics carrying translational GFP fusions to both wild-type and truncated NTL8 proteins. During cold (including fluctuating temperatures), GFP-NTL8 signal increased in leaves and root meristem regions, coincident with high VIN3 meristem expression (Fig.1e,Extended Data Fig.4e-h,5a-g). The truncated protein was nuclear-localized in stable transgenics and highly expressed in all cells, likely via NTL8 transcriptional auto-activation (Extended Data Fig.2c,j,5b). Wild-type GFP-NTL8 protein was predominantly plasma membrane and ER-localized (around the nucleus) in stable transgenics and N. benthamiana transfection assays (Extended Data Fig.5b,h,19). In stable transgenics, there was no change to this subcellular localization in response to cold (Extended Data Fig.5b). Therefore, long-term cold increased overall NTL8 protein amount, rather than changing subcellular localization. A fraction of wild-type NTL8 protein must translocate to the nucleus to activate VIN3, potentially through cleavage12,19 or alternative splicing (Extended Data Fig.6a-e).
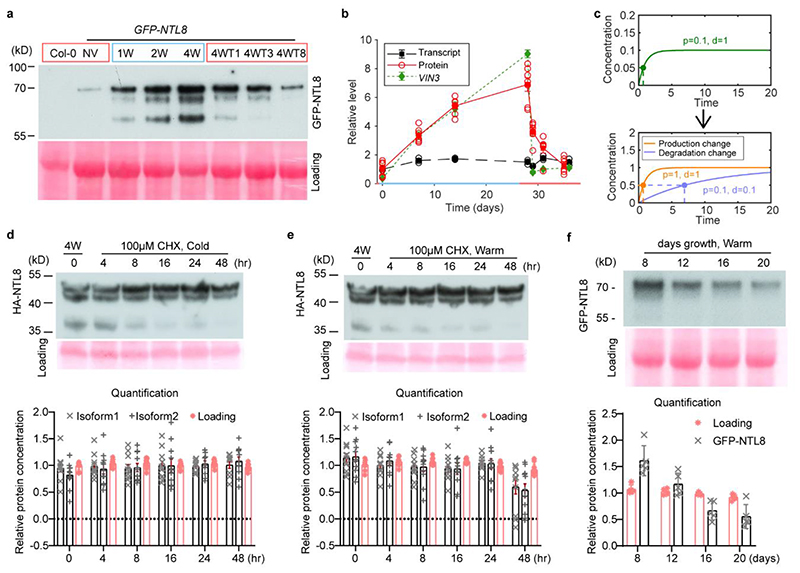
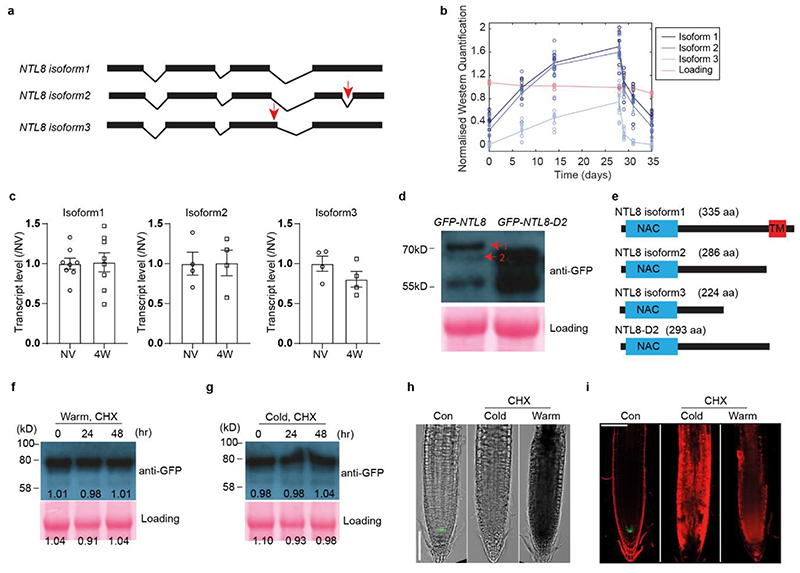
We detected alternatively spliced NTL8 and three GFP-NTL8 protein isoforms (Fig.2a, Extended Data Fig.6a,b). Isoform 1 is full-length NTL8 protein, while shorter isoforms lacked the transmembrane domain. All isoforms increased gradually with weeks of cold, and decreased in post-cold warm, consistent with the long-term VIN3 cold response. However, isoform3 showed a faster warm response, and could be involved in other temperature pathways regulating VIN3 (Fig.2b, Extended Data Fig.6b). The gradual increase occurred without a concomitant increase in NTL8 transcript levels or alternatively spliced transcripts (Fig.2b, Extended Data Fig.6c), arguing against transcriptional up-regulation or alternative splicing being major factors in gradual NTL8 accumulation in the cold.
Fig. 2. NTL8 protein accumulates slowly in cold with constitutively slow turnover.
a, Western analysis of NTL8 protein in whole plants under different cold durations. Negative control: non-transgenic Col-0. NV (20°C),1W,2W,4W: 1,2,4 weeks of cold (5°C). 4WTn: 4 weeks cold followed by n-days warm (20°C), with n=1,3,8. Blue/red squares indicate cold/warm conditions. Experiment was repeated independently seven times with similar results; see Supplementary Figure 1. b, Comparison of VIN3 transcript dynamics, NTL8 protein and transcript dynamics. NTL8 protein dynamics measured as summed intensity of top two bands (a). Transcript levels determined using samples from same treatment as (a). Error bars s.e.m. of six (VIN3), seven (NTL8 protein) and three (NTL8 transcript) biological replicates. NTL8 protein, transcript levels normalised to NV measurement; VIN3 transcript levels normalised to 1W cold. Blue/red colour of x-axis indicates cold (5°C)/warm (20°C). c, Slow accumulation requires low degradation rates. Simple model (Supplementary Methods) demonstrates that time to reach half final concentration (t½, dashed line) is unchanged by production rate changes but is affected by degradation rate changes. d,e Analysis of NTL8 turnover rate after 4-week cold treatment (5°C), with subsequent 100μM cycloheximide (CHX) treatment in cold (d) or warm (e, 20°C) for indicated time, with HA-tagged NTL8. Growth also inhibited by CHX, so measurements reflect protein stability, with little effect from dilution. Quantification: mean ± s.e.m of 11 biological replicates. f, Western analysis of NTL8 protein concentration at different developmental phases in warm (20°C).
Quantification: mean ± s.e.m of five biological replicates. All westerns carried out with equal weight of whole seedlings. Ponceau stainings (a,f) run on from separate gels and used as processing controls. Ponceau stainings (d,e) from same gel used as loading control. For gel source data, see Supplementary Figure 1.
To understand slow VIN3 and NTL8 accumulation dynamics we considered the problem theoretically. A single-step cold-induced increase in protein production with fast degradation cannot lead to slow accumulation, as the accumulation timescale is generally dictated by the degradation timescale (Fig.2c). We therefore explored whether low NTL8 turnover might contribute to the slow VIN3 increase. Inhibition of translation using cycloheximide revealed NTL8 isoforms1,2 have half-lives of >2 days in cold and warm conditions, with plants afterwards dying from cycloheximide exposure (Fig.2d,e,Extended Data Fig.6f-i). NTL8 therefore always has low turnover, potentially similar to plant proteins with half-lives of months23.
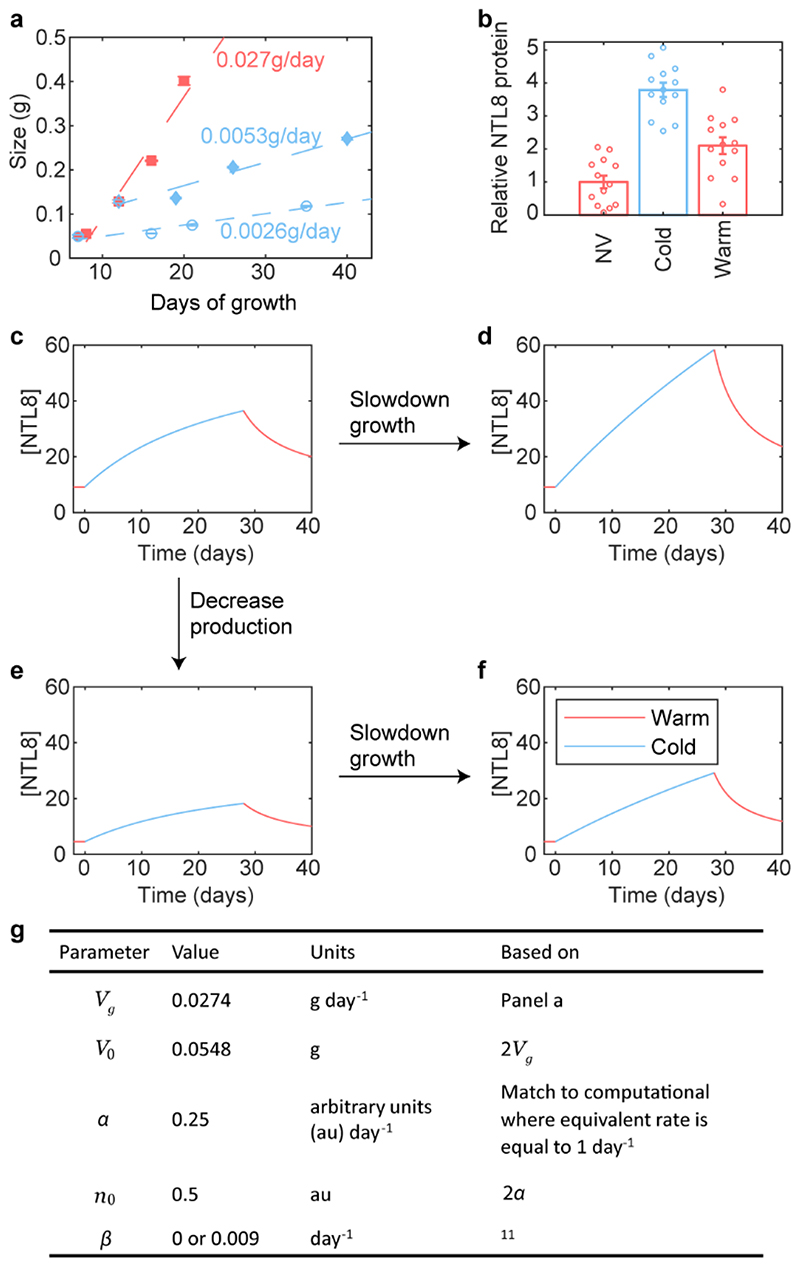
With slow degradation, the dominant factor determining NTL8 accumulation becomes growth-dependent dilution, as modelled previously for a hormone24. We reasoned that temperature-dependent growth (Extended Data Fig.7a) could give different patterns of NTL8 accumulation in warm and cold. The total NTL8 amount increases in both conditions (Extended Data Fig.7b). However, the fast growth in the warm before or after cold (Fig.2a,b,f), could cause rapid NTL8 cellular dilution, leading to lower NTL8 concentrations. Slower growth during the cold could enable NTL8 accumulation, with higher NTL8 concentrations (Fig.2a,b).
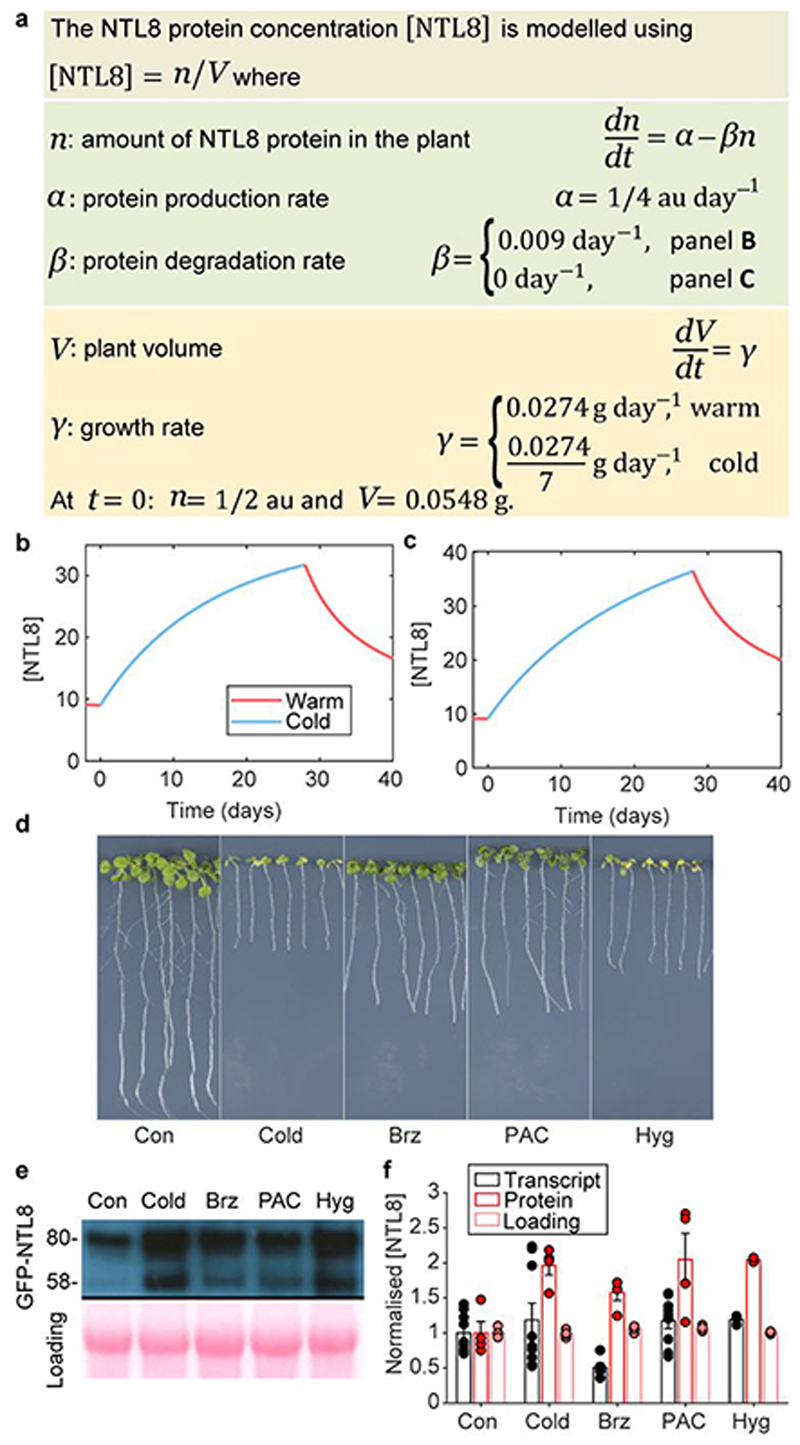
We developed a mathematical model for the NTL8 concentration in the growing plant (Fig.3a, Extended Data Fig.7c-g and Supplementary Methods). At constant temperature, total volume is assumed proportional to time25 (Extended Data Fig.7a). Based on our data, we assigned constant production and very slow degradation of NTL8 protein at all temperatures, or no degradation in the model, and found that this model of indirect temperature sensing through the growth rate could reproduce NTL8 dynamics in the warm and cold (Fig.2,3b,c). Many aspects of NTL8 biosynthesis are likely to be temperature regulated, but these would not explain the long-term accumulation. For example, changes to production (such as a global decrease in translation26) influence the final saturated NTL8 concentration, but not the slow accumulation (Fig.2c,Extended Data Fig.7c-f). Thus, a key factor for long-term, slow dynamics of NTL8 accumulation in the cold is reduced protein dilution.
Fig. 3. Slowing down growth leads to NTL8 accumulation.
a, Mathematical description of Ordinary Differential Equation model for NTL8 dynamics; a.u.: arbitrary units. b,c, Prediction of NTL8 protein concentration dynamics based on model of (a): little degradation (b), no degradation (c) of NTL8 protein. d, Seedling phenotypes after 8-day treatment. Con: control (20°C), Cold: 5°C, Brz: brassinazole (20°C), PAC: paclobutrazol (20°C), Hyg: hygromycin (20°C). Seedlings grown for 6 days in warm (20°C) before transfer to respective treatment. Images taken immediately before sampling. e, Western analysis of NTL8 protein concentration with treatments in (d) with equal weight of whole seedlings. Ponceau staining was run on separate gels and used as processing control. Experiment was repeated independently four times with similar results. For gel source data, see Supplementary Figure 1. f, Quantification of relative NTL8 transcript and protein level in (e). Error bars: s.e.m. of two (protein Hyg treatment), four (protein all other treatments), three (transcript Hyg treatment), six (transcript Brz treatment), nine (transcript all other treatments) replicates.
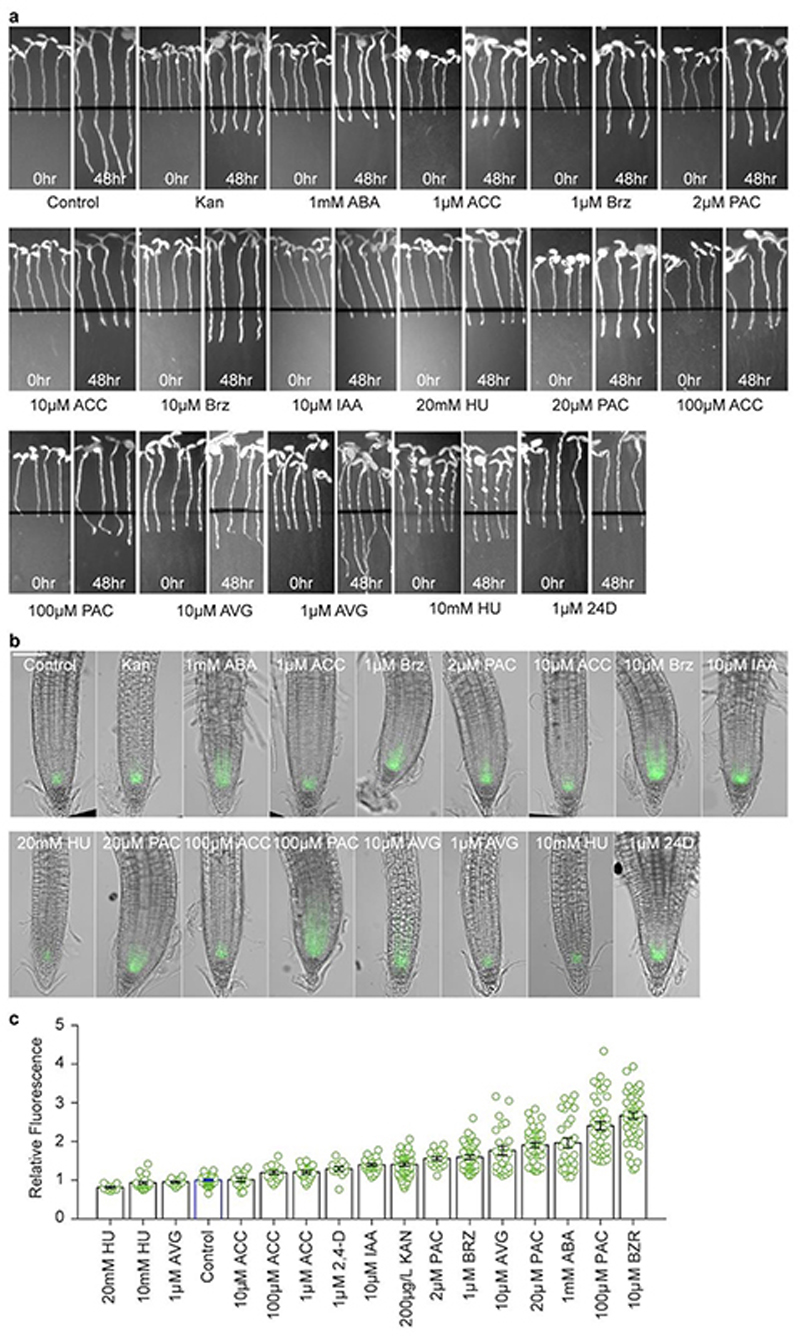
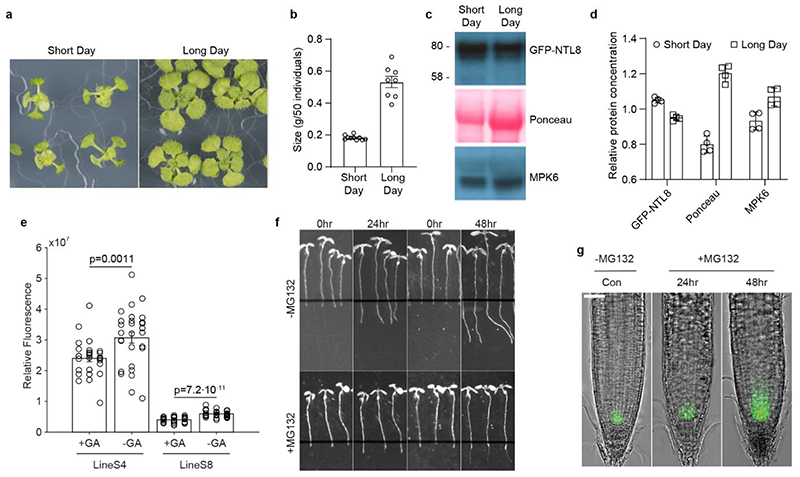
A prediction from this model is that inhibiting growth by non-cold treatments would generate similar NTL8 accumulation. Treatment of seedlings with brassinazole, paclobutrazol, hygromycin and short photoperiod in the warm validated this prediction (Fig.3d-f, Extended Data Fig.8,9a-d). In contrast, NTL8 levels were lower following gibberellin treatment in the cold which accelerates growth13 (Extended Data Fig.9e). NTL8 levels increased in treated plants in the warm, with unchanged, or even reduced relative RNA levels (Fig.3e,f). The root-tip GFP-NTL8 signal also increased in all warm treatments that inhibited growth, except for (almost lethal) hydroxyurea (Extended Data Fig.8). Furthermore, NTL8 accumulated slowly after proteasome inhibitor MG132 treatment, which also strongly inhibits growth (Extended Data Fig.9f,g). That varied treatments behaved similarly strongly supports slowed growth as the basis for NTL8 accumulation.
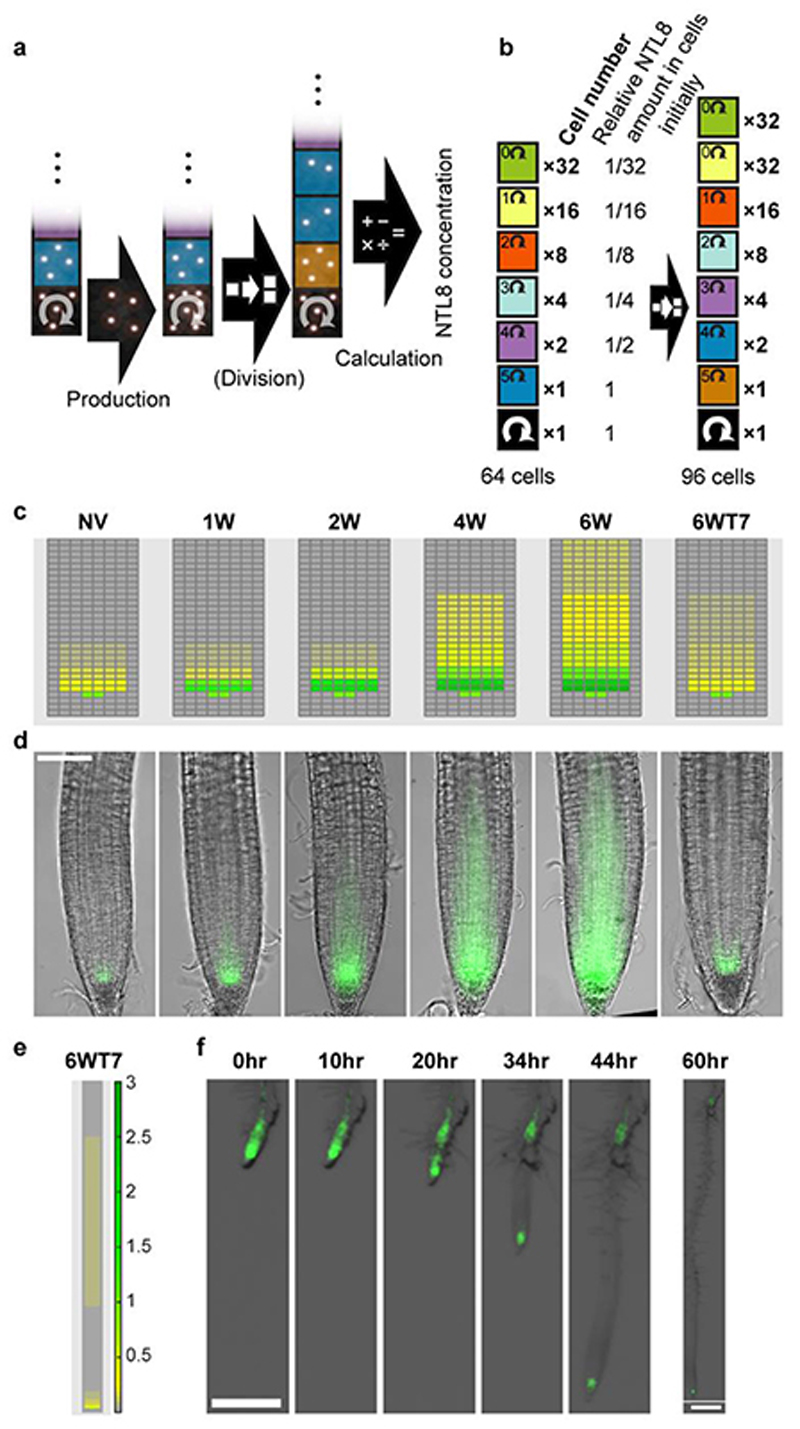
To further explore this concept, we developed a root computational model (Fig.4a,b, Extended Data Fig.10a). We postulated that NTL8 is transcribed in a restricted region, as found in recent single cell transcriptomic analyses27. For such a gene, growth and diffusion can broaden the region where the protein is detectable28. We applied the same logic, but assumed that diffusion was unlikely to contribute due to membrane localization of wild-type NTL8 (Extended Data Fig.4h,5b), and would not affect the overall NTL8 amount. We found that the predicted GFP-NTL8 accumulation through reduced growth in the cold matched that experimentally observed (Fig.4c,d, Extended Data Fig.10b and Methods). Furthermore, this root model captured the pattern in the warm, with little NTL8 everywhere except the meristems (Fig.4c,d).
Fig. 4. Mathematical model predicts observed NTL8 pattern in roots.
a, Simulation schematic: each day protein is produced followed, in warm, by division. In cold, division occurs every seventh day. Because division is less frequent, concentration increases in black cells in cold, spreading through division to other cells. Last step of simulation each day is calculation/output of NTL8 protein amount in each cell and overall root concentration, accounting for same protein amounts in black/blue cells (and also equivalent position in panel c: first two rows above QC, indicated by two cells in middle columns). Production occurs in initials only; division following production leads to NTL8 amount split equally between daughters. b, Diagram of model root cell file: each cell from stem cell division assumed to divide five times. Cell numbers of each type (“Cell number”) and relative NTL8 protein amounts (“Relative NTL8 amount in cells initially”) in each cell type shown at simulation start. Inside cells, we indicate number of divisions to undergo before exiting “division zone”, with exception of black cell (initial) which undergoes unlimited divisions. Two generations shown, indicating 32 cells added at every generation (following short initial 6-generation growth period not included in simulation). c, Model predictions for relative GFP-NTL8 concentrations (colorscale bar for concentration in e), for timepoints shown in (d). d, Images of GFP-NTL8 in roots at same timepoints. NV (20°C),1W,2W,4W,6W: 1,2,4,6 weeks of cold (5°C). 6WT7: 6 weeks cold plus 7 days warm (20°C). Scale=100μm. e, Model prediction of region with NTL8 accumulation during 6 weeks cold, remaining at high levels for 7 days post-cold (colorscale bar for concentration, right). f, Root imaged immediately after 6 weeks cold (5°C) (0hr) and for 10,20,34,44,60 hours after cold, in warm (20°C). Scale=500μm. Five independent repeats for panels d&f with similar results.
The root model predicted that regions where NTL8 accumulated during cold would maintain high levels after warm transfer (Fig.4e), due to limited growth in that region combined with long-term NTL8 stability. We verified this key prediction with a high-resolution root time series (Fig.4f, Supplementary Video 1, Extended Data Fig.10c(i,ii)). Higher growth in the warm led to newly-formed tissue having low GFP-NTL8 levels, with high GFP-NTL8 accumulation only at the root tip together with those cells that had arisen during the cold and were no longer growing. Elevated GFP-NTL8 levels in this patch of cells were maintained for 24 days of further growth in the cold (Extended Data Fig.10c(iii,iv), underlining that NTL8 protein is stable over weeks.
A combination of experiments and modelling has enabled us to show that reduced protein dilution due to less growth at low temperatures creates a long-term temperature sensing system. Temperature-dependent growth itself can thus be passively utilized as a long-term thermosensor, naturally averaging temperature fluctuations over long periods. Temperature sensing is distributed broadly through regulatory networks exploiting the temperature dependency of biochemical reactions11. The reduced dilution mechanism is therefore part of this network driving the slow accumulation of NTL8, and thus VIN3 in the long-term process of vernalization. Such an effect can emerge for any long-lived protein with constant production. It will be important to explore whether other biological processes related to long-term environmental signals utilize similar mechanisms.
Methods
Statistics
No statistical methods were used to predetermine sample size. The experiments were not randomized and investigators were not blinded to allocation during experiments and outcome assessment. Sampling in all cases is performed by collecting material from new plants (not repeated sampling), for replicates and also between timepoints, with the exception of the time lapse imaging in Supplementary Video 1.
Plant material and growth conditions
Generally, plant growth conditions were described previously29. For expression analysis and protein extraction, plants were grown on Murashige and Skoog (MS) agar plates without glucose. For microscopy, plants were grown almost vertically on MS plates containing 1% agar. Experiments under the fluctuating temperatures were done as described in10.
NTL8 overexpression lines (ntl8-OE1 (Salk_866741) and ntl8-OE2 (Salk_587226)) and the NTL8 knockout line ntll8-1 (SM_3_16309) were obtained from the Nottingham Arabidopsis Stock Centre (NASC). The NTL14 knockout line ntl14-1 (GT19225) was obtained from Cold Spring Harbor Laboratory, Cold Spring Harbor, NY (http://genetrap.cshl.org). The 35S::HA-NTL8 transgenic line was generated by14. The VIN3-luciferase translational fusions were generated by replacing the stop codon of a VIN3 genomic fragment (from 6316bp upstream of the ATG to 3095bp downstream of the stop codon) with a linker and the luciferase coding sequence. The resultant VIN3-luciferase reporter was cloned into pSLJ-7551630 and transformed into the vin3-6 (vrn7-3), a Landsberg erecta (Ler) mutant29. Transgene copy number was assayed by idnaGENETICS (Norwich Research Park). A transgenic line containing a single-copy transgene and showing a similar expression pattern to the endogenous VIN3 was selected as the progenitor line for the forward genetic screening. Relevant primers are listed in Supplementary Table 1.
Flowering time analysis
Flowering time analysis was performed as previously described31. Briefly, plants were grown in containment conditions (16 hr light / 8 hr dark; Day temperature: 23–25 °C, and night temperature: 20–22 °C). The total rossete leaf number produced by the main apical meristem before flowering initiation was counted as a measure of flowering time.
Mutagenesis, genetic screening and map-based cloning
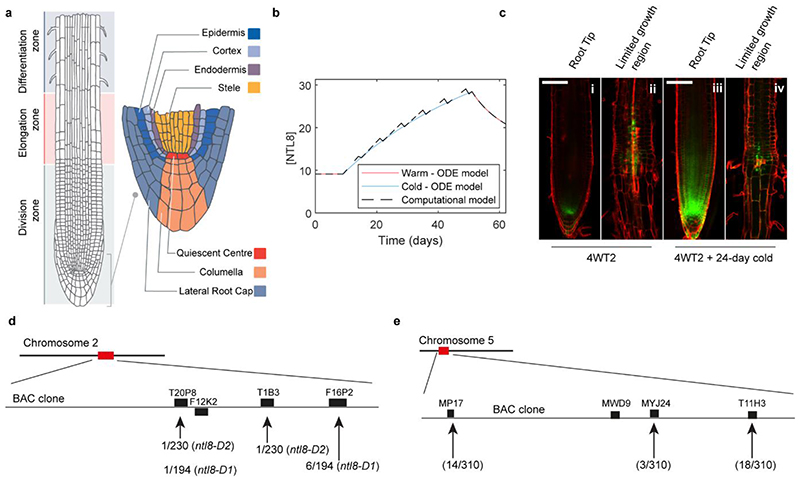
Mutagenesis was conducted as previously described in31. Pooled M2 (mutagenesis generation 2) seeds (from 25 M1 plants) were screened. Approximately 400 seeds from each M2 pool were sown on MS medium and stratified for 3 days in the cold (5°C). After growth in a growth cabinet for 10 days, the M2 seedlings were sprayed with 1μM luciferin (Promega, E1603) and assayed for the bioluminescence with a CCD camera (NightOwl). Two mutants were identified (Fig.1a) and crossed to Col-0 to generate a mapping population. By traditional map-based cloning, both were fine-mapped to a narrow region on chromosome 2 (Extended Data Fig.10d) and found to carry a mutation in AT2G27300 and so were named ntl8-D1 and ntl8-D2. Since ntl8-D1 was dominant, the wild type allele was mapped. SSLP markers for map-based cloning were either from https://www.arabidopsis.org or http://amp.genomics.org.cn/ 32. A ntl14-D mutation was also identified (Extended Data Fig.3a) and map-based cloning was done in a similar way as for the ntl8-D mutations (Extended Data Fig.10e). The key primers for fine mapping are listed in Supplementary Table 1.
NTL8 constructs and transformation
The NTL8prom::GFP-NTL8, NTL8prom::GFP-NTL8-D1 and NTL8prom::GFP-NTL8-D2 translational fusions contain a Ler NTL8 genomic fragment (from 2278bp upstream of the ATG to 703bp downstream of the stop codon), amplified separately from the progenitor line and the ntl8-D1 and ntl8-D2 mutants. The GFP and linker coding sequences were inserted ahead of the ATG of NTL8 by In-Fusion cloning (Takara, 638909). The resulting NTL8prom::GFP-NTL8, NTL8prom::GFP-NTL8-D1 and NTL8prom::GFP-NTL8-D2 were cloned into the binary vector pSLJ-7551630, and transformed into Agrobacterium C58. All of the 10 randomly selected NTL8prom::GFP-NTL8 transgenic lines show NTL8 accumulation under cold conditions, and the slow accumulation behaviour is independent of the transgene expression level (Extended Data Fig.4e-h). The high expression line S4, which carries a single copy NTL8prom::GFP-NTL8 transgene, was used in the paper to facilitate conducting the experiments. Relevant primers are listed in Supplementary Table 1.
Transient assays in Nicotiana benthamiana were conducted as previously described29. Imaging was done 2 days after infiltration with Agrobacterium. For short-term cold treatment, the Nicotiana benthamiana plants were kept in at 5°C for 2 days after infiltration with Agrobacterium. Stable transgenic lines were also generated in Col-0 and plants with a single copy transgene selected. Homozygous lines at the T4 generation were used for further experiments.
RNA analysis
Samples were collected at 3pm. Total RNA was prepared as previously described33. Genomic DNA was removed with TURBO DNA-free (Ambion Turbo DNase kit, AM1907) following the manufacturer’s guidelines, before reverse transcription was performed. The reverse transcription was performed with the SuperScript III First-strand Synthesis System (Invitrogen, 18080-051) according to the manufacturer’s protocol using either gene-specific primers or Oligo(dT) 12-18 (Invitrogen, 18418-012). Relevant primers are listed in Supplementary Table 1.
Cycloheximide (CHX) treatment
For the western blot assay of Fig.2d,e, 4-week vernalized 35S::HA-NTL8 seedlings were soaked in liquid MS medium supplemented with 100μM cycloheximide (Sigma-Aldrich, C1988) in warm conditions (normal growth cabinet at 20°C) and cold conditions (vernalization cabinet at 5°C). The seedlings were sampled at the timepoints of 0hr, 4hr, 8hr, 16hr, 24hr and 48hr. NTL8 proteins were detected as described in the section ‘Protein extraction and western blot assay’.
For the western blot assay of Extended Data Fig.6f,g, 10-day old NTL8prom::GFP-NTL8 seedlings were soaked in liquid MS medium supplemented with 100μM cycloheximide (Sigma-Aldrich, C1988) in warm conditions (normal growth cabinet at 20°C) and cold conditions (vernalization cabinet at 5°C). Then approximately 1.0g seedlings were sampled at the timepoints of 24hr and 48hr. NTL8 proteins were detected following the procedures in the section ‘Protein extraction and western blot assay’.
For fluorescence imaging, NTL8prom::GFP-NTL8 seeds were sown on MS medium and grown for 8 days before they were transferred to new MS medium supplemented with 100μM cycloheximide (CHX). After 48hr treatment with CHX, seedlings were imaged with the standard fluorescence microscope Leica DM6000 and confocal microscope Leica SP5.
MG132 treatment
NTL8prom::GFP-NTL8 seeds were sown on MS medium and grown for 8 days in the warm (20°C) before they were transferred to new MS medium supplemented with 100μM MG132 (Sigma-Aldrich, 474787). After 24hr or 48hr treatment with MG132 in the warm (20°C), roots of seedlings were imaged with the standard fluorescence microscope Leica DM6000. To assess root growth, images were taken with (Alphaimager). Images prior to treatment were taken immediately after the transfer and images after treatment were taken just before the fluorescence imaging.
Microscopy
Confocal imaging was performed using a 20X/0.7 NA multi-immersion lens, with water as the immersion fluid on a Leica TCS SP5 confocal microscope. For stable transgenic plants, roots were immersed in 2μg/mL propidium iodide (Sigma-Aldrich, P4864) to label the cell wall. To allow comparison between treatments, the same settings were used for all GFP-NTL8 images, with the exception of Extended Data Fig.4h which was imaged with a higher gain value and laser power.
For detecting the fluorescence of GFP-NTL8 in the leaves, confocal imaging was performed using a 63X/1.2 water immersion lens on a Leica TCS SP8X confocal microscope. The GFP was excited using 514nm laser line from a white light laser set to 80MHz pulse frequency (repeats every 12.5ns) and fluorescence emission was captured between 525-550nm using hybrid detector. Time gating was used to remove chloroplast autofluorescence in the green/yellow spectrum34, after an excitation laser pulse the fluorescence emission of GFP-NTL8 was only detected between 0.47-10.80ns. The chloroplast autofluorescence was used as a marker of the cell, as the propidium iodide does not work in the leaf. A z-stack was done to be sure that GFP-NTL8 shows no signal in the leaf under warm conditions. To allow comparison between treatments, the same settings were used for all GFP-NTL8 images.
To compare the fluorescence intensity between roots, imaging was performed using a 20X lens on a Zeiss Axio Imager fluorescence microscope, which allowed us to collect the total intensity of each root tip. Images taken with the fluorescence microscope Leica DM6000 are specified in the figure legend. To allow comparison between treatments, the same settings were used for all images. Of note, in the comparison of GFP-NTL8 and VIN3-GFP in Extended Data Fig.5e, VIN3-GFP was imaged with a longer exposure time and higher light intensity.
For imaging the GFP-NTL8 dynamics post-cold (Fig.4F and Supplementary Video 1), Leica205FA stereo-microscopy was used. Images were taken sequentially around every 10 hours to monitor root growth. To allow the root to grow normally, plants were kept in the growth cabinet in between imaging. To allow comparison between treatments, the same settings were used for all images.
The image processing was conducted with ImageJ: the intensity was linearly adjusted separately for each channel. For visual comparison of the fluorescence intensity between different treatments in the GFP-NTL8 images, the same adjustment was used in ImageJ.
Protein extraction and western blot assay
For NTL8prom::GFP-NTL8 detection, approximately 1.0g seedlings were ground to a fine powder in liquid nitrogen. Total protein was extracted by suspending the powder with 2mL IP buffer (50mM Tris-Cl pH8.0, 154mM NaCl, 10% glycerol, 5mM MgCl2, 1% Triton, 0.3% NP-40, 5mM DTT, protease inhibitor (Roche, 04693159001)). After clearing by centrifugation at 16000 g at 4°C for 20min, 100μL total protein was taken as input before enrichment with Magnetic GFP-trap beads (ChromoTek GMBH, GTMA-20). The input samples were stained with Ponceau buffer and used as a loading control for the initial level for each sample, while enriched GFP-NTL8 protein amounts were detected by western blot. GFP-tagged protein was detected with anti-GFP antibody (Roche, 11814460001). Signals were visualized by chemiluminescence (SuperSignal West Femto; Pierce, 34095) using secondary antibodies coupled to horseradish peroxidase (anti-mouse IgG, GE healthcare, NXA931V). The chemiluminescence signal was captured by exposure to the FUJI Medical X-ray film (FUJI, 4741019289). X-ray films for quantification were all scanned with printer scanner (RICOH). Images of X-ray films shown in Fig.2 were taken with a high-resolution camera (Canon). Multiple exposures with different times were performed to avoid signal saturation, and a mildly-exposed image was always selected for signal quantification with ImageJ. A constant sized rectangle was drawn in ImageJ to enclose the band and the intensity inside it was measured. For each blot, the measured values were normalised to the average intensity of all the measurements, to remove systematic variability. Ponceau stainings using Ponceau buffer (Sigma-Aldrich, P7170) for all GFP-NTL8 were from separate gels and used as same processing controls. (Sigma-Aldrich, P7170). For 35S::HA-NTL8 detection, total protein was extracted from 200mg seedlings with 200μL IP buffer (same procedure as above), 20μL aliquot of each sample was taken for western blot detection with anti-HA-peroxidase (Roche, 12013819001) or anti-HA-TAG (Cell signalling technology, 3724s). The signal visualization was as above except with secondary antibodies coupled to horseradish peroxidase (anti-rabbit IgG, GE healthcare, NA934V) for anti-HA-TAG (Cell signalling technology, 3724s). Ponceau stainings for all HA-NTL8 from the same gel were reversibly stained with Ponceau buffer (Sigma-Aldrich, P7170). All of the western blot assays were carried out with equal weight of whole seedlings, except Extended Data Fig.7b (details in the section ‘Assay of the absolute amount of NTL8’).
Chromatin Immunoprecipitation (ChIP)
NTL8 protein ChIP experiments were conducted following the ChIP protocol described in35. For GFP-tagged NTL8, the immunoprecipitation used GFP-trap beads (Chromotek GTMA-20). For HA-tagged NTL8, the immunoprecipitation used anti-HA Magnetic beads (Pierce, 88836). DNA was purified and analysed as previously described35. Relevant primers are listed in Supplementary Table 1.
3’RACE for detecting alternative splicing
3’RACE was performed with the FirstChoice® RLM-RACE Kit (Thermal Fisher Scientific, AM1700) according to the procedures for 3’RACE. Briefly, total RNA extracted from wild type seedlings, grown for 8 days in standard growth conditions, was used to perform the reverse transcription with the 3’RACE adaptor provided in the kit. Two rounds of PCR were performed with nested Primer to provide more materials and better specificity. The second PCR product was then cloned into the PGEM-T vector system1 (A3600, Promega UK Ltd). Multiple single clones were sequenced. Relevant primers are listed in Supplementary Table 1. Sequence information of NTL8 isoform 2 and isoform 3 is listed in Supplementary Table 2.
Growth rate assay by measuring fresh weight
For measuring growth rate in the warm (20°C), bulk fresh weight of 50 seedlings was measured at a series of timepoints (8, 12, 16 and 20 days after moving into the growth cabinet (20°C)). For measuring growth rate in the cold, seedlings were firstly grown in the normal growth cabinet for either 7 days or 12 days before moving into the vernalization cabinet (5°C). Then bulk fresh weight of 50 seedlings was measured at a series of timepoints in the cold (5°C) (shown in Extended Data Fig.7a). Residual water on the seedling surface was carefully removed for accuracy. In addition, a fixed number of seeds (150 seeds per petri dish (140mm Triple vent petri dish, Sterili)) were evenly dispersed on the medium with enough space for growth, in order to avoid variability caused by density.
Growth inhibition by different treatments
To inhibit the growth rate in the warm (20°C), we used phytohormones and inhibitors including 200μg/L kanamycin (Sigma-Aldrich, 60615), Aminoethoxyvinylglycine (AVG, 1μM or 10μM) (Sigma-Aldrich, A6685), 1μM 2,4-Dichlorophenoxyacetic acid (2,4-D) (Sigma-Aldrich, D7299), 1mM Abscisic acid (ABA) (Sigma-Aldrich, A1049), 10μM Indole-3-acetic acid (IAA) (Sigma-Aldrich, I2886), brassinazole (Brz, 1μM or 10μM) (Sigma-Aldrich, SML1406), 20μg/L hygromycin (Sigma-Aldrich, H9773), 1-Aminocyclopropane-1-carboxylic Acid (ACC, 1μM, 10μM, or 100μM) (Sigma-Aldrich, 149101-M), Hydroxyurea (HU, 10mM or 20mM) (Sigma-Aldrich, H8627) and paclobutrazol (PAC, 2μM, 20μM, or 100μM) (Sigma-Aldrich, 43900). For imaging GFP-NTL8 in the root tips, approximately 25 seedlings, grown vertically for 6-days in the warm (20°C), were transferred to new medium supplemented with the above drugs in the warm (20°C). To assess root growth, images were taken twice with (Alphaimager), the first one immediately after the transfer and the second one 2 days later, just before the fluorescence imaging. Fluorescence imaging was performed with the Zeiss Axio Imager as described above. To detect the protein level with western blot, seeds were sown on filter paper to reduce damage during transfer for the treatment. Around 1.5g of 6-day old seedlings were transferred to new medium supplemented with the above chemicals. The seedlings were then grown for another 8 days in warm conditions before sampling. The western blot assay was performed following the procedures in the section ‘Protein extraction and western blot assay’.
Short Day and Long Day treatments were applied to avoid the widespread side-effects of chemical treatments. Seeds were evenly dispersed on the medium sufficiently distant from one another. After a 3-day stratification in the cold (5°C), 6-day old seedlings were transferred to a growth cabinet (Panasonic MLR-352 series), set to either Short Day (8hr day/16hr night, light setting 3) or Long Day (16hr day/8hr night, light setting 5) conditions for two weeks in the warm (20°C). Images to assess phenotype were taken immediately before growth measurements. Growth under Short Day and Long Day conditions was measured by bulk weight of 50 fresh seedlings. The western blot assay was performed following the procedures in the section ‘Protein extraction and western blot assay’. As different light conditions have a strong effect on Rubisco abundance, as shown by Ponceau staining, MPK6 (Sigma-Aldrich, A7104) was used as the loading control.
Growth acceleration in the cold (5°C) with gibberellin (GA) treatment
To accelerate the growth rate in the cold (5°C), we used gibberellin (GA, G7645). For imaging GFP-NTL8 in the root tips, approximately 25 seedlings, grown vertically for 6 days in the warm (20°C), were transferred to new medium supplemented with the above drugs and placed in the cold (5°C) for 4 weeks. Fluorescence imaging was performed with the Zeiss Axio Imager and quantified as described above.
Assay of the absolute amount of NTL8
To test the absolute amount of NTL8 in plants between warm and cold temperatures, bulk NTL8 protein was measured by western blot from the same number of seedlings with no treatment (8-day seedlings grown in the warm (20°C)), or 8-day cold treatment (5°C, following the no treatment pregrowth), or 8-day warm treatment (20°C, following the no treatment pregrowth). The western blot assay was performed following the procedures in the section ‘Protein extraction and western blot assay’.
Automatic Fluorescence Intensity Quantification
Fluorescence microscopy images (such as in (Fig.1e)) were analyzed to quantify the fluorescence in the root tip region. A threshold (2600) was applied to the intensity of the fluorescence of GFP-NTL8 and a mask was created based on this threshold. The second largest connected area was selected (the largest being the no-signal area), and the sum intensity of its fluorescence was quantified. The selection was manually inspected, and a small number of roots were excluded (23 images from a total of 629). This simple algorithm was implemented in Python (http://www.python.org) using the czifile (https://www.lfd.uci.edu/~gohlke/) and scipy.ndimage (https://www.scipy.org) libraries. Code is available in Supplementary File Code and at https://github.com/ReaAntKour/NTL8TemperatureGrowth/
NTL8 Ordinary Differential Equation model
Effective degradation (or protein removal) has been reported as the sum of decay and dilution36. This statement is usually applied to proteins in cell populations where all cells divide, giving an exponentially increasing number of cells with time, and where production continues in all daughter cells. However, in multicellular organisms not all cells continue to divide. In particular for plants, we have an approximately linear growth in time (Extended Data Fig.7a). Furthermore, the overall rate of protein production over the whole plant can be constant. Here, we modelled the total NTL8 protein amount, the total volume of the cell population approximated by the fresh weight of the plants, and the overall protein concentration, using the equations described in the Supplementary Methods.
Computational root simulation
We then developed a model for the root to try to capture the spatial pattern observed in our imaging. We made simple assumptions for root structure and growth37–38. We assumed that all cells in the division zone divide once per day, consistent with recent measurements of the times between two divisions39. According to our growth measurements in warm and cold (Extended Data Fig.7a), we assumed that the division rate slows down to once per week in the cold. In both cases we simulated divisions occurring simultaneously for simplicity. All cells are assumed to have the same size and the elongation zone was not simulated. These assumptions significantly simplify our model and, as we are primarily interested in the division zone and our observation timescale is much longer than the cell cycle duration, our conclusions should be largely unaffected by these simplifications.
Four cell files are simulated, one each from the stele, endodermis, cortex and epidermis layers (Extended Data Fig.10a), represented by a rectangular array of cells, with a variable number of rows. As the root is an axisymmetric structure, we simulate only half a cross-section of the root but additionally show a mirror image in the figures. The lateral root cap and columella cells are ignored by the model but are also shown in (Fig.4c), together with two quiescent centre cells (the latter with constant protein amount of 1), as visual reference points. We assume that there is no degradation of the protein, in either the cold or warm.
Each cell has an associated NTL8 amount. The step size of the simulation is a day and, every day, a constant amount of NTL8 is made (⅓ per day) in each initial cell only (Fig.4a), excluding the epidermis initial. The total production rate in the simulated half root is therefore 1 per day, and the average production per cell file is ¼ per day matching the production rate in the ODE model.
Following production, every day in the warm or every 7th day in the cold, synchronous cell division occurs in the division zone (Fig.4a, b, Extended Data Fig.10a). We assumed that the division zone is made up of 32 cells in each cell file, including the initial cells. This is an approximation since the cell numbers vary, but it is the equivalent of assuming that a cell that comes from the division of an initial cell divides a further 5 times (Fig.4b). At each division, for the bottom 32 rows of cells, each row is turned into 2 adjacent rows (therefore the growth rate in the warm is Vd = 32 per day, and the amount present in the parent cell is split equally between the daughter cells. It is straightforward to calculate the relative amount of protein in a simulated cell a given distance from the root tip under constant conditions (Fig.4b). For all rows of cells above 32, there is no change to the cell or to the simulated amount of protein contained within.
Each day, after production and (in case it occurs) division, we calculate the amount of NTL8 in each cell and the overall concentration in the root. The latter is defined as the total amount of protein, divided by the number of cells in the simulated half root (including the epidermis).
Initially, the root has 64 rows of cells. Also, at t = 0, the amount of NTL8 in the initial cells and those immediately above (excluding the epidermis cell file which has no NTL8) is chosen to be equal to 2/21. The two rows of cells above those, each have half that amount initially (1/21), and the four above those each have a quarter (1/42) and so forth. Therefore, at t = 0, the relative amounts in the 64 cells of a cell file are the same as in (Fig.4b), the total amount in each cell file (excluding the epidermis which has no NTL8) is equal to ⅔ (two times its production rate) and the overall concentration in the root is (1/128).
For the comparison with the ODE model (Extended Data Fig.10b), the concentration from the computational simulation model was multiplied by Vd /Vg = 32/0.0274 and then directly compared to the output of the ODE model that was run with the same pregrowth and vernalization parameters as the other. Therefore, the root average concentration in the computational simulation matches the ODE model results, apart from changes due to the discontinuity of cell divisions in the simulation (Extended Data Fig.10b).
Code is available in Supplementary File Code and at https://github.com/ReaAntKour/NTL8TemperatureGrowth/
Extended Data
Extended Data Fig. 1. Characterization of VIN3-luciferase reporter.
a, Schematic for VIN3-luciferase reporter. Luciferase was fused next to the C-terminus of VIN3. b, Luminescence imaging of the transgenic line carrying the VIN3-luciferase reporter. NV (non-vernalization) indicates no cold treatment (20°C), 4W indicates four weeks cold treatment at 5°C, and 4WT1 indicates four weeks cold plus one day warm treatment at 20°C. Four independent repeats with similar results. c, Analysis of endogenous VIN3 and transgenic VIN3-luciferase transcripts in the reporter line under different lengths of cold treatment (5°C). Control indicates the non-transgene vin3-6 control. 4D indicates four days cold treatment, nW indicates n weeks cold treatment, where n is 1, 2, 3, 4, 6 or 8. Two biological replicates (dots) and their means (lines) are shown. d&e, Flowering phenotype of the reporter line after four weeks vernalization (5°C). JU223, a FRI transgene, was introduced into the reporter line by crossing. Error bars s.e.m. of 12 individuals. ANOVA with Tukey HSD post hoc test for multiple comparisons was performed and p-values for individual comparisons of interest are shown.
Extended Data Fig. 2. Characterization of ntl8-D1, ntl8-D2 and NTL8 overexpression lines.
a, Schematic of the predicted proteins with the identified mutations in ntl8-D1 and ntl8-D2 mutants. Light blue box indicates NAC (NAM/ATAF/CUC) domain, red box indicates transmembrane domain (TM). R indicates Arginine, W indicates tryptophan, * indicates stop codon. b, Developmental phenotypes of ntl8-D1 (indicated by red arrow) and ntl8-D2 mutants. Three independent repeats with similar results. c, NTL8 transcript quantification in wildtype (WT) and ntl8-D1 and ntl8-D2 mutants in the warm (20°C). Errors are s.e.m of three biological replicates. d, No morphological phenotype is observed in ntl8-OE2 mutant. Five independent repeats with similar results. e, Schematic of T-DNA mutant SM_3_16309(ntl8-1) Salk_866741(ntl8-OE1\ Salk_587226 (ntl8-OE2) and GT19225 (ntl14-1). f, Analysis of NTL8 transcript by quantitative PCR in ntl8-OE1 and ntl8-OE2 in the warm (20°C). g, Analysis of VIN3 transcript by quantitative PCR in ntl8-OE1 and ntl8-OE2 in the warm (20°C). For (f,g), errors are s.e.m of four biological replicates. h, Analysis of NTL8 transcript in 35S::HA-NTL8 transgenic line. i, Analysis of VIN3 transcript in 35S::HA-NTL8 transgenic line in the warm (20°C). For (h,i), errors are s.e.m of three biological replicates. j, Analysis of NTL8 binding at NTL8 locus by ChIP. Col-0 was used as a background control. Error bars are s.e.m of three replicates. Primer positions are shown in the NTL8 schematic below (-30: 30bp upstream, +1000: 1000bp downstream of transcription start site). k, Analysis of NTL8 binding at VIN3 locus by ChIP. Primer positions are shown in the VIN3 schematic below (-900: 900bp upstream, 30: 30bp downstream of transcription start site, as in Fig.1d). Two biological replicates are shown.
Extended Data Fig. 3. Role of NTL8 in vernalization and redundancy.
a, Forward genetics identified ntl14-D. Shown below is a schematic of NTL14. Light blue box indicates NAC (NAM/ATAF/CUC) domain, red box indicates transmembrane domain (TM). Q indicates Glutamine, * indicates stop codon. Seven independent repeats with similar results. b, Analysis of VIN3 transcript level by quantitative PCR in ntl8-1 mutant and Col-0 control, at NV (20°C) and 4 weeks cold treatment (4W) at 5°C. Error bars show s.e.m of three biological replicates. c, As for (b) in ntl14-1 and Ler control. Error bars show s.e.m of four biological replicates. d, VIN3 transcript in ntl8-1ntl14-1 and wild-type (WT) control, at NV (20°C) and 3 weeks cold treatment (5°C). WT is the wild type plants in the F2 population of the cross between ntl8-1 and ntl14-1. For comparison between WT and ntl8-1ntl14-1 double mutant, we performed a two-tailed t-test: t-value=4.634, df=10, p-value = 0.0009. Error bars show s.e.m of six biological replicates. e&f, Analysis of FLC transcripts in Ler JU223, vin3-6 JU223, ntl8-D2 JU223, and vin3-6 ntl8-D2 JU223 mutants under NV (e), 4WT0 (f) and 4WT14 (f) conditions. NV (non-vernalization) indicates the warm (20°C) prior to cold treatment, 4W indicates four weeks cold treatment at 5°C, and 4WT14 indicates four weeks cold plus 14 days warm treatment at 20°C. In f, data is normalised to the corresponding NV treatment. Errors are s.e.m of three biological replicates. g, Unspliced FLC levels after 4 weeks vernalization in Col FRI and ntl8-1 FRI, normalised to the non-vernalized levels in the same genotype. Errors are s.e.m of three biological replicates. Unpaired t-test, Two-tailed, t=5.303, df=4, p-value=0.0061. h, Flowering time, counted by number of rosette leaves at flowering, for plants vernalized for 4 weeks. Errors are s.e.m of 12 individuals. Unpaired t-test, Two-tailed, t=4.241, df=22, p-value=0.00031. i, Potential cross-regulation targets of NTL14 based on microarray data in 17. j, Potential cross-regulation targets of NTL8 based on in vitro data 20. RNA was isolated from whole seedlings, and values are all normalized to UBC.
Extended Data Fig. 4. Analysis of VIN3 and short-term cold stress inducible genes in ntl8-D mutants, and characterization of independent NTL8prom::GFP-NTL8 transgenic lines.
a, Analysis of VIN3 transcript level under different lengths of cold treatment by quantitative PCR. 4WTn indicates 4 weeks cold at 5°C plus n days warm at 20°C, where n is 1, 3 or 7. NV: Non-Vernalized (20°C). Data was normalized to UBC. Errors are s.e.m of four biological replicates. b-d, RD29A (b), COR47 (c) and COR15 (d) transcript quantification in wildtype (WT) and ntl8-D mutants. NV indicates no cold treatment (20°C); 2D indicates 2-day cold treatment at 5°C. Errors are s.e.m of three biological replicates. e, All 10 randomly selected NTL8prom::GFP-NTL8 transgenic lines show NTL8 accumulation in the cold. NV: Non-Vernalized, and 7W refer to 7 weeks of cold respectively at 5°C. Scale = 100μm. Schematics of the GFP-NTL8 shown above. A GFP-linker was fused at the N-terminus of NTL8. Three roots were assayed with similar results for each line in both NV and 7W. f, Two representative lines showing the slow accumulation behaviour of NTL8 in the cold. NV: Non-Vernalized, 1W, 2W and 4W refer to 1, 2 and 4 weeks of cold respectively at 5°C. Scale = 100μm. Two independent repeats with similar results. g, The transcript level of the NTL8prom::GFP-NTL8 transgene in the two representative lineS4 and lineS8. Values are normalized to UBC. Errors are s.e.m of three biological replicates. RNA was isolated from whole seedlings. h, Detection of low GFP-NTL8 levels in non-vernalized plants after long exposure. Propidium Iodide staining was used to mark the root structure. Scale = 50μm. Five roots were assayed with similar results.
Extended Data Fig. 5. Subcellular and tissue localization of NTL8 protein.
a, Schematics of the GFP-NTL8, GFP-NTL8-D1, and GFP-NTL8-D2 constructs. A GFP-linker was fused at the N-terminus of NTL8, NTL8-D1, NTL8-D2. b, Localization of GFP-NTL8 and GFP-NTL8-D2 in the root in stable transgenic plants (top) and only the propidium iodide staining channel for the same roots (bottom), indicating they are the same optical section. 8-day old roots were imaged with Leica SP5 confocal microscopy. NV indicates no vernalization treatment (20°C), and 4W indicates 4 weeks treatment in the vernalization room at 5°C. Propidium Iodide staining was used to mark the root structure. Scale = 50μm. Four independent repeats with similar results. c-d, NTL8 accumulation after exposure to fluctuating temperatures. c, Imaging of the GFP-NTL8 fluorescence signal in the root tip with a Leica DM6000 microscope, under exposure to different lengths of fluctuating temperatures (Fluct, with an average temperature of 14°C) and constant 14°C (Con). NV indicates non-vernalization, 2W indicates 2 weeks, 4W indicates 4 weeks. Scale = 50μm. Independent roots (6 for NV, 12 for Con-2W, 13 for Fluct-2W, 4 for Con-4W, and 5 for Fluct-4W) were assayed with similar results. d, Analysis of GFP-NTL8 protein using western blot after the same conditions as in c. One replicate. Ponceau staining of the input on a separate gel was used for the loading control. Quantification of band intensity is shown on each gel. For gel source data, see supplementary figure 1. e, Domains of NTL8 (i&ii) and VIN3 (iii&iv) in the root tip after 7 weeks cold. i&iii indicate merged image of bright and fluorescence channels, while ii&iv indicate fluorescence channel only. Scale = 100 μm. Independent roots (5 for GFP-NTL8 and 13 for VIN3-GFP) were assayed with similar results. f, Detection of GFP-NTL8 fluorescence signal in the shoot in warm (20°C) or after 6 weeks cold (5°C). Green indicates the signal of GFP-NTL8, red indicates the signal from chlorophyll autofluorescence, and grey indicates the bright field. g, g(i) and g(ii) are the side view of the 3D projection of f(i) and f(ii) respectively. Scale = 50μm. Three independent repeats with similar results. h, Subcellular localization of GFP-NTL8, GFP-NTL8-D1, and GFP-NTL8-D2 with transient assay in Nicotiana benthamiana. GFP-NTL8 (i), GFP-NTL8-D1 (iii) and GFP-NTL8-D2 (iv) were kept in warm (20°C) conditions for 2 days before imaging; GFP-NTL8 (ii) was kept in the cold (5°C) for 2 days prior to imaging. Arrows point to nuclei. Scale = 25μm. Two independent repeats with similar results.
Extended Data Fig. 6. Analysis of NTL8 isoforms in wild-type plants, and assay of NTL8 protein turnover rate under cycloheximide (CHX) treatment.
a, Schematic of NTL8 RNA isoforms identified by 3’RACE and sequence of isoforms 2 and 3. b, Quantification of protein levels from western blots of Fig. 2a and additional replicates of experiment, showing each band separately. c, Quantification of the transcript levels of all three isoforms by qPCR. NV indicates non-vernalized (20°C), and 4W indicates 4 weeks treatment in the vernalization room at 5°C. Errors are s.e.m of eight (for isoform1) or four (for isoform2 and isoform3) biological replicates. d, Comparison of the proteins produced by wild-type NTL8prom::GFP-NTL8 and mutant NTL8prom::GFP-NTL8-D2. The first band produced in the GFP-NTL8 line is absent in the GFP-NTL8-D2 line. Based on the sequence of GFP-NTL8-D2, the full-length form with the TM domain cannot be made. This suggests that the absent band corresponds to full length GFP-NTL8. The second band produced in the GFP-NTL8 line matches the size on the gel of the GFP-NTL8-D2 form. Ponceau staining of the input on a separate gel was used for the loading control. For gel source data, see supplementary figure 1. Two independent repeats with similar results e, Diagram of the predicted proteins produced by alternative splicing. The NTL8 isoform 2 (286 aa) has a similar amino-acid (aa) number as the NTL8-D2 (293 aa) form. Given that the second band for GFP-NTL8 in (d) matches the size on the gel of the NTL8-D2 form, the second band could be, at least in part, produced by NTL8 isoform 2. Furthermore, the alternative splicing site for isoform 3 is present in the ntl8-D2 allele, so NTL8 isoform 3 could still be produced by the ntl8-D2 allele, and the resulting protein likely produces the band in the GFP-NTL8-D2 sample that matches the third band in the wild-type. Based on the protein marker, all of the bands gave systematically larger molecular weights than those predicted by the amino acid sequence, possibly due to large post-translational modifications, potential measurement inaccuracy or a combination of the two. f&g, GFP-NTL8 protein level determined by western blot assay. 8-day old seedlings treated with 100μM cycloheximide (CHX) in the warm (20°C, f), or in the cold (5°C, g), as indicated for 24hr and 48hr. Ponceau staining of the input on separate gels was used for the loading control. Quantification of band intensity is shown on each gel. Two independent repeats with similar results; for gel source data, see supplementary figure 1. h&i, 8-day old seedlings treated with 100μM cycloheximide (CHX) in the warm (20°C) or cold (5°C), as indicated for 48hr, were imaged with the fluorescence microscope Leica DM6000 (h) and with the Leica SP5 confocal microscope (i). Root structures and dying cells are shown in (i) with Propidium Iodide staining. Scale = 100μm. Two independent repeats with similar results.
Extended Data Fig. 7. Changes in production and growth rate are still consistent with the mathematical model.
a, Growth rate at different temperatures estimated from the weight of 50 seedlings at different times following growth in the warm (20°C) and in the cold (5°C). Seedlings were transferred to the cold (blue data points) after 7 days in the warm (data shown as empty circles) or 12 days (filled diamonds). Errors are s.e.m of six (8 days, 12 days warm) and three (all other timepoints) biological replicates. Linear regression was used, with the fitted lines shown together with the slopes corresponding to the growth rates in the different conditions. The difference in growth between warm and cold was approximately 7-fold. The older seedlings grew faster in the cold. Therefore we used the average slope between the growth rates of 7-day-old and 12-day-old plants in the cold as the cold growth rate. b, Assay of the absolute amount of NTL8 by western blot with the same number of seedlings grown for 8 days in warm (20°C) and then moved to cold (5°C) or kept in warm (20°C), showing that the amount of NTL8 per plant increases in the warm and in the cold. Errors are s.e.m of thirteen biological replicates. For gel source data, see supplementary figure 1. We performed a one-way ANOVA test: p-value = 8.544·10-10, F=39.42, R square = 0.6865, with the Tukey HSD post hoc test for multiple comparisons which showed all 3 pairs (NV-Cold: p-value = 1.44·1010-9, NV-Warm: p-value = 0.0038, Cold-Warm: p-value = 1.55·10-5) are significantly different. c, Model from Fig. 3c (no degradation) reproduced for comparison (α = ¼, tdiv (cold) = 7 days). d, Same model with a 4-fold longer division time (α = ¼, tdiv (cold) = 28 days), showing accumulation that saturates more slowly. e, Model with decreased production (α = ⅛, tdiv (cold) = 7 days). The timescale of the accumulation does not change, but the saturated levels are decreased, thus increasing the requirement for reduced dilution to explain the experimentally observed accumulation. f, Model with decreased production and a 4-fold longer division time (α = ⅛, tdiv (cold) = 28 days), showing that further reduced dilution can recover some of the effect due to decreased production. g, Table of parameters of model from Fig. 3a-c.
Extended Data Fig. 8. Additional treatments to reduce growth rate.
a, Inhibition of growth by applying kanamycin (Kan, 200μg/L), Aminoethoxyvinylglycine (AVG, 1μM or 10μM), Abscisic acid (ABA, 1mM), 2,4-Dichlorophenoxyacetic acid (2,4-D, 1μM), Indole-3-acetic acid (IAA, 10μM), brassinazole (Brz, 1μM or 10μM), 1-Aminocyclopropane-1-carboxylic Acid (ACC, 1μM, 10μM, or 100μM), Hydroxyurea (HU, 10mM or 20mM) and paclobutrazol (PAC, 2μM, 20μM or 100μM). Control indicates no treatment. Seedlings grown for around 6-days were transferred to new medium supplemented with indicated chemicals for 2 days in the warm (20°C). Two independent experiments showed similar results. b, Imaging of the fluorescence signal of GFP-NTL8 in the root tip of plants from (a) after treatments for 2 days in the warm (20°C). Scale = 100μm. c, Quantification of fluorescence intensity averaged over multiple roots. Two independent experiments were combined; roots imaged per treatment (treatment order as in (c) from left to right): 16 roots total (6 excluded), 25 (1), 13 (0), 55 (3), 13 (0), 18 (0), 19 (0), 20 (7), 30 (3), 52 (0), 19 (0), 40 (0), 25 (0), 43 (0), 30 (1), 42 (0), 51 (1). Errors are s.e.m. We observed higher NTL8 in all treatments that inhibited growth without killing the plants. Seedlings treated with 10mM or 20mM hydroxyurea for two days were almost dead. The 1μM AVG treatment did not increase NTL8 levels, which is expected since growth was not slowed in that case. ACC treatments showed subtle effects, possibly due to indirect effects.
Extended Data Fig. 9. Alternative treatments affecting growth show perturbed NTL8 levels.
a, Seedling phenotypes. 6-day old seedlings were treated under Short Day (8hr light/16hr dark) or Long Day (16hr light/8hr dark) conditions for two weeks in the warm (20°C). b, Assay of growth in (a) by measuring fresh weight. Bulk of 50 individual seedlings were weighed. Errors indicates s.e.m of ten (for short day) or eight (for long day) replicates. c, Analysis of NTL8 protein concentration from treatments in (b) by western blot assay with equal weight of starting material. As shown by Ponceau staining, which differs between Short Day and Long Day treatments. MPK6 was therefore used as the loading control. Ponceau staining and MPK6 antibody of the input were performed on the same gel, separate to the NTL8 gel. For gel source data, see supplementary figure 1. d, Quantification of relative NTL8 protein concentration in (c) with ImageJ (normalised to Short Day levels). Error bars show s.e.m of 4 replicates. e, Effect of gibberellin treatment on NTL8 accumulation in the cold. 8-day seedlings grown in the warm (20°C) were transferred to a new medium supplemented with or without gibberellin (GA, 10μM), and treated for 4 weeks in the cold (5°C) before imaging. Quantification of fluorescence intensity; roots imaged per treatment (treatment order as in (e) from left to right): 28 roots total (0 excluded), 28 (0), 31 (0), 31 (1). Errors are s.e.m. For comparison between treatments with and without GA, one-tailed t-test was performed: for line S4: t-value = -3.21, df=54, p-value = 0.0011, for line S8: t-value = - 7.75, df = 59, p-value = 7.2·10−11. f, Inhibition of growth by applying MG132 (100μM). - MG132 indicates no treatment. Seedlings grown for around 6-days in the warm (20°C) were transferred to new medium supplemented with indicated chemicals for 2 days in the warm (20°C). g, Imaging of the fluorescence signal of GFP-NTL8 in the root tip of plants from (f) after treatments for 24hr and 48hr. Scale = 50μm. Six independent repeats with similar results.
Extended Data Fig. 10. Root tissue structure and computational model of the root, NTL8 protein stability, and map-based cloning of ntl8-D and ntl14-D mutations.
a, Diagram of root structure showing division zone, elongation zone and differentiation zone as well as the different tissue types in the meristematic region. Modified from40. b, Analytical solution of the Ordinary Differential Equation (ODE) model (solid line) and computational simulation (dashed line) of the growth dilution model give the same predicted NTL8 concentration pattern. A small difference is seen in the cold because, in the simulation, division is occurring in a single step every week, as opposed to the smooth, averaged growth of the ODE model. c, NTL8 protein is stable over timescales of weeks. 4 weeks cold (5°C) root imaged after a further 2 days in the warm (20°C, i & ii), or 24 days in the cold (5°C) following the 2-day warm treatment (iii & iv). i, iii show the root tip, and ii, iv show the region of the root where NTL8 accumulated during the 4-week cold period. NTL8 is maintained at those high levels after transfer to warm (ii), due to limited further growth in that region, and persists there after transfer back to the cold for at least 24 days (iv). Root structures and dying cells are shown with Propidium Iodide staining. Scale = 100μm. Two roots. d, Diagram of map-based cloning for ntl8-D1 and ntl8-D2. Recombination numbers are indicated separately for ntl8-D1 and ntl8-D2 mutants. Diagram was drawn according to41. e, Diagram of map-based cloning for ntl14-D. Recombination numbers are indicated as shown. Diagram was drawn according to42.
Supplementary Material
Acknowledgements
We thank Eva Wegel for help with microscopy; Shuqin Chen and Rongrong Xie for genetic screening; Dr John Fozard (JIC) for guidance on image analysis and discussion; Cecilia Lövkvist and all other members in the Dean and Howard groups for critical discussions; Shucai Wang (Northeast Normal University) for providing the HA::NTL8 line; Prof Harvey Millar (The University of Western Australia) for help on protein stability assessment; and Martin Trick (John Innes Centre) for bioinformatic analysis of genome resequencing data (ntl8-D1).This work was funded by the European Research Council grant ‘MEXTIM’ and supported by the BBSRC Institute Strategic Programmes GRO (BB/J004588/1) and GEN (BB/P013511/1).
Footnotes
Author contributions: Conceptualization: YZ, RLAK, CD, MH. Experimental methodology: RLAK performed RNA extraction and qPCR for Fig. 1c, 3f and Extended Data Fig. 3g, YZ performed all other experiments, GC developed fluorescence imaging protocol and assisted with image acquisition. Theoretical methodology: RLAK performed all model development and analysis. Data analysis: YZ performed image processing for Western quantification, RLAK performed image analysis of fluorescence intensity. Funding acquisition: CD, MH. Project administration: CD. Supervision: CD, MH. Writing: YZ, RLAK, CD, MH.
Competing interests: The authors declare no competing interests.
Additional information:
Supplementary Information is available for this paper.
Reprints and permissions information is available at www.nature.com/reprints.
Data and code availability
Quantitative source data for figures and full scanned images of western blots are provided with the paper. Raw images that support the findings of this study are available at doi: 10.6084/m9.figshare.12283970. Code is available as a supplementary file and at https://github.com/ReaAntKour/NTL8TemperatureGrowth/
References
- 1.Garrity PA, Goodman MB, Samuel AD, Sengupta P. Running hot and cold: behavioral strategies, neural circuits, and the molecular machinery for thermotaxis in C. elegans and Drosophila. Genes Dev. 2010;24:2365–2382. doi: 10.1101/gad.1953710. [DOI] [PMC free article] [PubMed] [Google Scholar]
- 2.McClung CR, Davis SJ. Ambient thermometers in plants: from physiological outputs towards mechanisms of thermal sensing. Curr Biol. 2010;20:R1086–1092. doi: 10.1016/j.cub.2010.10.035. [DOI] [PubMed] [Google Scholar]
- 3.Ding Y, Shi Y, Yang S. Advances and challenges in uncovering cold tolerance regulatory mechanisms in plants. New Phytol. 2019;222:1690–1704. doi: 10.1111/nph.15696. [DOI] [PubMed] [Google Scholar]
- 4.Zhang J, Li X-M, Lin H-X, Chong K. Crop Improvement Through Temperature Resilience. Annual review of plant biology. 2019;70:753–780. doi: 10.1146/annurev-arplant-050718-100016. [DOI] [PubMed] [Google Scholar]
- 5.De Lucia F, Crevillen P, Jones AM, Greb T, Dean C. A PHD-Polycomb Repressive Complex 2 triggers the epigenetic silencing of FLC during vernalization. Proc Natl Acad Sci U S A. 2008;105:16831–16836. doi: 10.1073/pnas.0808687105. [DOI] [PMC free article] [PubMed] [Google Scholar]
- 6.Sung S, Amasino RM. Vernalization in Arabidopsis thaliana is mediated by the PHD finger protein VIN3. Nature. 2004;427:159–164. doi: 10.1038/nature02195. [DOI] [PubMed] [Google Scholar]
- 7.Wood CC, et al. The Arabidopsis thaliana vernalization response requires a polycomb-like protein complex that also includes VERNALIZATION INSENSITIVE 3. Proc Natl Acad Sci U S A. 2006;103:14631–14636. doi: 10.1073/pnas.0606385103. [DOI] [PMC free article] [PubMed] [Google Scholar]
- 8.Michaels SD, Amasino RM. FLOWERING LOCUS C encodes a novel MADS domain protein that acts as a repressor of flowering. Plant Cell. 1999;11:949–956. doi: 10.1105/tpc.11.5.949. [DOI] [PMC free article] [PubMed] [Google Scholar]
- 9.Sheldon CC, et al. The FLF MADS box gene: a repressor of flowering in Arabidopsis regulated by vernalization and methylation. Plant Cell. 1999;11:445–458. doi: 10.1105/tpc.11.3.445. [DOI] [PMC free article] [PubMed] [Google Scholar]
- 10.Hepworth J, et al. Absence of warmth permits epigenetic memory of winter in Arabidopsis. Nature communications. 2018;9:639. doi: 10.1038/s41467-018-03065-7. [DOI] [PMC free article] [PubMed] [Google Scholar]
- 11.Antoniou-Kourounioti RL, et al. Temperature Sensing Is Distributed throughout the Regulatory Network that Controls FLC Epigenetic Silencing in Vernalization. Cell Systems. 2018;7:e649. doi: 10.1016/j.cels.2018.10.011. [DOI] [PMC free article] [PubMed] [Google Scholar]
- 12.Kim SG, Kim SY, Park CM. A membrane-associated NAC transcription factor regulates salt-responsive flowering via FLOWERING LOCUS T in Arabidopsis. Planta. 2007;226:647–654. doi: 10.1007/s00425-007-0513-3. [DOI] [PubMed] [Google Scholar]
- 13.Kim SG, Lee AK, Yoon HK, Park CM. A membrane-bound NAC transcription factor NTL8 regulates gibberellic acid-mediated salt signaling in Arabidopsis seed germination. Plant J. 2008;55:77–88. doi: 10.1111/j.1365-313X.2008.03493.x. [DOI] [PubMed] [Google Scholar]
- 14.Tian H, et al. NTL8 Regulates Trichome Formation in Arabidopsis by Directly Activating R3 MYB Genes TRY and TCL1. Plant Physiol. 2017;174:2363–2375. doi: 10.1104/pp.17.00510. [DOI] [PMC free article] [PubMed] [Google Scholar]
- 15.Yang ZT, et al. The membrane-associated transcription factor NAC089 controls ER-stress-induced programmed cell death in plants. PLoS Genet. 2014;10:e1004243. doi: 10.1371/journal.pgen.1004243. [DOI] [PMC free article] [PubMed] [Google Scholar]
- 16.Li P, et al. Fructose sensitivity is suppressed in Arabidopsis by the transcription factor ANAC089 lacking the membrane-bound domain. Proc Natl Acad Sci U S A. 2011;108:3436–3441. doi: 10.1073/pnas.1018665108. [DOI] [PMC free article] [PubMed] [Google Scholar]
- 17.Klein P, Seidel T, Stocker B, Dietz KJ. The membrane-tethered transcription factor ANAC089 serves as redox-dependent suppressor of stromal ascorbate peroxidase gene expression. Front Plant Sci. 2012;3:247. doi: 10.3389/fpls.2012.00247. [DOI] [PMC free article] [PubMed] [Google Scholar]
- 18.O’Malley RC, et al. Cistrome and Epicistrome Features Shape the Regulatory DNA Landscape. Cell. 2016;165:1280–1292. doi: 10.1016/j.cell.2016.04.038. [DOI] [PMC free article] [PubMed] [Google Scholar]
- 19.Liang M, et al. Subcellular Distribution of NTL Transcription Factors in Arabidopsis thaliana. Traffic. 2015;16:1062–1074. doi: 10.1111/tra.12311. [DOI] [PubMed] [Google Scholar]
- 20.Kim SY, et al. Exploring membrane-associated NAC transcription factors in Arabidopsis: implications for membrane biology in genome regulation. Nucleic Acids Res. 2007;35:203–213. doi: 10.1093/nar/gkl1068. [DOI] [PMC free article] [PubMed] [Google Scholar]
- 21.Meng X, et al. ANAC017 Coordinates Organellar Functions and Stress Responses by Reprogramming Retrograde Signaling. Plant Physiology. 2019;180:634–653. doi: 10.1104/pp.18.01603. [DOI] [PMC free article] [PubMed] [Google Scholar]
- 22.Ng DWK, Abeysinghe JK, Kamali M. Regulating the Regulators: The Control of Transcription Factors in Plant Defense Signaling. International journal of molecular sciences. 2018;19:3737. doi: 10.3390/ijms19123737. [DOI] [PMC free article] [PubMed] [Google Scholar]
- 23.Li L, et al. Protein Degradation Rate in Arabidopsis thaliana Leaf Growth and Development. The Plant Cell. 2017;29:207–228. doi: 10.1105/tpc.16.00768. [DOI] [PMC free article] [PubMed] [Google Scholar]
- 24.Band LR, et al. Growth-induced hormone dilution can explain the dynamics of plant root cell elongation. Proceedings of the National Academy of Sciences; 2012. pp. 7577–7582. [DOI] [PMC free article] [PubMed] [Google Scholar]
- 25.Erickson RO, Michelini FJ. The Plastochron Index. Am JBot. 1957;44:297–305. doi: 10.2307/2438380. [DOI] [Google Scholar]
- 26.Merchante C, Stepanova AN, Alonso JM. Translation regulation in plants: an interesting past, an exciting present and a promising future. Plant J. 2017;90:628–653. doi: 10.1111/tpj.13520. [DOI] [PubMed] [Google Scholar]
- 27.Zhang T-Q, Xu Z-G, Shang G-D, Wang J-W. A Single-Cell RNA Sequencing Profiles the Developmental Landscape of Arabidopsis Root. Molecular Plant. 2019;12:648–660. doi: 10.1016/j.molp.2019.04.004. [DOI] [PubMed] [Google Scholar]
- 28.Mahonen AP, et al. PLETHORA gradient formation mechanism separates auxin responses. Nature. 2014;515:125–129. doi: 10.1038/nature13663. [DOI] [PMC free article] [PubMed] [Google Scholar]
- 29.Greb T, et al. The PHD finger protein VRN5 functions in the epigenetic silencing of Arabidopsis FLC. Curr Biol. 2007;17:73–78. doi: 10.1016/j.cub.2006.11.052. [DOI] [PubMed] [Google Scholar]
- 30.Mylne JS, et al. LHP1, the Arabidopsis homologue of HETEROCHROMATIN PROTEIN1, is required for epigenetic silencing of FLC. Proc Natl Acad Sci U S A. 2006;103:5012–5017. doi: 10.1073/pnas.0507427103. [DOI] [PMC free article] [PubMed] [Google Scholar]
- 31.Liu F, Marquardt S, Lister C, Swiezewski S, Dean C. Targeted 3’ processing of antisense transcripts triggers Arabidopsis FLC chromatin silencing. Science. 2010;327:94–97. doi: 10.1126/science.1180278. [DOI] [PubMed] [Google Scholar]
- 32.Hou X, et al. A platform of high-density INDEL/CAPS markers for map-based cloning in Arabidopsis. The Plant Journal. 2010;63:880–888. doi: 10.1111/j.1365-313X.2010.04277.x. [DOI] [PubMed] [Google Scholar]
- 33.Box MS, Coustham V, Dean C, Mylne JS. Protocol: A simple phenol-based method for 96-well extraction of high quality RNA from Arabidopsis. Plant Methods. 2011;7:7. doi: 10.1186/1746-4811-7-7. [DOI] [PMC free article] [PubMed] [Google Scholar]
- 34.Kodama Y. Time Gating of Chloroplast Autofluorescence Allows Clearer Fluorescence Imaging In Planta. PloS one. 2016;11:e0152484–e0152484. doi: 10.1371/journal.pone.0152484. [DOI] [PMC free article] [PubMed] [Google Scholar]
- 35.Yang H, et al. Distinct phases of Polycomb silencing to hold epigenetic memory of cold in Arabidopsis. Science. 2017;357:1142–1145. doi: 10.1126/science.aan1121. [DOI] [PubMed] [Google Scholar]
- 36.Alon U. An Introduction to Systems Biology. Chapman & Hall; 2007. [Google Scholar]
- 37.Grandjean O, et al. In vivo analysis of cell division, cell growth, and differentiation at the shoot apical meristem in Arabidopsis. Plant Cell. 2004;16:74–87. doi: 10.1105/tpc.017962. [DOI] [PMC free article] [PubMed] [Google Scholar]
- 38.Reddy GV, Heisler MG, Ehrhardt DW, Meyerowitz EM. Real-time lineage analysis reveals oriented cell divisions associated with morphogenesis at the shoot apex of Arabidopsis thaliana. Development. 2004;131:4225–4237. doi: 10.1242/dev.01261. [DOI] [PubMed] [Google Scholar]
- 39.Rahni R, Birnbaum KD. Week-long imaging of cell divisions in the Arabidopsis root meristem. Plant Methods. 2019;15:30. doi: 10.1186/s13007-019-0417-9. [DOI] [PMC free article] [PubMed] [Google Scholar]
- 40.Bouché F. Arabidopsis - Root cell types. 2017 doi: 10.6084/m9.figshare.4688752.v1. [DOI] [Google Scholar]
- 41.The Arabidopsis Information Resource (TAIR) 2020 May 15; https://www.arabidopsis.org/servlets/mapper?value=f12k2&action=search on www.arabidopsis.org.
- 42.The Arabidopsis Information Resource (TAIR) 2020 May 15; https://www.arabidopsis.org/servlets/mapper?value=mwd9&action=search on www.arabidopsis.org.
Associated Data
This section collects any data citations, data availability statements, or supplementary materials included in this article.
Supplementary Materials
Data Availability Statement
Quantitative source data for figures and full scanned images of western blots are provided with the paper. Raw images that support the findings of this study are available at doi: 10.6084/m9.figshare.12283970. Code is available as a supplementary file and at https://github.com/ReaAntKour/NTL8TemperatureGrowth/


