

Abstract
Complex diseases such as hypertension, cancer, and diabetes cause nearly 70% of the deaths in the U.S. and involve multiple genes and their interactions with environmental factors. Therefore, identification of genetic factors to understand and decrease the morbidity and mortality from complex diseases is an important and challenging task. With the generation of an unprecedented amount of multi-omics datasets, network-based methods have become popular to represent the multilayered complex molecular interactions. Particularly node embeddings, the low-dimensional representations of nodes in a network are utilized for gene function prediction. Integrated network analysis of multi-omics data alleviates the issues related to missing data and lack of context-specific datasets. Most of the node embedding methods, however, are unable to integrate multiple types of datasets from genes and phenotypes. To address this limitation, we developed a node embedding algorithm called Node Embeddings of Complex networks (NECo) that can utilize multilayered heterogeneous networks of genes and phenotypes. We evaluated the performance of NECo using genotypic and phenotypic datasets from rat (Rattus norvegicus) disease models to classify hypertension disease-related genes. Our method significantly outperformed the state-of-the-art node embedding methods, with AUC of 94.97% compared 85.98% in the second-best performer, and predicted genes not previously implicated in hypertension.
Keywords: Network integration, random walk with restart, multiplex heterogeneous networks, network propagation, graph representation, node embedding, feature learning, multi-omics data integration, genotype to phenotype mapping, disease gene prediction, hypertension, complex disease, rat
I. Introduction
Almost two-thirds of the deaths in the U.S. are caused by complex diseases such as cardiovascular disease, hypertension, cancer and diabetes [7]. Complex diseases involve interactions of multiple genes with each other and with environmental factors [14]. Identification of complex disease genes to understand disease pathways and mechanisms, and to reduce death rates, is therefore a vital yet difficult endeavor. Comprehensive understanding of the mechanisms of complex diseases and traits often involve generating large datasets that characterize the effects on phenotypes by, for instance, the genome, transcriptome, epigenome or proteome. The available datasets may not be specific for the particular complex trait in question, such as protein-protein interactions (PPI) [19]. To facilitate better understanding of the complexity of multilayered molecular interactions and elucidate the genotype-phenotype relationships, integrative network analysis methods have been employed [3, 10, 20].
To utilize such networks for downstream supervised and unsupervised analyses such as link prediction, community detection and node classification, latent representation of networks (i.e., node embeddings) are computed [8, 15]. Many of the recent studies utilize simple networks for latent representation, and recently several tools have emerged to learn the latent representation of more complex networks [1, 4]. Some of the recent node embedding methods rely on random walks-based approaches to learn the neighborhood of the nodes in the network. In a random walk, an imaginary walker starts at an initial node and iteratively visits one of its neighbors in the network. Random walk with restart (RWR) is a variation of random walk where in the first step, an imaginary walker starting from an initial node moves to one of its immediate neighbors in the network and then either walks to another neighbor or jumps back to the initial node iteratively. As random walks use the topological structure of networks, they are effective to capture the proximity of nodes to each other. After learning the node neighborhoods, node embeddings are computed by the Skip-gram algorithm. The Skip-gram algorithm predicts surrounding nodes of a given node based on the assumption that the nodes appearing more frequently in the same context are similar to each other [15]. DeepWalk, Node2vec and Metapath2vec are random walk-based node embedding algorithms [4, 8, 15]. DeepWalk and Node2vec utilize homogeneous networks; Node2vec employs a biased random walk algorithm to capture both structural similarities of nodes as well as homophily [9]. Metapath2vec was developed to address the need for heterogeneous (having multiple node types) networks [4]. However, these methods lack the ability to utilize multiplex heterogeneous networks using steady state ranking of RWR, and they cannot efficiently utilize the proximity of heterogeneous nodes.
In this study, we present a new node embedding algorithm, called Node Embeddings of Complex networks (NECo), that can utilize multiplex heterogeneous networks. NECo utilizes multiplex gene and phenotype networks to learn the latent features of genes and phenotypes for downstream analysis such as gene function classification and drug-gene interactions (Fig. 1). First, NECo creates a complex network structure using multiple gene/phenotype layers and a bipartite network of genes and phenotypes. NECo uses a RWR strategy to generate the top N node neighborhoods for each node in the network. Unlike Metapath2vec NECo handles heterogeneous nodes by generating four types of neighborhoods: i) gene-gene: gene rankings starting from each gene node, ii) gene-phenotype: phenotype rankings starting from each gene node, iii) phenotype-gene: gene rankings starting from each phenotype node, iv) phenotype-phenotype: phenotype rankings starting from each phenotype node. Then, it learns the embeddings of genes and phenotypes based on top N nodes of each of these neighborhoods utilizing the Skip-gram algorithm. For gene embeddings, gene-gene, gene-phenotype and phenotype-gene neighborhoods are used. For phenotype embeddings, phenotype-phenotype, phenotype-gene and gene-phenotype neighborhoods are used. Finally, those different node embeddings are concatenated and utilized by supervised/unsupervised learning algorithms for various downstream analyses.
Fig. 1.
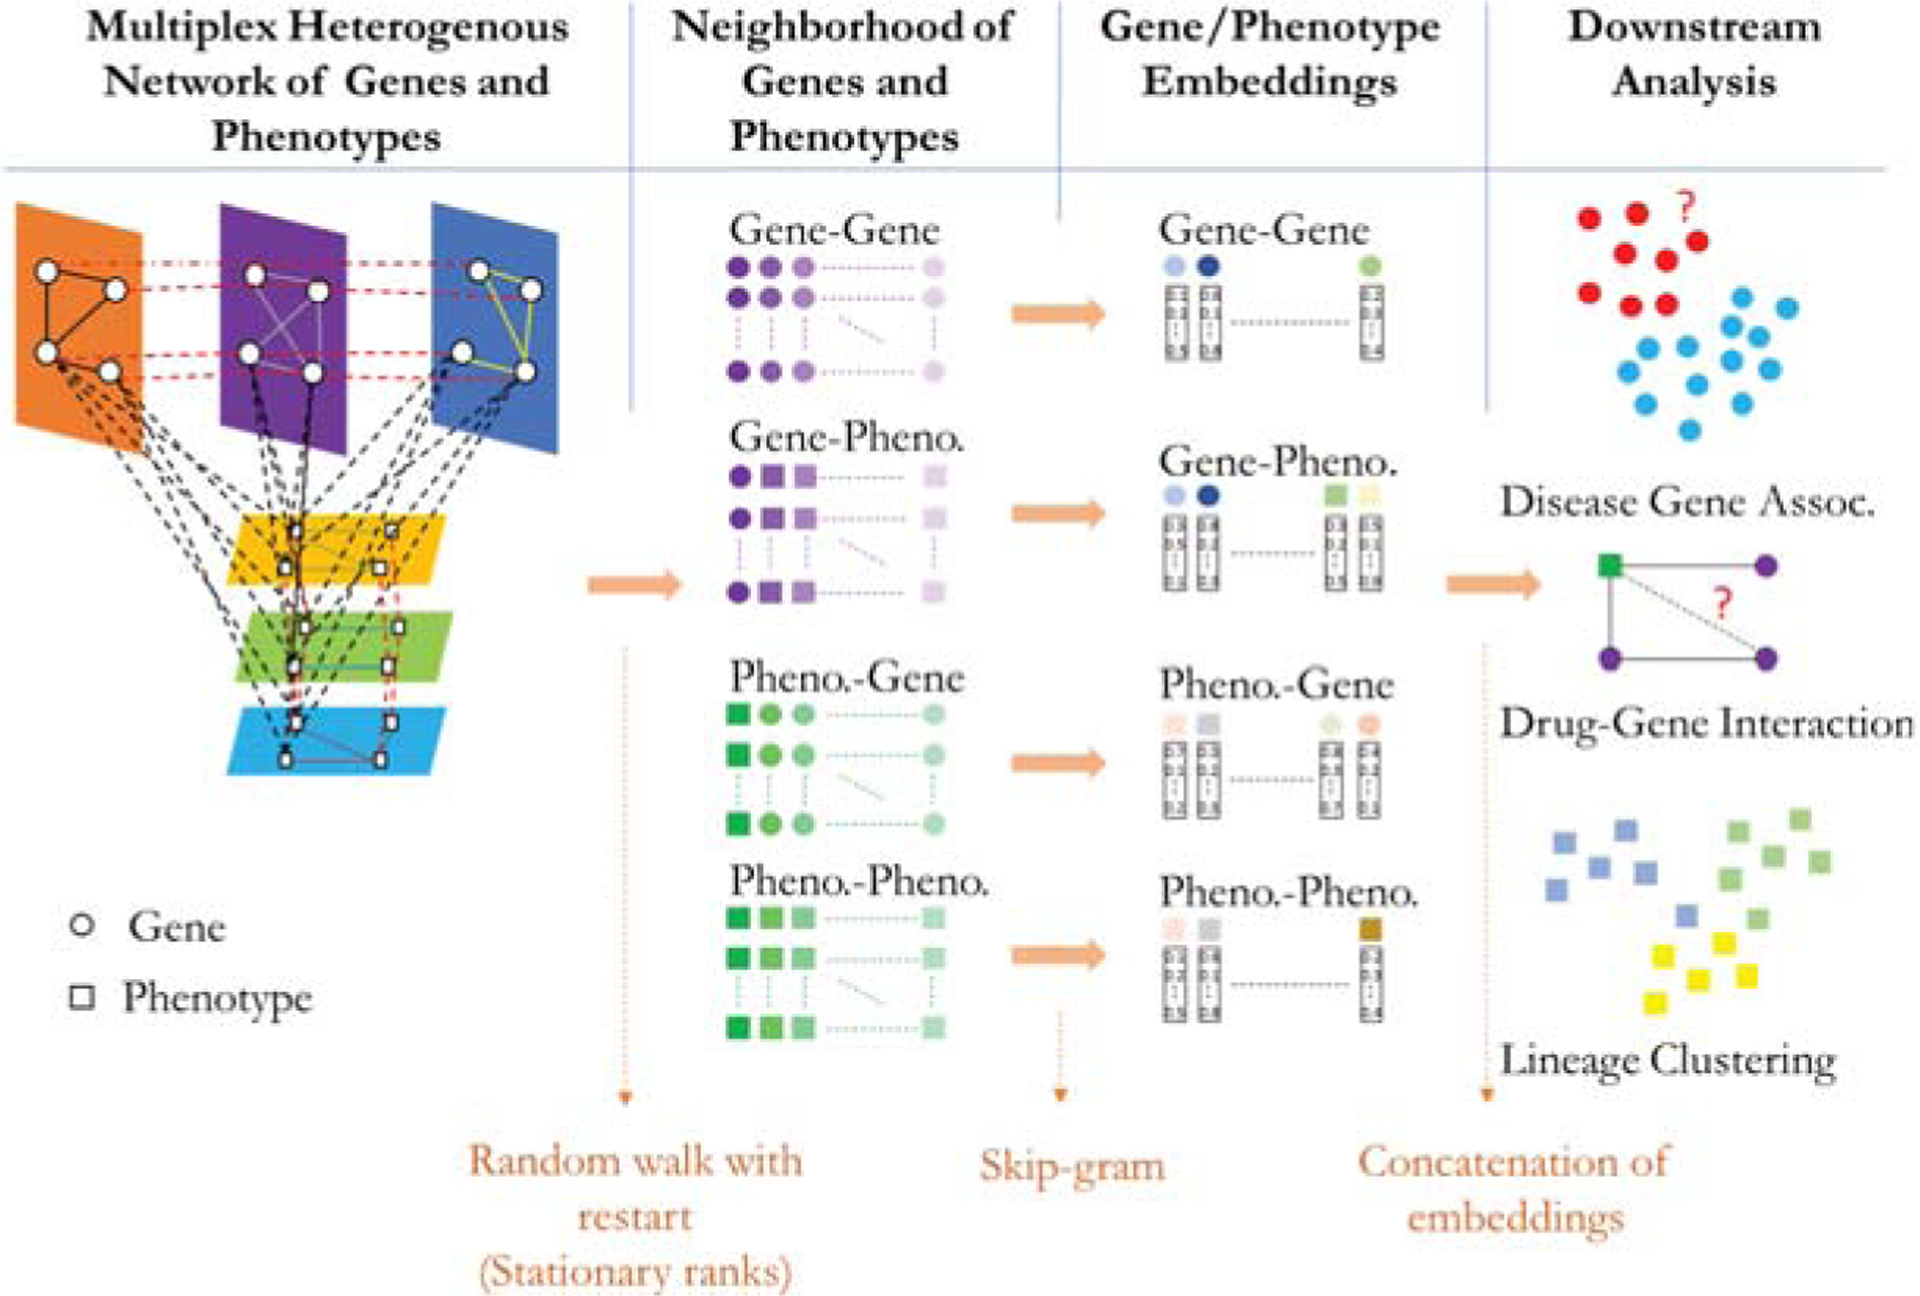
Overview of the NECo framework. NECo first generates the complex multiplex heterogeneous undirected weighted network. Then, it obtains the neighborhood of Gene-Gene, Gene-Phenotype, Phenotype-Gene and Phenotype-Phenotype by random walk with restart. Thirdly, NECo takes the top N of those neighborhoods and learns the latent representation of nodes using the Skip-gram algorithm. The learned node embeddings of different spaces then are concatenated and used for classification using a statistical learning algorithm.
We compared NECo’s performance with other approaches on predicting known hypertension disease-related genes using multidimensional rat datasets. NECo outperformed the other approaches by about a 9% margin. Furthermore, the top 20 novel hypertension-related gene predictions by NECo had supporting evidence in the literature of their role in hypertension.
II. MATERIALS AND METHODS
A. Random Walk on Multiplex Heterogeneous Network
NECo utilizes RWR algorithm on undirected multiplex heterogeneous networks to compute a node neighborhood starting from each node in the network and applies the Skip-gram algorithm to learn the latent features of nodes in the network based on their RWR rankings (Fig. 1). NECo creates a multiplex heterogeneous network of genes and phenotypes in a similar way PhenoGeneRanker creates with default parameters [6]. Specifically, NECo can utilize multiple layered undirected networks which have two different type of nodes. Unlike several node embedding algorithms [4, 8, 15] that rely on truncated random walks, NECo utilizes the steady state distribution of RWR to generate the neighborhood of the nodes in the network ((Eq. 1)),
| (1) |
where r is the restart probability (i.e., RWR moves backs to the starting nodes), pt represents the probability distribution vector of nodes at time t and W is the transition matrix of the network, which is computed by column normalization of the adjacency matrix of the network.
After a number of steps, Eq. (1) reaches a steady state for undirected networks [3]. The magnitude of r affects the convergence rate of the RWR algorithm, where a large r leads to fast convergence to steady state [12] and limits the diffusion of the random walk. The steady state distribution (ps) can be used as a proximity vector for the nodes in the network starting from an initial node. NECo sets r = 0.7 by default as in other RWR algorithms [6, 11, 13, 18].
B. Node Embedding
NECo utilizes top N nodes of different RWR neighbourhood spaces as a proximity measure of the nodes (Fig. 1). NECo generates mixed node rankings that include genes and phenotypes starting from either a gene or phenotype node via RWR. To generate Gene-Gene and Gene-Phenotype neighborhoods, NECo separates the node rankings by node type where the initial node for RWR is a gene node, and it generates Phenotype-Gene and Phenotype-Phenotype neighborhoods similarly where the initial node is a phenotype node. Then, NECo utilizes the Skip-gram algorithm to learn the node embeddings based on the neighborhoods of each gene or phenotype. The goal of the Skip-gram algorithm is to learn the node features of a given node which are predictive of nodes in its proximity. The objective function of the Skip-gram algorithm becomes the maximization of the log likelihood in Eq. (2);
| (2) |
where V is the set of nodes in the network, v is a node in the network, and N(v) is the set of neighbor nodes of node v, and zv is the embedding of node v.
C. Disease Gene Classification Using Gene Embeddings
To evaluate the performance of NECo, we applied it to a multidimensional rat dataset to generate a multiplex heterogeneous network, with the goal of predicting hypertension disease-related rat genes [5]. We created a three-layer gene interaction network composed of gene transcript co-expression, protein-protein interaction and pathway layers. Using rat strain information, we created a three-layer rat strain similarity network composed of mammalian phenotype ontology (MPO) term-based similarity, disease ontology (DO) term-based similarity and quantitative phenotype (QP) measurements-based similarity layers. All strain layers were created based on their similarity to each other in the context of hypertension. MPO and DO layers were generated based on semantic similarity of rat strains’ annotations to hypertension-related ontology terms (Supplementary Table 1 and 2), and QP layer was generated based on systolic blood pressure, heart rate and heart weight measurements of rat strains. Ontology term-based semantic similarity measures the degree of relatedness between two entities by the similarity in meaning of their annotations over a set of ontology terms by utilizing the graph representation of the terms [16]. We connected the multiplex gene network to the multiplex strain network by calculating the semantic similarity of genes to strains based on their MPO annotations.
We ran NECo on different network configurations. We employed the Generalized Linear Model (GLM) to classify hypertension-related genes using the gene embeddings computed by NECo. The feature set of each gene was composed of concatenation of gene embeddings based on Gene-Gene and Gene-Phenotype neighborhood spaces. We used the rat gene disease annotations in Rat Genome Database (RGD) to determine the set of “ground truth” hypertension disease-related rat genes. We selected the experimental annotations but excluded the genes having only gene expression-based experimental evidence codes (Supplementary Table 3). The number of unique genes in the whole network where all gene layers were used was 18,275 and the number of genes in the “ground truth” set was 167. We employed 10-fold 10-repeat stratified cross validation for performance measurement.
III. Results
In this study, we developed a node embedding algorithm, NECo that uses multiplex gene and phenotype networks to learn node embeddings. Using a multidimensional rat dataset, a multiplex gene network was generated using differential transcript co-expression, PPI and pathway layers. A multiplex phenotype network was generated using MPO, DO and QP strain layers.
We present our findings on comparing NECo to other state-of-the-art node embedding algorithms, show literature review results for the novel predictions by NECo and the effects of different embedding spaces.
A. NECo Outperforms Other Node Embedding Algorithms
We compared NECo with three state-of-the-art node embedding algorithms, namely Node2vec, DeepWalk and Metapath2vec by applying a grid search for all the algorithms [5]. We built a complex network based on rat datasets and computed embeddings for each gene using the node embedding algorithms. Then we evaluated the performance of hypertension disease-related gene prediction.
Table 1 shows mean area under the receiver operating characteristic curve (AUC), F1 micro and macro scores of classification using the gene embedding of each algorithm. GLM classification based on the embeddings computed by NECo achieved an AUC of 94.97%, whereas the second-best performer classification was 85.98%. Classifications using NECo embeddings had higher F1 micro and macro scores than other methods as well.
Table 1.
Mean area under receiver operating characteristic curve (AUC), F1 Micro and F1 Macro values with standard deviations are given for 10 runs for each embedding algorithm. For the GLM classification 10-fold cross-validation was repeated 10 times. Values are in percentage.
| Method | Mean AUC | Mean F1 Micro | Mean F1 Macro |
|---|---|---|---|
| NECo | 94.97 ±0.24 | 90.98 ±0.15 | 55.06 ±0.13 |
| Node2vec | 85.98 ± 0.54 | 87.92 ±0.28 | 51.48 ±0.20 |
| DeepWalk | 85.21 ± 0.85 | 88.24 ±0.27 | 51.88 ± 0.28 |
| Metapath2vec | 82.33 ±0.05 | 51.12 ±2.08 | 36.19 ±1.01 |
B. NECo Predicts Novel Hypertension-Related Genes
To further examine top novel predictions by NECo, we performed a literature-based search of these predictions. To identify the top-ranked predicted genes, we picked the top-scored seven configurations based on AUC scores, as their AUC scores were nearly identical to each other (Supplementary Table 4). For each network configuration, we generated node embeddings 10 times and ranked the genes by their prediction probability based on the 10-fold 10-repeat stratified cross validation. We then calculated the final rank based on the median ranks of each gene across these 70 results. We chose median ranks instead of mean ranks to avoid any outlier ranks. We filtered the known hypertension genes based on our ground truth set of hypertension disease-related genes. We investigated the top 20 novel predictions for genes that at the time had not been annotated for hypertension-related disease at RGD (Table 2). Literature curation of these genes determined that 18 of NECo’s top predictions have published evidence, in most cases not merely expression-based, that the genes are involved in hypertension (Table 2). For the remaining two genes Pla2g10 and Ckmt2, we could not find specific hypertension-related annotations. However there is supporting literature that Pla2g10 is involved in a signaling axis regulating blood pressure homeostasis [2] and Ckmt2 is involved in cardiovascular disease [17].
Table 2.
Novel NECo gene predictions sorted by prediction probability with supporting publications. references for publications listed in supplementary Table 5.
| Gene Symbol | # of Supporting Publications |
|---|---|
| Pdc | 3 |
| Rcn2 | 1 |
| Gna11 | 1 |
| Kcnk6 | 2 |
| Fkbp1b | 3 |
| Pla2g5 | 3 |
| F2rl1 | 2 |
| Ptger1 | 3 |
| Adora3 | 2 |
| Gnaq | 2 |
| Wnk3 | 2 |
| Lyz2 | 4 |
| Agxt2 | 2 |
| Fga | 4 |
| Mybph | 1 |
| Nox1 | 5 |
| Ptger2 | 3 |
| Asl | 2 |
C. Gene-Gene and Gene-Phenotype Embedding Spaces Achieved Higher Gene Classification Performance Than Phenotype-Gene Embedding Spaces
Since we utilized multiple gene and phenotype datasets, we analyzed the contribution of single embedding spaces to the classification results across different network combinations (Fig. 2). We observed that the Gene-Gene embeddings performed better than the Gene-Phenotype embeddings when the gene network was multiplex. When the gene network was aggregated, the Gene-Phenotype embeddings performed significantly better than the Gene-Gene embeddings, whereas when the phenotype network was aggregated, Gene-Gene embeddings performed significantly better than the Gene-Phenotype embeddings. On the other hand, there was no significant difference between their performances when both gene and phenotype networks were aggregated. Moreover, the results clearly showed that the Gene-Gene and Gene-Phenotype embedding spaces performed significantly higher than the Phenotype-Gene embeddings for all network combinations.
Fig. 2.
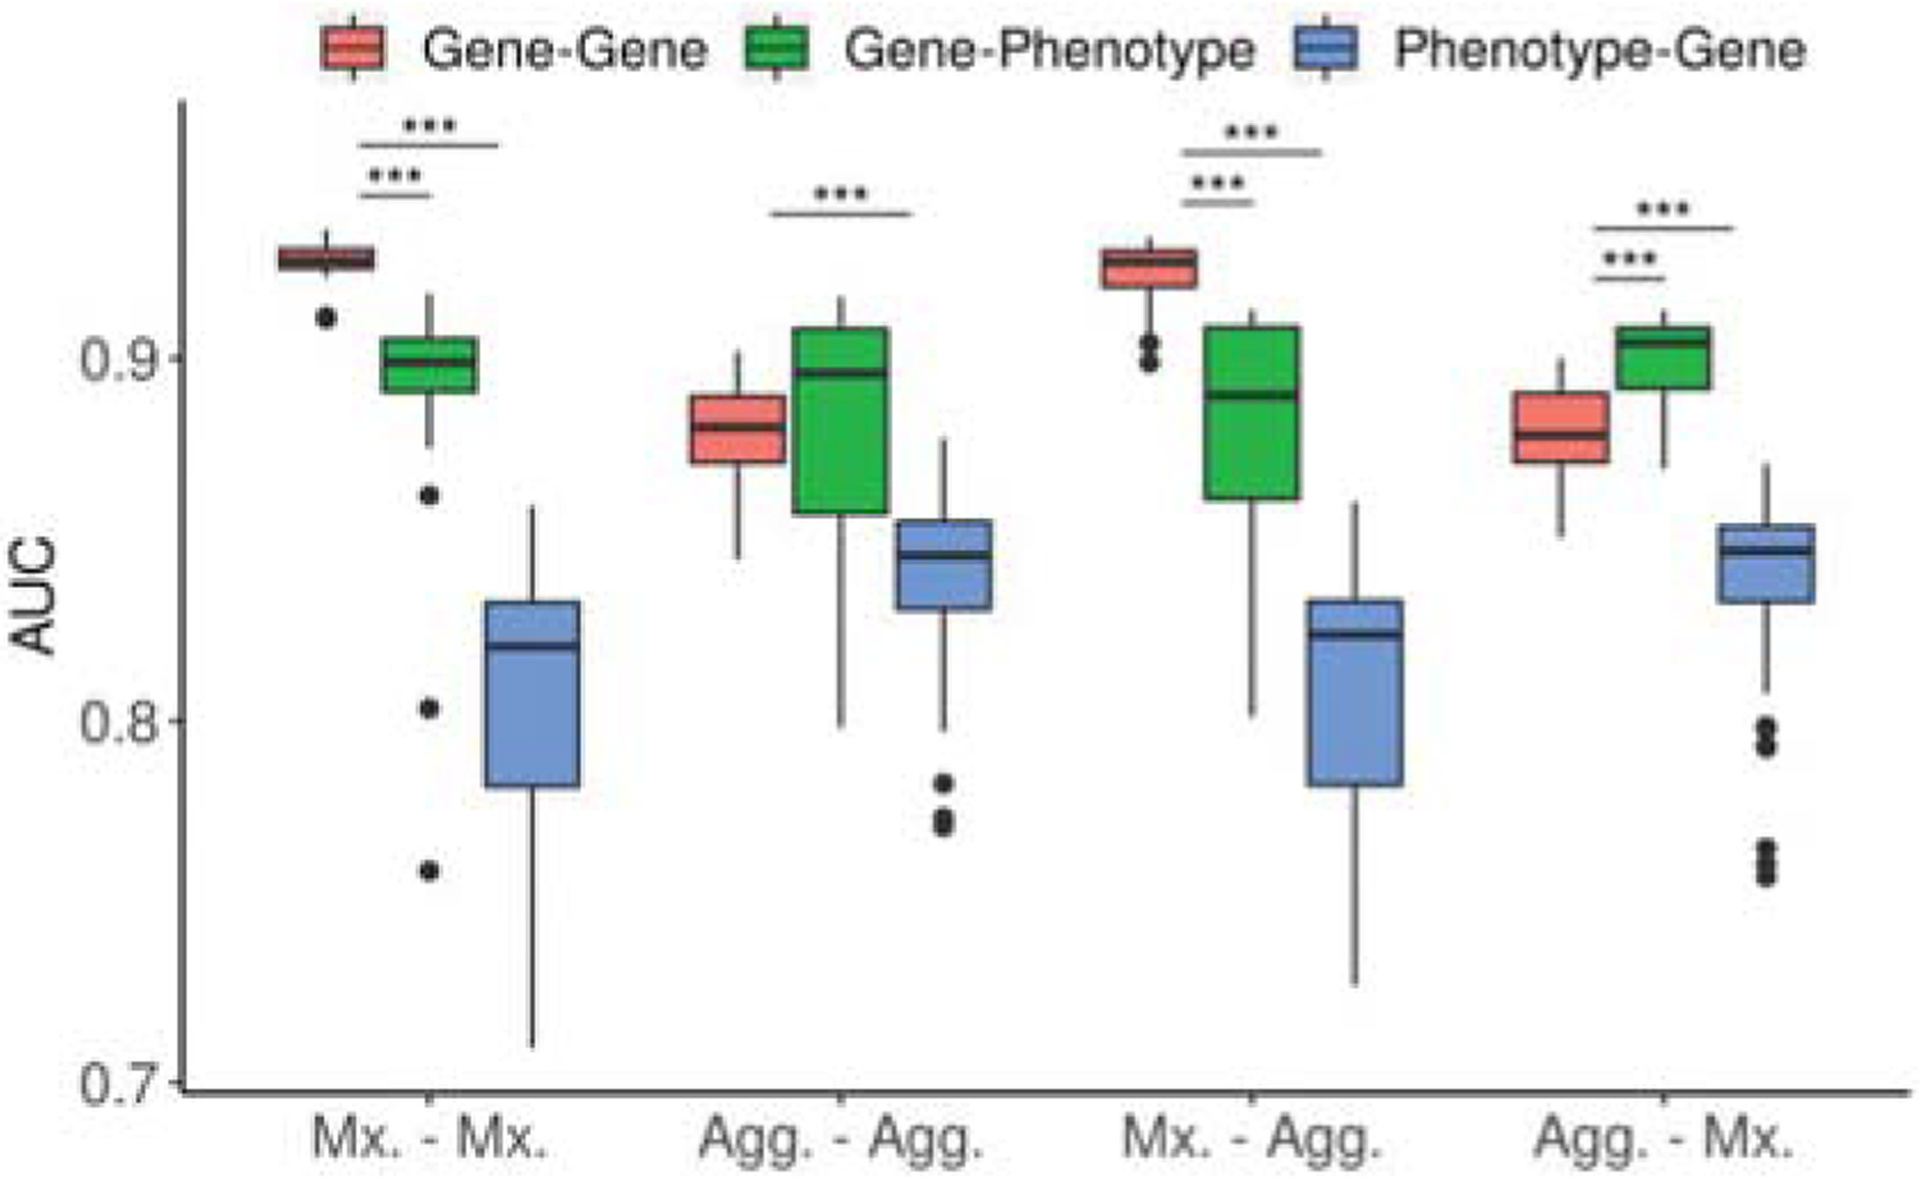
Contribution of gene-gene, gene-phenotype and phenotype-gene embedding spaces across different network combinations which utilize all three multiplex (Mx.) or aggregated (Agg.) gene and phenotype networks. Groups are shown in Gene-Phenotype network format. ***: p ≤ 0.001
IV. Discussion
In this study, we developed a node embedding tool called NECo that can utilize multiplex heterogeneous networks of genes and phenotypes. NECo uses stationary node ranks of RWR as a proximity measure of nodes, divides the node ranks into different neighborhood spaces, and then applies the Skip-gram algorithm to generate the node embeddings.
NECo’s power of using multiplex networks could be utilized more efficiently if the two types of node embeddings were used in the downstream analysis. We did not generate phenotype embeddings for the current experimental study, but it is straightforward to generate phenotype embeddings for a different problem setting. A higher contribution of gene multiplex networks to the gene embeddings in the gene classification task compared to the contribution of multiplex phenotype networks suggests that if the embeddings of both node types are used in the downstream analysis, the power of multiplex network usage for both node types would be efficiently utilized in the downstream analysis such as drug-gene interaction studies or gene/cell line classification.
Supplementary Material
Acknowledgments
This study was funded by grant R01HL064541 from the National Heart, Lung, and Blood Institute of the National Institutes of Health (RGD) and by grant R35GM133657 from National Institute of General Medical Sciences of the National Institutes of Health.
Footnotes
Availability and implementation: The source code is available on GitHub at https://github.com/bozdaglab/NECo.
Supplementary information: Supplementary data are available at https://doi.org/10.1101/2020.06.15.149559.
Contributor Information
Cagatay Dursun, Dept. of Biomedical Engineering, Marquette University – Medical, College of Wisconsin, Milwaukee WI USA.
Serdar Bozdag, Dept. of Computer Science, Marquette University, Milwaukee WI USA, Dept. of Computer Science and Engineering, University of North Texas, Denton TX USA.
References
- [1].Bagavathi A and Krishnan S 2019. Multi-Net: A Scalable Multiplex Network Embedding Framework. Complex Networks and Their Applications VII (2019), 119–131. [Google Scholar]
- [2].Berry E et al. 2015.Matrix metalloproteinase-2 negatively regulates cardiac secreted phospholipase A2 to modulate inflammation and fever. Journal of the American Heart Association. 4, 4 (March. 2015). DOI: 10.1161/JAHA.115.001868. [DOI] [PMC free article] [PubMed] [Google Scholar]
- [3].Cowen L et al. 2017. Network propagation: A universal amplifier of genetic associations. Nature Reviews Genetics. 18, 9 (2017), 551–562. DOI: 10.1038/nrg.2017.38. [DOI] [PubMed] [Google Scholar]
- [4].Dong Y et al. 2017.metapath2vec: Scalable Representation Learning for Heterogeneous Networks. Proceedings of the 23rd ACM SIGKDD International Conference on Knowledge Discovery and Data Mining - KDD ‘17 (Halifax, NS, Canada, 2017), 135–144. [Google Scholar]
- [5].Dursun C et al. 2020.NECo: A node embedding algorithm for multiplex heterogeneous networks. bioRxiv. (September. 2020), 2020.06.15.149559. DOI: 10.1101/2020.06.15.149559. [DOI] [PMC free article] [PubMed] [Google Scholar]
- [6].Dursun C et al. 2019.PhenoGeneRanker: A Tool for Gene Prioritization Using Complete Multiplex Heterogeneous Networks. Proceedings of the 10th ACM International Conference on Bioinformatics, Computational Biology and Health Informatics (New York, NY, USA, 2019), 279–288. [Google Scholar]
- [7].Eyre H et al. 2004.Preventing Cancer, Cardiovascular Disease, and Diabetes. Diabetes Care. 27, 7 (July. 2004), 1812. DOI: 10.2337/diacare.27.7.1812. [DOI] [PubMed] [Google Scholar]
- [8].Grover A and Leskovec J 2016. node2vec: Scalable Feature Learning for Networks. Proceedings of the 22nd ACM SIGKDD International Conference on Knowledge Discovery and Data Mining - KDD ‘16 (San Francisco, California, USA, 2016), 855–864. [DOI] [PMC free article] [PubMed] [Google Scholar]
- [9].Hamilton WL et al. 2017.Inductive Representation Learning on Large Graphs. (2017), 19.
- [10].Kim Y-A et al. 2016.Understanding Genotype-Phenotype Effects in Cancer via Network Approaches. PLOS Computational Biology. 12, 3 (2016), e1004747. DOI: 10.1371/journal.pcbi.1004747. [DOI] [PMC free article] [PubMed] [Google Scholar]
- [11].Köhler S et al. 2008.Walking the Interactome for Prioritization of Candidate Disease Genes. American Journal of Human Genetics. 82, 4 (2008), 949–958. DOI: 10.1016/j.ajhg.2008.02.013. [DOI] [PMC free article] [PubMed] [Google Scholar]
- [12].Langville AN and Meyer CD 2011. Google’s PageRank and Beyond: The Science of Search Engine Rankings. Princeton Uni. Press. [Google Scholar]
- [13].Li Y and Patra JC 2010. Genome-wide inferring gene-phenotype relationship by walking on the heterogeneous network. Bioinformatics. 26, 9 (2010), 1219–1224. DOI: 10.1093/bioinformatics/btq108. [DOI] [PubMed] [Google Scholar]
- [14].Motulsky AG 2006.Genetics of complex diseases. Journal of Zhejiang University. Science. B. 7, 2 (February. 2006), 167–168. DOI: 10.1631/jzus.2006.B0167. [DOI] [PMC free article] [PubMed] [Google Scholar]
- [15].Perozzi B et al. 2014.DeepWalk: online learning of social representations. Proceedings of the 20th ACM SIGKDD international conference on Knowledge discovery and data mining - KDD ‘14 (New York, New York, USA, 2014), 701–710. [Google Scholar]
- [16].Pesquita C et al. 2009.Semantic Similarity in Biomedical Ontologies. PLOS Computational Biology. 5, 7 (July. 2009), e1000443. DOI: 10.1371/journal.pcbi.1000443. [DOI] [PMC free article] [PubMed] [Google Scholar]
- [17].Shendre A et al. 2017.Admixture Mapping of Subclinical Atherosclerosis and Subsequent Clinical Events Among African Americans in 2 Large Cohort Studies. Circulation. Cardiovascular Genetics. 10, 2 (April. 2017). DOI: 10.1161/CIRCGENETICS.116.001569. [DOI] [PMC free article] [PubMed] [Google Scholar]
- [18].Valdeolivas A et al. 2018. Random walk with restart on multiplex and heterogeneous biological networks. Bioinformatics. 35, 3 (July. 2018), 497–505. DOI: 10.1093/bioinformatics/bty637. [DOI] [PubMed] [Google Scholar]
- [19].Wang S et al. 2018. Typing tumors using pathways selected by somatic evolution. Nature Communications. 9, 1 (October. 2018), 4159. DOI: 10.1038/s41467-018-06464-y. [DOI] [PMC free article] [PubMed] [Google Scholar]
- [20].Yan J et al. 2018. Network approaches to systems biology analysis of complex disease: integrative methods for multi-omics data. Briefings in Bioinformatics. 19, 6 (November. 2018), 1370–1381. DOI: 10.1093/bib/bbx066. [DOI] [PMC free article] [PubMed] [Google Scholar]
Associated Data
This section collects any data citations, data availability statements, or supplementary materials included in this article.