

Abstract
Our goal is to improve driver safety predictions in at-risk medical or aging populations from naturalistic driving video data. To meet this goal, we developed a novel model capable of detecting and tracking unsafe lane departure events (e.g., changes and incursions), which may occur more frequently in at-risk driver populations. The model detects and tracks roadway lane markings in challenging, low-resolution driving videos using a semantic lane detection pre-processor (Mask R-CNN) utilizing the driver’s forward lane region, demarking the convex hull that represents the driver’s lane. The hull centroid is tracked over time, improving lane tracking over approaches which detect lane markers from single video frames. The lane time series was denoised using a Fix-lag Kalman filter. Preliminary results show promise for robust lane departure event detection. Overall recall for detecting lane departure events was 81.82%. The F1 score was 75% (precision 69.23%) and 70.59% (precision 62.07%) for left and right lane departures, respectively. Future investigations include exploring (1) horizontal offset as a means to detect lead vehicle proximity, even when image perspectives are known to have a chirp effect and (2) Long Short Term Memory (LSTM) models to detect peaks instead of a peak detection algorithm.
I. INTRODUCTION
Motor vehicle crashes are a leading cause of death and injury worldwide. According to the World Health Organization, nearly 1.2 million people worldwide die and 50 million are injured every year due to traffic-related crashes. Traffic crashes result in considerable economic cost, currently estimated at 1–2% of average gross national product ($518 billion globally per year) [1]. According to the European Accident Research and Safety Report 2013, more than 90% of vehicle crashes are caused by driver errors [1]. Unsafe lane departures due to driver error are a common cause of crashes. Estimates from the U.S. National Highway Traffic Safety Administration indicate that 11% of crashes result from the driver inappropriately departing from their lane while driving [2].
In 2017, 44 million older drivers (≥65 years) were licensed in the United States, accounting for the fastest growing segment of the driver population [3]. In the same year, nearly 7,700 of them died in vehicle crashes and more than 257,000 were injured [4]. Statistics show that those drivers over 75+ years have a higher fatal crash rate in comparison to middle-aged (35 to 54 years) drivers [5], [6]. According to Wang et al., lane departures are the second leading cause of vehicle crashes [7].
Our goal is to develop techniques to classify driver safety behaviors related to unsafe lane departures in challenging, low-resolution naturalistic driving videos. Our technique can be applied broadly to improve driver safety assessments and predictions in at-risk populations, like older drivers. Better assessments of real-world driver safety can be used to support the development of methods to screen, detect, and track unsafe drivers and interventions aimed at preserving or improving driver safety. To meet this goal, we deployed our techniques to detect unsafe lane departures on challenging, low-resolution video collected from a naturalistic driving study on older driver safety across >180,000 miles of driving. Low-resolution video data is a common challenge in naturalistic driving datasets, often due to need for high compression rates that reduce data size permitting long-term data collection [8].
While others have approached this challenge [9], [10], prior methods have struggled to accurately detect lane markers and departure events in low-resolution video data. Our method improves on previous models by detecting lanes over time, rather than from single video frames, tracking the vehicle’s position relative to the forward roadway’s lane markers to improve departure detection, and robustly performing with challenging, low-resolution video data.
Our model defines lane departure events as lane changes (typically a deliberate driver action) or incursions (typically a driver error). Incursions are incomplete lane departures where the driver quickly returns to the original lane of travel (typically due to the driver self-correcting a lane departure error). While previous literature addresses simple lane marker detection, our model focuses on the detection and segmentation of the forward roadway lane area. Once the forward lane area is detected using consecutive video frames, we tracked the centroid of the convex hull region, which represents the forward lane area. The offset of the centroid’s location relative to the image’s vertical centerline was used to determine if the driver was driving within the lane or had departed from the lane.
II. RELATED WORKS
Unsafe lane departure events can result from several sources. In older drivers, age-related visual decline can impair driver ability to see surrounding traffic and lane markers increasing risk of unsafe lane departures (e.g., changing lanes while a vehicle in the opposing traffic lane is in the driver’s blind spot) [11]. Works on lane detection and departure warning systems date back to the 1990s. Previously proposed methods in this area can be classified as low-level image feature base, machine/deep learning (DL) based approaches, or a hybrid between the two. The most widely used Lane Departure Warning (LDW) systems are either vision-based (e.g., histogram analysis, Hough transformation), more recently on DL. In general, vision-based and DL lane detection systems start by capturing images using a selected type of sensor, pre-processing the image, followed by lane marker detection and tracking. While many types of sensors have been proposed for capturing lanes images such as radars, laser range, lidar, active infrared, etc. the most widely used device is a mobile camera. An alternative to vision- and DL-based systems is the use of global positioning systems (GPS) combined with Geographic Information Systems [12]. However, current LDW based on GPS can be unreliable, mainly because of the often low reliability and resolution, signal loss (e.g., in covered areas), and inaccurate map databases. Due to these limitations, most modern research conducted in LDW involves the utilization of Neural Network-based solutions in some form.
Neural Networks have been a subject of investigation in the autonomous vehicles field for a while. Among the very first attempts to use a neural network for vehicle navigation, ALVINN [13] is considered a pioneer and one of the most influential papers. This model is comprised of a shallow neural network that predicts actions out of captured images from a forward-facing camera mounted on-board a vehicle, with few obstacles, leading to the potential use of neural networks for autonomous navigation. More recently, advances in object detection such as the contribution made by DL and Region Convolutional Neural Network (R-CNN) [14] in combination with Region Proposal Network (RPN) [15] have created models such as Mask R-CNN [15] that provide state of the art predictions. New trends in Neural Network object detection include segmentation, which we applied in our model as an estimator for lane departure events.
A. Image Feature Based Methods
Image feature-based lane detection is a well-researched area of computer vision [16]. The majority of existing image feature-based methods use detected lane marker features such as colors, gray-scale intensities, and textural information to perform edge detection. These approaches are very sensitive to illumination and environmental conditions.
In 2005, Lee and Yi [17] introduced the use of Sobel operator plus non-local maximum suppression (NLMS). It was built upon methods from Lee [20] which propose a linear lane model and edge distribution function (EDF) as well as lane boundary pixel extractor (LBPE) plus Hough transform. The model was able to overcome weak points of the EDF based lane-departure identification (LDI) system by increasing lane parameters. The LBPE improved the robustness of lane detection by minimizing missed detections and false positives (FPs) by taking advantage of linear regression analysis. Despite improvements, the model performed poorly at detecting curved lanes.
Some of the low-level image feature-based models include an initial layer to normalize illumination across consecutive images, other methods rely on filters or statistical models such as random sample consensus (RANSAC) [12]. Lately, approaches more frequently incorporate machine learning, specifically deep learning to increase image quality before detection is conducted. However, image feature-based approaches require continuous lane detections and often fail to detect lanes when edges and colors are not clearly delineated (noisy), which results in inability to capture local image feature-based information. End-to-end learning from deep neural networks substantially improves model robustness in the face of noisy images or roadway features by learning useful features from deeper layers of convolution.
B. Deep Learning Based Methods
To create lane detection models that are robust to environmental (e.g., illumination, weather) and road (e.g., clarity or type of lane markings) variation, CNN is becoming an increasingly popular method. Lane detection on the images shown in Fig. 1 (a–c) are difficult to detect and extract without using CNN. Kim and Lee [18] combined a CNN with the RANSAC algorithm to detect lanes edges on complex scenes (e.g., roadside trees, fences, or intersections). In their method, CNN was primarily used to enhance images. In [19], they showed how existing CNNs can be used to perform lane detection while running at frame rates required for a real-time system. Ozcan et al. [20] used this method to improve traffic sign detections from low-resolution, noisy videos using a chain-code aggregated channel features (ACF)-based model and a CNN model (Fast-RCNN).
Fig. 1.
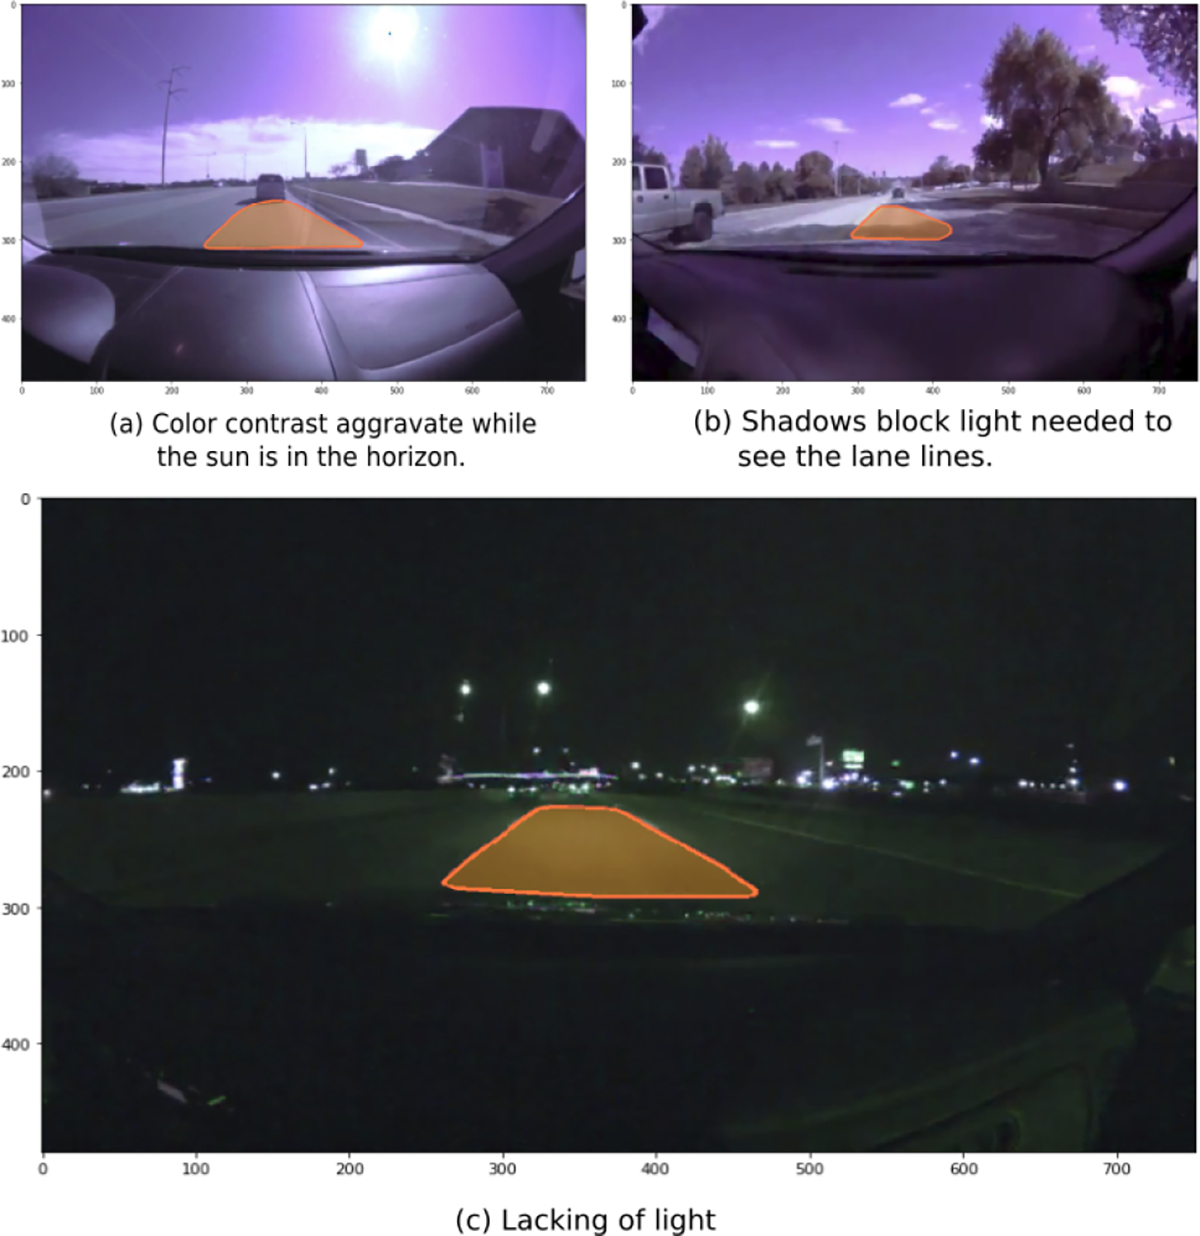
Examples were illumination and color contrast create Challenging conditions for lane detection
More recently, a number of lane-detection methods have been proposed. He et al. [21] used a Dual-View Convolutional Neural Network (DVCNN) with a hat-like filter and optimized simultaneously the frontal-view and the top-view cameras. The hat-like filter extracts all potential lane marker candidates, thus removing most of FPs (e.g., moving vehicles, barriers, curbs, ground arrows, and marked words on the roadway) from the forward roadway view. With the LaneNet model a lane edge proposal and lane marker localization strategy is used [22]. At first, a lane edge proposal network for pixel-wise lane edge classification is used and then a lane marker localization network detects lane markers based on the edge proposals with high processing speed and low computational cost.
A different approach by Zou et al. [23] use an encoder-decoder framework where features are firstly abstracted by a CNN encoder. Then, sequentially encoded features are processed by a ConvLSTM which are fed into the CNN decoder for information reconstruction and lane prediction. They claim that the proposed models can stably detect the lanes in diverse situations and can well avoid FPs. Brabandere et al. [24] propose a method to train a lane detector in an end-to-end manner using a deep network that predicts a segmentation-like weight map for each lane marker, and a differentiable least-squares fitting that returns best-fitting curve. They claim that the network learns to generate features that prevent instabilities during the model fitting step, as opposed to two-step pipelines methodology. In a similar approach, Neven et al. [25], have taken an end-to-end methodology using segmentation lane and fitting procedure claiming to run at 50 fps.
C. Lane departure models
The objective of Lane Departure Prediction (LDP) is to predict if the driver is likely to leave the lane with the goal of warning drivers in advance of the lane departure so that they may correct the error before it occurs (avoiding a potential crash). This improves on LDW systems, which simply alert the driver to the error after it has occurred. LDP algorithms can be classified into one of the following three categories: vehicle-variable-based, vehicle-position estimation, and detection of the lane boundary using real-time captured road images. They all use images captured in [26].
The time to lane crossing (TLC) model has been extensively used on production vehicles [27]. TLC systems evaluate the lane and vehicle state relying on vision-based equipment and perform TLC calculations online using a variety of algorithms. A TLC threshold is used to trigger an alert to the driver. Different computational methods are used with regard to the road geometries and vehicle types. Among these methods, the most common method used is to predict the road boundary, the vehicle trajectory, and then calculate intersection time of the two at the current driving speed. On small curvature roads, the TLC can be computed as the ratio of lateral distance to lateral velocity or the ratio of the distance to the line crossing. Studies suggest that TLC tend to have a higher false alarm rate (FAR) when the vehicle is driven close to lane boundary [26], [28].
Wang et al. [26] proposed an online learning-based approach to predict unintended lane-departures (LDB) from a personalized driver model (PDM) and Hidden Markov Model (HMM). The PDM quantifies the driver’s lane-keeping and lane-departure behaviors by using a joint-probability density distribution of Gaussian mixture model (GMM) between vehicle speed, relative yaw angle, relative yaw rate, lateral displacement, and road curvature. PDM can discern characteristics of an individual’s driving style. By combining PDM with HMM to estimate the vehicle’s lateral displacement, they were able to reduce the FAR by 3.07.
D. Driving behavior
A model using Support Vector Machine and K-Nearest Neighbor methods to estimate changes in fatigue-related driver steering behavior was proposed by Krajewsk et al. [29]. Sleepy drivers often show slow steering drifts or infrequent, rapid steering corrections (e.g., to correct lane position drifts). Older drivers are at risk for disrupted sleep and subsequent fatigue [30]. Salvucci et al. [31] developed a model to track changes in steering behavior from steering wheel angle, accelerator depression, lateral position, lead vehicle distance and headway time, and adjacent vehicle position (including presence or absence). The complexity of this model and limited information on surrounding traffic in our data eliminated the use of this model for our technique.
III. DATASET
Our dataset included 183,964 miles of driving and 30,034 drives. Data was collected from a broader longitudinal cohort study aimed at predicting older driver safety. Each driver was assessed for 2, 3-month periods separated by 1-year. Data analyzed for this paper was cross-sectional data collected during the first study year. The data analyzed included 77 drivers (65–90 years [μ = 75.3]; 36 female and 41 male) recruited from Omaha, Nebraska and surrounding areas. Drivers showed a range of cognitive and visual abilities (based on in-laboratory testing) that are typical of normally aging driver cohorts [32]. No drivers had major confounding medical conditions (e.g., dementia, psychiatric) or medication usage (e.g., antipsychotics, narcotics). To develop the lane departure detection algorithm, we annotated lane markers in 4,162 video frames to train our model. Videos came from a forward roadway camera mounted on the interior of each vehicle’s forward windshield (next to the rearview mirror). The videos had a resolution of 752×480 and were sampled at 25 fps. Images were split into training (70%), validation (15%), and test (15%) datasets.
We tested our algorithm on 30, 3-minute videos selected from our broader dataset. Videos were selected to contain lane departure events occurring across a variety of driving conditions typical for the dataset (e.g., nighttime, interstate or urban roadways, multiple lane departures, roadway shadow).
IV. PROPOSED MODEL AND LANE DEPARTURE
Lane detection in the presence of noisy and lower-resolution image data presents significant challenges. Illumination, color contrasts, and image resolution immediately prohibit the use of low-level image feature-based algorithms for detecting the lanes. Consequently, we turned our attention to machine/DL based models to detect lane regions as these models perform better than low-level image feature-based algorithms for given lower quality recordings on dataset. We selected a Mask R-CNN [33] architecture since we were mainly interested in segmented lane regions within the image. It has acceptable processing rate 5 fps [34] and provides a state-of-the-art mAP (mean average precision). The Mask R-CNN architecture, illustrated in Fig. 3, can be divided into two networks. The first network is the region proposal network (RPN) used for generating region proposals and a second network that use these proposals to detect objects. Video processing pipeline including detection and tracking is given in Alg. 1.
Fig. 3.
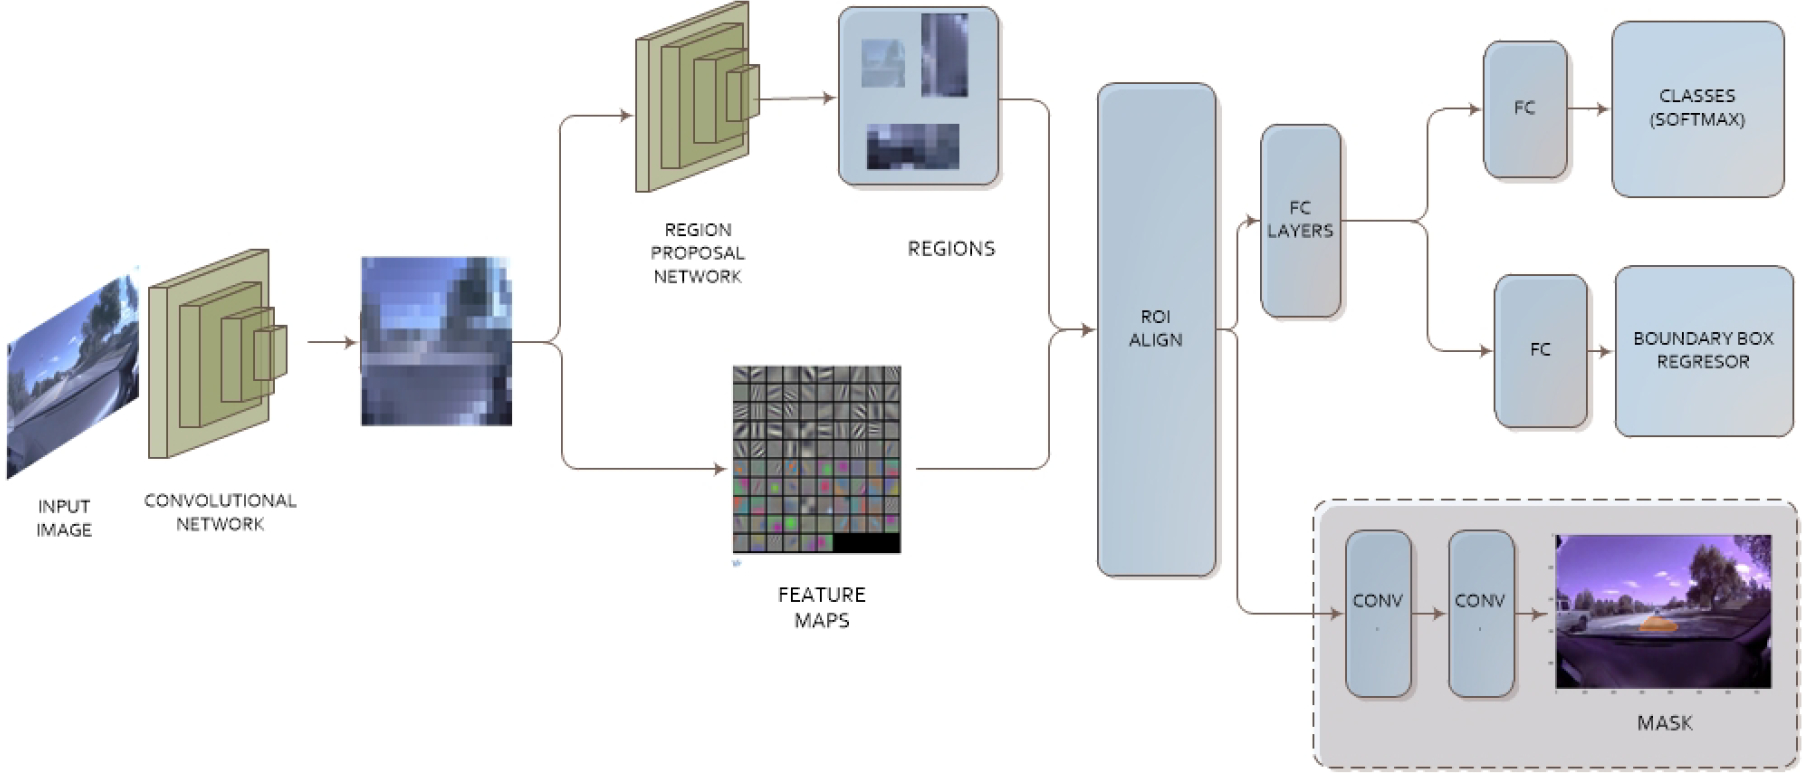
Segmentation Architecture of Mask R-CNN
A. Lane Detection
Our Mask R-CNN based model was configured using ResNet-50 as backbone with a learning rate of 0.001, a learning momentum of 0.9, and 256 RPN anchors per image. The model was trained to detect lane regions exclusively using segmented masks, rather than typical prior approaches detecting only lane markers. Lane region detection, rather than lane marker detection, performed more robustly with the low-resolution images. This approach provided us a lane segmentation mask, which was later used to track the lane regions. To mitigate FPs, we used a Region of Interest (ROI) skim mask that concealed areas not relevant to our view of interest. Fig. 1 (a–c) provides some of the example detections during daytime, nighttime, and shadowy conditions on the road.
algorithm 1.
Video Control Algorithm
| procedure VIDEOCAPTURE(video) | ▷ mp4 |
| frame ← video | |
| while frame ≠ Null do | ▷ Loop until video end |
| M ← detection | ▷ Mask |
| Display ← Tracking(M) | |
| frame ← video |
B. Lane Tracking
The mask tracking algorithm used for lane departure events is explained in Alg. 2. Once the lane mask regions were detected, the point coordinates conforming the mask were used to compute a convex hull enclosing the mask. For this purpose, we employed a Quickhull algorithm, which is shown in Alg. 3, in order to obtain a Convex Hull polygon. Next, a centroid of the convex hull was calculated. Our model used the centroid in order to track its vertical and horizontal offset of the vehicle within the lane as shown in Fig. 2. For reference, the vertical offset was calculated according to an imaginary vertical line in the middle of the image as illustrated in Fig. 2. Also, the horizontal reference was chosen to be an imaginary line between the vehicle and the detected mask. The horizontal offset was not used in our model; however, it was implemented to detect driving separation distance possibly useful for acceleration and braking.
Fig. 2.
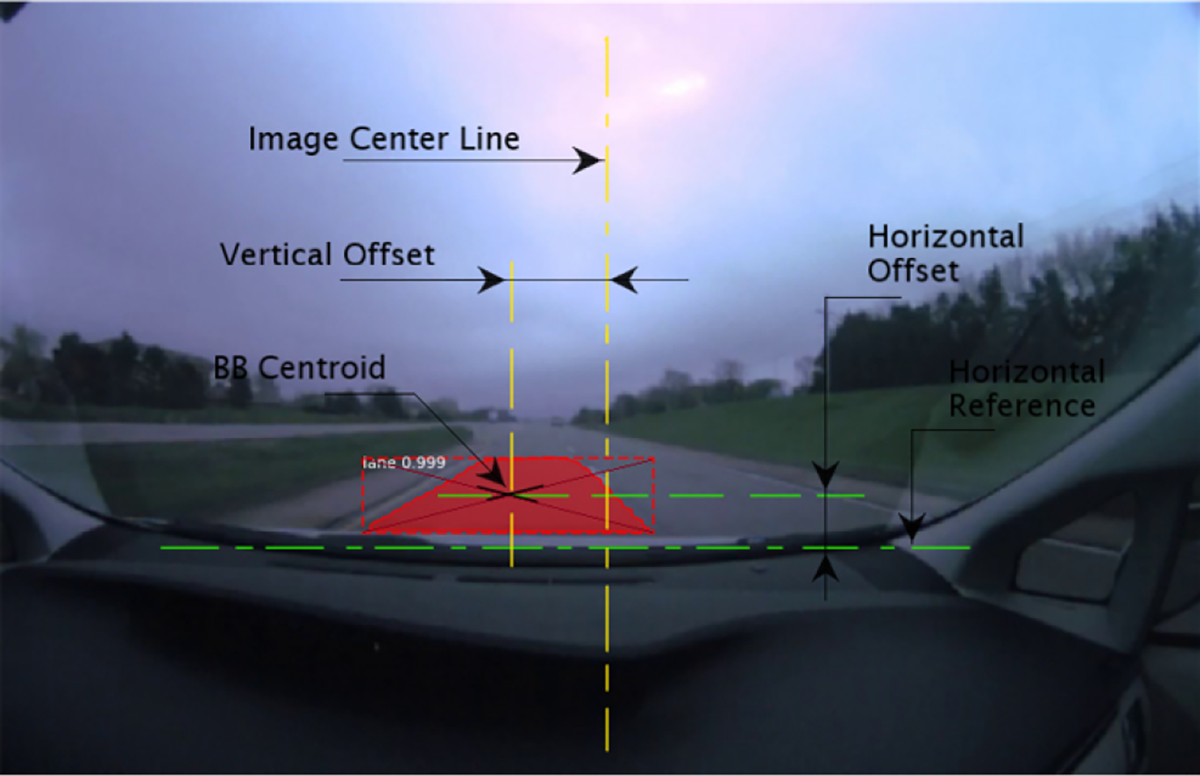
Location of the Lane Mask Centroid Offset with respect to the selected reference lines
The offsets were calculated using the distance between a line and a point in 2D space Eq. (1). The offset units were measured in number of pixels. These offsets were first tracked over time, then normalized by their means, centered at zero and smoothed using a Fix-lag Kalman filter as it is shown in Fig. 4 (a). We found that centering around zero permitted better data generalization across drivers due to the small variance in the location where the forward camera was mounted on the front vehicle windshield.
Fig. 4.
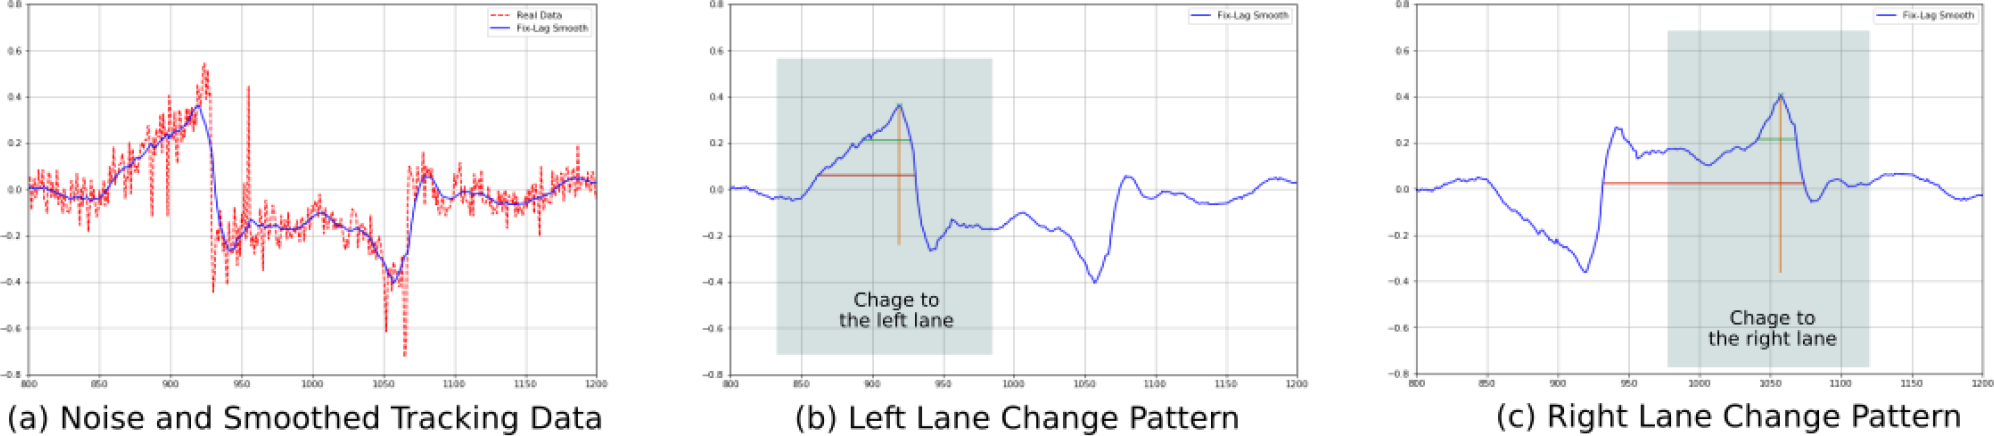
Synopsis of a lane change using Mask Centroid Tracking
| (1) |
C. Lane departure classification
The plots in Fig. 4 (b) and (c) illustrate the typical patterns observed when the line lanes are crossed towards left or right, respectively. These two plots were obtained while a driver changes from the right lane to the left lane and back to the right lane. It can be seen that there is a high peak that starts developing as the driver departs from the center of its lane following by rapid decline and a trend to go back to zero. Detecting and measuring this pattern is the core idea of our Alg. 2 that predicts the type of lane departure that occurred.
The coordinates of the detected segmentation polygon are calculated from the lane detection model. The coordinates are then converted into a convex hull using Alg. 3. A centroid for the convex-hull is calculated and tracked over time, and the noise of the signal is smoothed out by a Kalman Lag Filter. The original tracking signal and a horizontally mirrored time-series are used to detect the peaks that indicate the lane departures. The original time-series signal was used to discriminate lane departures to the left side while the horizontally mirrored signal predicted departures to the right. We were able to detect lane departures resulting from changes and incursions using these algorithms.
Our test dataset of 30, 3-minute videos containing lane departure events across typical driving conditions was annotated to mark: (a) event type (change or incursion) and (b) event time (start and end time). Each video had at least one lane departure event and, in some, a lane marker was partially to fully missing (i.e. lane bifurcation on a highway exit). We identified 3 lane incursion events. All other departure events were lane changes. From data inspection, we determined that lane departures, including incursions, were associated with changes in vertical offset. Key differences between lane incursions and changes were that incursions showed (1) differences in shallowness of the peak vertical offset and (2) absence of a depression zone. We used this observation to discriminate lane departure event types in Alg. 2.
algorithm 2.
Mask Tracking Algorithm
| procedure TRACKING(M) | ▷ Mask |
| Mcentroid ← MconvexHull ← M | |
| Msmooth ← series(Mnorm) ← Norm(Mcentroid) | |
| prediction ← classifier(msmooth) | |
| return ← prediction | |
| function CLASSIFIER(Msmoothing,) | ▷ smooth series |
| max ← Constant | ▷ Max distance between peaks |
| lanechange ← (None,None) | |
| laneincursion ← (None,None) | |
| Mmirror ← Mirror(Msmooth) | |
| origpeak ← Msmooth | |
| mirrpeak ← Mirror(Mmirror) | |
| if length(origpeak) > 0 & length(mirrpeak) > 0then | |
| if |origpeak − mirrpeak| < max then | |
| if 0 < origpeak − mirrpeak < max then | |
| lanechange ← (′left′,origpeak) | |
| return ← (lanechange, laneincursion) | |
| else if 0 < mirrpeak − origpeak < max then | |
| lanechange ← (′right′,mirrpeak) | |
| return ← (lanechange,laneincursion) | |
| else | |
| return ← (lanechange, (′incursion′,origpeak)) | |
| return ← (lanechange,laneincursion) | ▷ no change |
| function MIRROR(Msmooth) | ▷ smooth series |
| for X in Msmooth do | |
| Mmirror ← −X | |
| return ← Mmirror |
V. RESULTS
We tested our lane tracking algorithm on the test dataset to determine accuracy. Our main performance indicator for the pre-processing segmentation model to detect the forward lane area, Mask R-CNN, was mAP. A mAP of 70% was achieved. We acknowledge when evaluating our results that our video was collected from a single forward camera, limiting our algorithm to the forward lane area. To better illustrate our objective to detect lane departures, we provide a sequence of images showing the lane change detection process in Fig. 5.
Fig. 5.
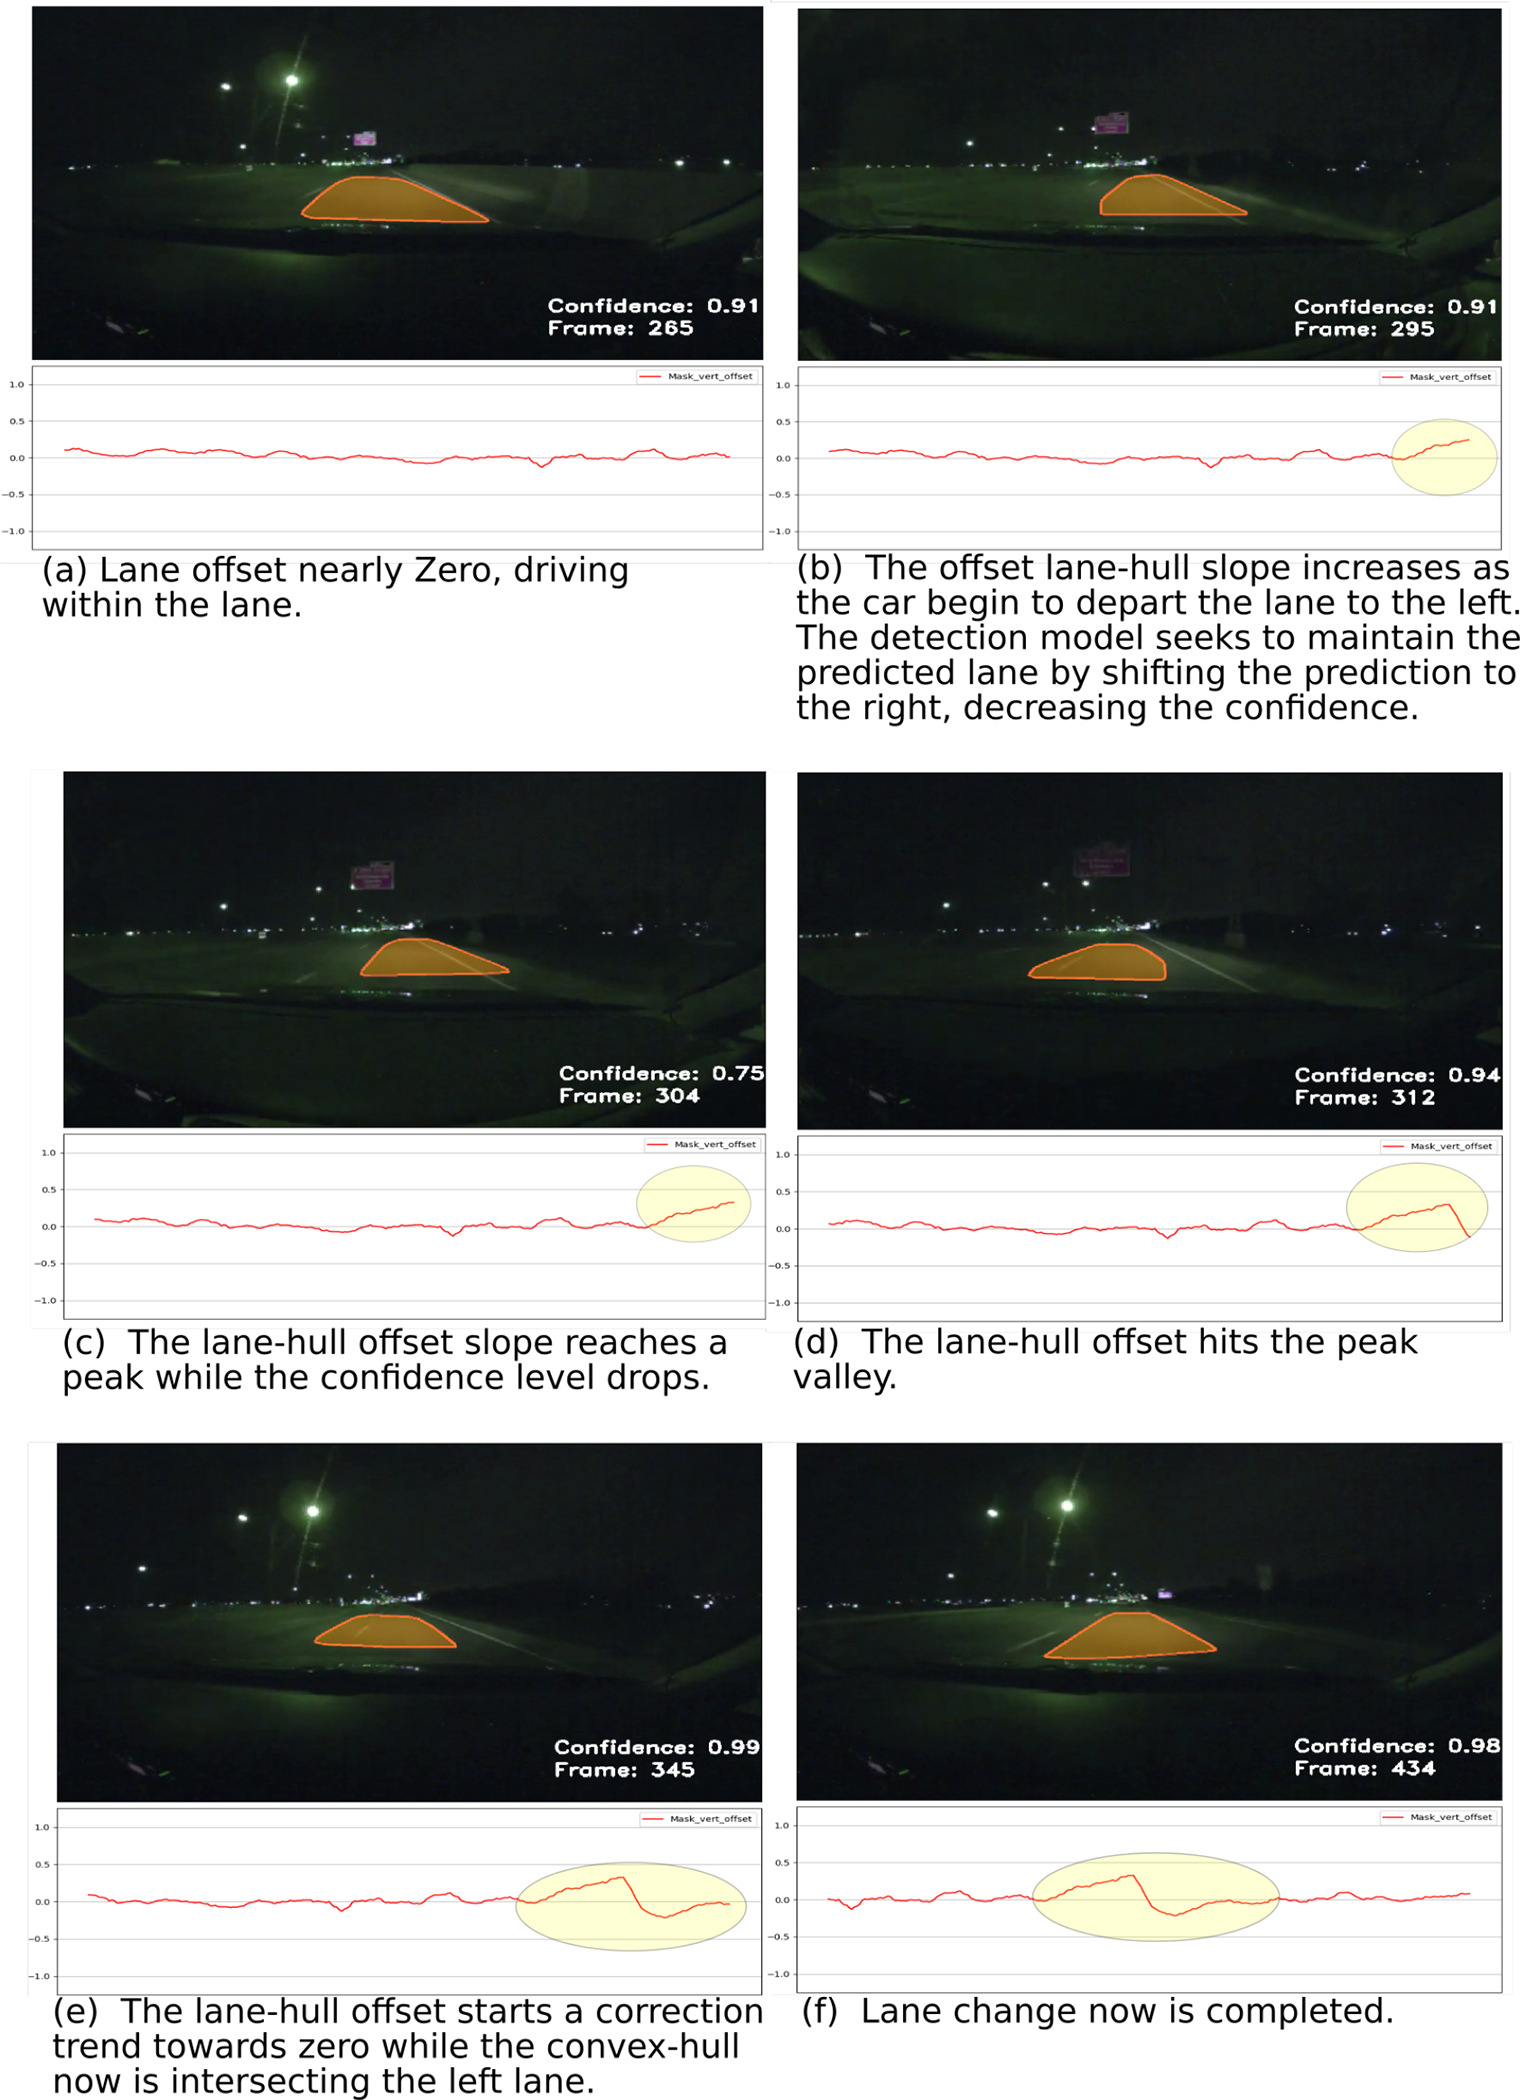
Sequential images of a lane change under extreme challenging condition.
algorithm 3.
2D QuickHull
| Input ← a set S(n points)) | ▷ at least 2 points in S |
| procedure QUICKHULL(S) | ▷ Gets convex hull from S |
| ConvexHull ← {} | |
| foreach point in S do | |
| A ← left most point | |
| B ← right most point | |
| S1 ← points in S right to oriented line AB | |
| S2 ← points in S right to oriented line BA | |
| FindHull(S1,A,B) | |
| FindHull(S2,B,A) | |
| function FINDHULL(Sk,P,Q) ▷ Find points on hull from the set of point in S to the right of the line from P to Q | |
| foreach point in SK do | |
| C ← find farthest point from PQ | |
| S0 ← points inside triangle PCQ | |
| S1 ← points right side line PC | |
| S2 ← points right side line CQ | |
| FindHull(S1,P,C) | |
| FindHull(S2,C,Q) | |
| Out put ← ConvexHull |
A. Validation of the Pre-Processing Lane Detection Model
The mAP was calculated according to Eq. (3), where TP, FP, TN, and FN denote the true positive, false positive, true negative and false negative, respectively. We incorporated an intersection over union (IoU) criteria, where the IoU is calculated as per Eq. (2). The thresholds for in Eq. (3) was set to 0.5, this means that any predicted object is considered a TP if its’ IoU with respect to the ground truth is greater than 0.5. The overall segmentation detection mAP was 70% while formAP50 and mAP75 were 100%.
| (2) |
| (3) |
| (4) |
| (5) |
| (6) |
B. Lane Departure Algorithm Results
We examined the performance of the proposed lane departure algorithm using F1 score, precision, and recall. The F1 was calculates using Eq. 4, and measures the detection accuracy of the algorithm characterizing the balance between precision and sensitivity.
We used the algorithm to test for lane changes to the left, right, and lane incursions. Results are summarized in Table I. Results were limited by the small number of identified lane incursions in the test dataset. We detected two out of three incursions. TPs are interpreted as left or right lane departure events that were classified correctly. TNs were events where no lane departures occurred, and our algorithm also didn’t detect any departures. FP corresponds to a detected lane departures when no lane departure occurred. FNs are missed lane departure events. We found that the model was susceptible to offset noise during lane detection and the parameters used for peak detection algorithm, suggesting that it would be convenient to substitute the peak detection algorithm with a machine learning model for better generalization. While we mitigated the noise using smoothing techniques, a robust lane detection model is essential to increase the algorithm accuracy.
TABLE I.
Lane change detection results
| Description | Left | Right |
|---|---|---|
|
| ||
| True Positive (TP) | 9 | 18 |
| False Positive (FP) | 4 | 11 |
| False Negative (FN) | 2 | 4 |
|
| ||
| Precision | 69.23% | 62.07% |
| Recall (Sensitivity) | 81.82% | 81.82% |
| F1 | 75.00% | 70.59% |
VI. CONCLUSION
We developed a novel algorithm to track and discriminate lane departures, capable of detecting driver lane position, on challenging, low-resolution video recordings. Our model was trained to track lanes and achieved a lane departure event detection recall (sensitivity) of 0.82. Future investigations will expand our model to a broader variety of classes in the annotations, which will likely improve FP rates, and the use of segmented masks to detect lane types and improve the detection of lane departure events such as lane change and incursion. An area that should be further explored is the use of horizontal offset as a way to detect proximity, even when image perspectives are known to have a chirp effect as objects or information is compressed as it gets closer to the vanishing point. Also, using ML models such as Long Short Term Memory (LSTM) to detect peaks instead of a peak detection algorithm should provide an excellent possibility to improve the model along with data fusion using other Inertial Measurement Unit (IMU) sensors. While our implementation was performed using only pre-recorded videos, utilizing a convex hull centroid offset may permit real-time lane tracking while driving (e.g., vehicle automation). Our results support the feasibility and utility of applying DL models to advance driver safety assessments and interventions to preserve and improve safety in medically at-risk or aging populations.
ACKNOWLEDGMENT
We thank the Toyota Collaborative Safety Research Center and the National Institutes of Health for their support. We thank our research team at the University of Nebraska Medical Center’s Department of Neurological Science’s Mind Brain Health Labs and Division of Diabetes, Endocrinology, and Metabolism for coordinating this project. In particular, we thank Drs. Cyrus Desouza and Andjela Drincic for their intel-lectual contributions to this project. We also thank Michelle Nutting for annotating the our video data and Digital Artefacts (http://www.digitalartefacts.com) for collaboratively designing, building, and installing the instrumentation used to collect this data. The data used is not publicly available because it contains potentially sensitive information. Requests for the data set can be sent to the Mind Brain Health Labs (mbhl@unmc.edu).
This work was supported by Toyota Collaborative Safety Research Center and the National Institutes of Health (R01-AG017177).
REFERENCES
- [1].Truck V, “European accident research and safety report 2013,” Gothenburg, January, 2013. [Google Scholar]
- [2].U. D. of Transportation, “National motor vehicle crash causation survey, Tech. Rep. DOT HS 811 059, 2008. [Google Scholar]
- [3].D. o. T. U. Federal Highway Administration. (2018) Highway statistics 2017. [Online]. Available: https://www.fhwa.dot.gov/policyinformation/statistics/2017/ [Google Scholar]
- [4].C. for Disease Control, N. C. f. I. P. Prevention, and Control. Web-based injury statistics query and reporting system (wisqars). [Online]. Available: https://www.cdc.gov/injury/wisqars/
- [5].Cicchino JB, “Why have fatality rates among older drivers declined? the relative contributions of changes in survivability and crash involvement,” Accident Analysis & Prevention, vol. 83, pp. 67–73, 2015. [DOI] [PubMed] [Google Scholar]
- [6].C. for Disease Control and M. V. S. Prevention. (2020) Older adult drivers. [Online]. Available: https://www.cdc.gov/motorvehiclesafety/older_adult_drivers/index.html
- [7].Wang Z, Wang X, Zhao L, and Zhang G, “Vision-based lane departure detection using a stacked sparse autoencoder,” Mathematical Problems in Engineering, vol. 2018, 2018. [Google Scholar]
- [8].Paone J, Bolme D, Ferrell R, Aykac D, and Karnowski T, “Baseline face detection, head pose estimation, and coarse direction detection for facial data in the shrp2 naturalistic driving study,” in 2015 IEEE Intelligent Vehicles Symposium (IV). IEEE, 2015, pp. 174–179. [Google Scholar]
- [9].Wang S, Ott BR, and Luo G, “Detection of lane-change events in naturalistic driving videos,” International journal of pattern recognition and artificial intelligence, vol. 32, no. 10, p. 1850030, 2018. [DOI] [PMC free article] [PubMed] [Google Scholar]
- [10].Lee SE, Olsen EC, Wierwille WW, et al. , “A comprehensive examination of naturalistic lane-changes,” United States. National Highway Traffic Safety Administration, Tech. Rep, 2004. [Google Scholar]
- [11].Merickel J, High R, Dawson J, and Rizzo M, “Real-world risk exposure in older drivers with cognitive and visual dysfunction,” Traffic injury prevention, pp. 1–6, 2019. [DOI] [PMC free article] [PubMed] [Google Scholar]
- [12].Kim Z, “Robust lane detection and tracking in challenging scenarios,” IEEE Transactions on Intelligent Transportation Systems, vol. 9, no. 1, pp. 16–26, 2008. [Google Scholar]
- [13].Pomerleau DA, “Alvinn: An autonomous land vehicle in a neural network,” in Advances in neural information processing systems, 1989, pp. 305–313. [Google Scholar]
- [14].Girshick R, Donahue J, Darrell T, and Malik J, “Rich feature hierarchies for accurate object detection and semantic segmentation,” in Proceedings of the IEEE conference on computer vision and pattern recognition, 2014, pp. 580–587. [Google Scholar]
- [15].Ren S, He K, Girshick R, and Sun J, “Faster r-cnn: Towards real-time object detection with region proposal networks,” in Advances in neural information processing systems, 2015, pp. 91–99. [DOI] [PubMed] [Google Scholar]
- [16].Narote SP, Bhujbal PN, Narote AS, and Dhane DM, “A review of recent advances in lane detection and departure warning system,” Pattern Recognition, vol. 73, pp. 216–234, 2018. [Google Scholar]
- [17].Lee JW and Yi UK, “A lane-departure identification based on lbpe, hough transform, and linear regression,” Computer Vision and Image Understanding, vol. 99, no. 3, pp. 359–383, 2005. [Google Scholar]
- [18].Kim J and Lee M, “Robust lane detection based on convolutional neural network and random sample consensus,” in Neural Information Processing, Loo CK, Yap KS, Wong KW, Teoh A, and Huang K, Eds. Cham: Springer International Publishing, 2014, pp. 454–461. [Google Scholar]
- [19].Huval B, Wang T, Tandon S, Kiske J, Song W, Pazhayampallil J, Andriluka M, Rajpurkar P, Migimatsu T, Cheng-Yue R, et al. , “An empirical evaluation of deep learning on highway driving,” arXiv preprint arXiv:1504.01716, 2015. [Google Scholar]
- [20].Ozcan K, Velipasalar S, and Sharma A, “Traffic sign detection from lower-quality and noisy mobile videos,” in Proceedings of the 11th International Conference on Distributed Smart Cameras. ACM, 2017, pp. 15–20. [Google Scholar]
- [21].He B, Ai R, Yan Y, and Lang X, “Accurate and robust lane detection based on dual-view convolutional neutral network,” in 2016 IEEE Intelligent Vehicles Symposium (IV). IEEE, 2016, pp. 1041–1046. [Google Scholar]
- [22].Wang Z, Ren W, and Qiu Q, “Lanenet: Real-time lane detection networks for autonomous driving.” [Google Scholar]
- [23].Zou Q, Jiang H, Dai Q, Yue Y, Chen L, and Wang Q, “Robust lane detection from continuous driving scenes using deep neural networks,” arXiv preprint arXiv:1903.02193, 2019. [Google Scholar]
- [24].Brabandere BD, Gansbeke WV, Neven D, Proesmans M, and Gool LV, “End-to-end lane detection through differentiable least-squares fitting.” [Google Scholar]
- [25].Neven D, Brabandere BD, Georgoulis S, Proesmans M, and Gool LV, “Towards end-to-end lane detection: an instance segmentation approach.” [Google Scholar]
- [26].Wang W, Zhao D, Han W, and Xi J, “A learning-based approach for lane departure warning systems with a personalized driver model,” IEEE Transactions on Vehicular Technology, vol. 67, no. 10, pp. 9145–9157, 2018. [Google Scholar]
- [27].McCall JC and Trivedi MM, “Video-based lane estimation and tracking for driver assistance: survey, system, and evaluation,” IEEE Transactions on Intelligent Transportation Systems, vol. 7, no. 1, pp. 20–37, March 2006. [Google Scholar]
- [28].Mammar S, Glaser S, and Netto M, “Time to line crossing for lane departure avoidance: A theoretical study and an experimental setting,” IEEE Transactions on Intelligent Transportation Systems, vol. 7, no. 2, pp. 226–241, 2006. [Google Scholar]
- [29].Krajewski J, Sommer D, Trutschel U, Edwards D, and Golz M, “Steering wheel behavior based estimation of fatigue,” 2009. [Google Scholar]
- [30].Vitiello MV, “Sleep disorders and aging: understanding the causes,” The Journals of Gerontology Series A: Biological Sciences and Medical Sciences, vol. 52, no. 4, pp. M189–M191, 1997. [DOI] [PubMed] [Google Scholar]
- [31].Salvucci DD, Mandalia HM, Kuge N, and Yamamura T, “Lane-change detection using a computational driver model,” Human Factors, vol. 49, no. 3, pp. 532–542, 2007, pMID: 17552315. [Online]. Available: 10.1518/001872007X200157 [DOI] [PubMed] [Google Scholar]
- [32].Ferri CP, Prince M, Brayne C, Brodaty H, Fratiglioni L, Ganguli M, Hall K, Hasegawa K, Hendrie H, Huang Y, et al. , “Global prevalence of dementia: a delphi consensus study,” The lancet, vol. 366, no. 9503, pp. 2112–2117, 2005. [DOI] [PMC free article] [PubMed] [Google Scholar]
- [33].Abdulla W, “Mask r-cnn for object detection and instance segmentation on keras and tensorflow,” https://github.com/matterport/Mask_RCNN, 2017. [Google Scholar]
- [34].He K, Gkioxari G, Dollár P, and Girshick R, “Mask r-cnn,” in Proceedings of the IEEE international conference on computer vision, 2017, pp. 2961–2969. [Google Scholar]