Abstract
Objective:
Bioelectric slow waves (SWs) are a key regulator of gastrointestinal motility, and disordered SW activity has been linked to motility disorders. There is currently a lack of practical options for the acquisition of the 3D stomach geometry during research studies when medical imaging is challenging. Accurately recording the geometry of the stomach and co-registering electrode and sensor positions would provide context for in-vivo studies and aid the development of non-invasive methods of gastric SW assessment.
Methods:
A stomach geometry reconstruction method based on the localization of transmitting coils placed on the gastric serosa was developed. The positions and orientations of the coils, which represented boundary points and surface-normal vectors, were estimated using a magnetic source localization algorithm. Coil localization results were then used to generate surface models. The reconstruction method was evaluated against four 3D-printed anatomically realistic human stomach models and applied in a proof of concept in-vivo pig study.
Results:
Over ten repeated reconstructions, average Hausdorff distance and average surface-normal vector error values were 4.7±0.2 mm and 18.7±0.7° for the whole stomach, and 3.6±0.2 mm and 14.6±0.6° for the corpus. Furthermore, mean intra-array localization error was 1.4±1.1 mm for the benchtop experiment and 1.7±1.6 mm in-vivo.
Conclusion and Significance:
Results demonstrated that the proposed reconstruction method is accurate and feasible. The stomach models generated by this method, when co-registered with electrode and sensor positions, could enable the investigation and validation of novel inverse analysis techniques.
Keywords: Gastric slow waves, magnetogastrography, electrogastrography, functional gastric motility disorders, source localization, geometry reconstruction
I. INTRODUCTION
Rhythmic bioelectric events known as slow waves (SWs) are a key regulator of gastrointestinal (GI) motility because they coordinate the muscular contractions that mix and propel the contents of the GI tract [1]. Dysrhythmic SW activity has been linked to functional GI motility disorders including gastroparesis, chronic unexplained nausea and vomiting, and functional dyspepsia [2], [3]. Therefore, the identification of dysrhythmias is important for the diagnosis of functional GI motility disorders and could allow for early treatment stratification. However, the detection of dysrhythmias often requires the accurate spatio-temporal characterization of SW activity because dysrhythmias can occur within the normal SW frequency range and can be spatially complex [3], [4].
The measurement of bioelectric SWs from the serosal surface of the stomach using dense electrode arrays, termed high-resolution (HR) mapping, is the state-of-the-art method for recording SW propagation patterns [3], [5]. HR mapping has value in surgical and experimental settings, but it has limited utility as a routine diagnostic tool because it is highly invasive. SW potentials and the resultant magnetic fields (MFs) can also be recorded in the far-field as the electrogastrogram (EGG) using cutaneous electrodes and the magnetogastrogram (MGG) using superconducting quantum interference devices (SQUIDs) [6], [7]. MGG signals are less attenuated by the abdominal wall than EGG signals, and hence MGG may be more sensitive to sources that are located deeper within the torso [8]. EGG, on the other hand, is attractive because unlike MGG it does not require high-cost specialized hardware. Both modalities have been shown to be capable of assessing SW properties [6], [7], [9], [10].
Although the estimation of SW propagation velocity from both EGG and MGG has been demonstrated, most gastric source characterization methods only resolve aggregate activity or activity in the antrum that is in close proximity to the sensor array, and do not detect and separate multiple sources [6], [7], [10], [11]. The investigation of gastric electrophysiology and the development of source characterization methods is challenging, in part, because detailed anatomical and spatial information is often lacking due to the use of photography, hand-drawings, or x-ray imaging to document the recording sites [3], [12].
The co-registration of near and far-field SW data with subject anatomy would be of great value to computational modeling efforts. However, there is currently a lack of practical options for quantitatively recording electrode positions, sensor positions, and the stomach geometry during research studies. Although computer tomography (CT) and magnetic resonance imaging (MRI) are the standard methods of stomach geometry acquisition, performing CT or MRI concurrently with HR-mapping, EGG, and MGG is challenging [13]. Recording the stomach geometry concurrently with SW measurements is necessary for accurate co-registration because the position, orientation, and conformation of the stomach can change with digestion, body position, and weight gain.
The characterization of gastric source activity from non-invasive data is an ill-posed inverse problem because a unique solution does not exist. Bioelectric and biomagnetic inverse problems are commonly made tractable by restricting the solution using prior information. Inverse analysis techniques that use anatomically-based constraints are notable because they have been used successfully to localize brain sources, but are challenging to develop for gastric source localization due to the lack of accurate spatial information [14]. The lack of ground-truth SW data registered to the stomach geometry, in particular, has limited the development of anatomically constrained inverse methods because this data is necessary for validation [15].
Magnetic source localization has been used to monitor the position of anatomical landmarks and medical devices in multiple applications [16], [17]. This technology is particularly valuable for invasive procedures because the high permeability of body tissues to MFs means high localization accuracy can be maintained when visibility is impaired. One approach to position tracking via magnetic source localization is using a fixed array of magnetic sensors to measure the MFs generated by a magnetic source (e.g., permanent magnet, electromagnetic coil, or magnetic tracer particles) attached to the object or structural feature of interest. A source model can then be used to estimate the position and orientation of the magnetic source with respect to the sensor array. Notably, MF-based tracking systems are routinely used to register cranial anatomical landmarks to biomagnetic recordings of brain activity [18]–[20]. While using an active or passive magnetic source to generate magnetic fields is widely used method in magnetic source localization applications, using inducible sources is compelling because higher spatial and temporal resolutions can be achieved. Magnetic particle imaging is one of the emerging imaging modalities that exploits the ability of magnetic tracer particles to be magnetized by an external MF to determine their distribution within the body [21].
In this study, the feasibility of reconstructing the geometry of the stomach using the positions and orientations of serosal transmitting coils estimated using magnetic source localization was investigated. The proposed reconstruction method would contribute to investigations of gastric electrophysiology by providing anatomical references for SW measurements. The anatomical stomach models generated by this method, when co-registered with electrode and sensor positions, would provide ground-truth data that could be used to develop and validate novel inverse analysis techniques that could have clinical utility.
II. METHODS
An array of magnetoresistive sensors was used to record the MFs generated by transmitting coils, and the coils were then localized using an algorithm based on the magnetic dipole source model. A stomach geometry reconstruction method that used the estimated positions and orientations of transmitting coils placed on the gastric serosa was developed. The reconstruction method was evaluated in a benchtop experiment using 3D-printed anatomically realistic human stomach models and applied in a proof of concept in-vivo pig study. The accuracy and repeatability of coil localization and geometry reconstruction was then evaluated.
A. Magnetic Field Generation and Recording Systems
A MF recording system with nine magnetometers was developed. The three-axis HMC1053 magnetometer (Honeywell, Charlotte, NC, USA) was used because of its small size (7.37 × 7.37 × 2.79 mm), low noise density (50 nV· Hz2), wide sensing range (±0.6 mT), and Set/Reset strap. The sensor output signals were amplified with a gain of 100 (LM348, Texas Instruments Inc., Dallas, TX, USA) and transmitted to an ActiveTwo data-acquisition system (BioSemi, Amsterdam, Netherlands) operating at a sampling frequency of 4096 Hz. The ActiveTwo unit was modified for passive recording. A 2–4 A current pulse (2 μs pulse-width at 20 Hz) was also applied to the Set/Reset strap of the magnetometers to maintain a high sensitivity state. The sensors were mounted to the top side of an upside-down U-shaped acrylic frame, and were arranged in a 3 × 3 grid with a center-to-center spacing of 100 mm, as shown in Fig. 1(a).
Fig. 1.
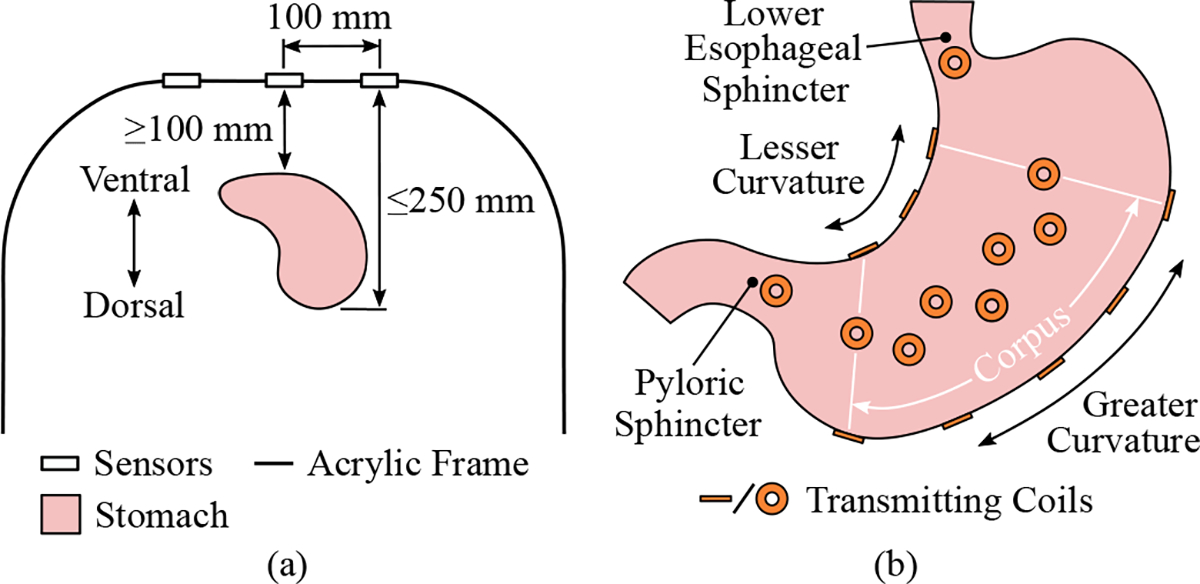
Experimental setup and protocol used for stomach geometry reconstruction. (a) A schematic showing the layout of the magnetic field recording system and the target placement of the stomach below the sensor array. (b) The placement of the transmitting coils are displayed on a simplified stomach.
MFs were generated by 2 mH circular transmitting coils constructed from 0.2 mm enamel-coated wire. The coils had 450 turns, respective inner and outer diameters of 8 mm and 19 mm, and an axial thickness of 3 mm. A 210 Hz sinusoidal signal was produced by a waveform generator using direct digital synthesis and was amplified by an audio amplifier (TPA3116D2, Texas Instruments Inc., Dallas, TX, USA) to produce a 25 V peak-to-peak signal. The supply of the amplified signal to the transmitting coils was coordinated by a demultiplexer constructed using solid-sate relays (TLP3555A, Toshiba, Tokyo, Japan) and a microcontroller.
Polyimide flexible printed circuits (FPCs) with a thickness of 0.23 mm were designed to host the transmitting coils to make their placement on the gastric serosa feasible. Linear arrays of three and five coils were designed for placement along the lesser and greater curvatures of the stomach, and an array of seven coils was designed for placement on the anterior and posterior surfaces of the organ, as shown in Fig. 1(b). Additional printed circuit boards for hosting single coils for placement at the proximal and distal ends of the stomach were also designed. When placed on the stomach, the coils lay flat against the organ so that their orientation approximates the surface-normal vectors of the underlying surface.
The MF data collection protocol involved the activation of each coil for 40 ms with a 10 ms delay between each coil activation. Once recorded, the MF data was first band-pass filtered (205–215 Hz) to isolate the transmitted signals, and the root-mean-square (RMS) for each transmission was computed to determine its magnitude.
B. Transmitting Coil Localization
The magnetic dipole model was used to localize the transmitting coils, and is defined as [16]:
| (1) |
where is the magnetic flux density, is a vector from the sensor to the center of the source , is the orientation of the dipole, is the relative permeability of the medium, is the magnetic permeability of free space, is the magnetic moment constant, is a unit vector, and ∥ · ∥ is the Euclidean norm.
A cost function was defined to quantify the difference between the measured and computed MFs for all sensors:
| (2) |
where and are measured and forward computed MFs at the -th sensor. The position and orientation of each coil was then estimated by minimizing using a hybrid approach where an initial solution found through particle swarm optimization was refined using the interior point method in MATLAB R2021b (MathWorks Inc, Natick, MA, USA) [22], [23].
The estimated coil positions were projected towards the stomach surface along the estimated dipole orientations by half of the thickness of the coils and by the entire thickness of the FPCs so that would theoretically represent the stomach surface rather than the center of the coil.
C. Geometry Reconstruction
Nodes defined from a subset of the estimated coil positions were used to construct an initial surface mesh. First, a longitudinal loop around the stomach was formed by fitting a cubic spline to the coil positions on the lesser and greater curvatures and at the proximal and distal ends of the stomach using the MATLAB R2021b function cscvn (Fig. 2(a)) [24]. Next, additional nodes, termed interpolated nodes, were added by evaluating the spline at points along the lesser curvature and points flanking the single coils. Inter-curvature circles representing the circumference of the stomach were then formed between pairs of nodes on the lesser curvature and the greater curvature. The inter-curvature circles were bridged by 4 uniformly spaced longitudinal splines to form a wireframe, which was used to construct an enclosed cubic Hermite surface mesh [25] termed the initial surface mesh (Fig. 2(b)).
Fig. 2.
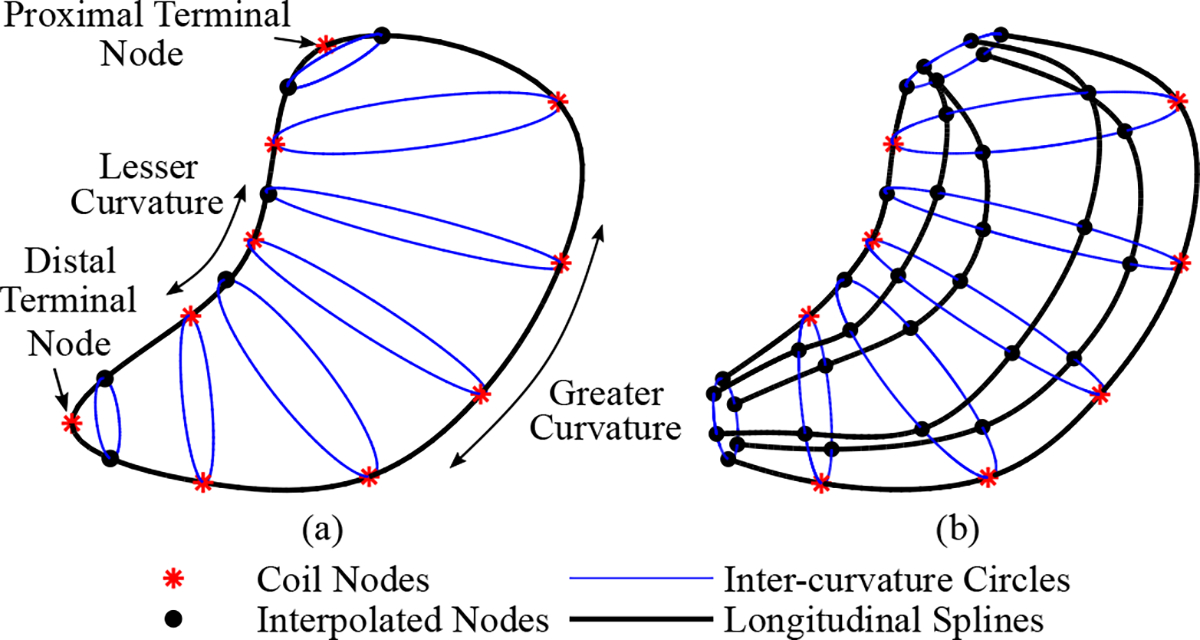
Construction of the initial surface mesh. (a) A longitudinal loop around the stomach was first created by fitting a spline to coil positions (nodes) on the greater and lesser curvatures, as well as the positions of the single coils at the proximal and distal ends on the stomach. Interpolated nodes were added by evaluating the spline at points along the lesser curvature and points flanking the terminal nodes. Inter-curvature circles were created by pairing the nodes on the greater and lesser curvature. (b) Four uniformly spaced longitudinal splines were used to bridge the inter-curvature circles and to form an enclosed surface mesh.
The initial surface mesh was then fit to the estimated positions and orientations of the 24 localized coils. First, the coil positions were projected onto the surface mesh by finding the closest mesh location for each coil position:
| (3) |
where is the projected mesh location and is the coordinates for the -th coil position, and are the coordinates for locations on the initial surface mesh .
Next, the Newton solver implemented in the Opt++ suite of nonlinear optimization methods [26] was used to solve an objective function within the open-source modelling tool CMGUI (www.cmiss.org/cmgui). The objective function was defined as follows:
| (4) |
where is a function that compares the positions and orientations of the localized coils with the coordinates of the projected mesh locations and the surface-normal vectors at these locations, is a function that penalizes the deformation of the initial surface mesh to prevent over-fitting to the coil positions and to preserve curvature, and and are weights. The functions and are defined as:
| (5) |
| (6) |
where is the total number of coils, is updated coordinates of , is the orientation vector of the -th coil, is the surface-normal vector at , and are the original and updated coordinates of locations on the mesh, is the gradient operator, and and are weights.
D. Experimental Validation
The geometry reconstruction method was first applied in a benchtop experiment involving 3D-printed stomach models because ground-truth knowledge of the stomach geometries used to construct the models enabled the quantitative assessment of accuracy and repeatability. A proof of concept pig study was then performed to determine in-vivo feasibility.
1). Benchtop Experiment:
Four anatomically realistic human stomach geometries that represented a range of stomach size and anatomy were used in this experiment. These geometries were previously reconstructed from CT images of healthy volunteers [27]. Data collection was approved by the Committee for the Protection of Human Subjects at Vanderbilt University, and informed consent was obtained.
To approximate in-vivo studies, the four stomach models were 3D-printed at a 1:1 scale with a rectangular base that fixed the orientation of the model to be the same as an individual lying in a supine position (MakerBot, New York, NY, USA). The FPC coil arrays used for the benchtop experiment are shown in Fig. 3(a). The center-to-center coil spacing for the anterior and posterior stomach, greater curvature, and lesser curvature arrays were 30 mm, 55 mm, and 35 mm, respectively. All FPC coil arrays and the two single coils, which together contained a total of 24 transmitting coils, were placed on the stomach models. The stomach models were then centered beneath the sensor array within the target feasible range of 100–250 mm below the sensors as shown in Fig. 1(a) and registered with the MF recording system via the rectangular base. The MF data collection protocol was as described in Section II-A.
Fig. 3.
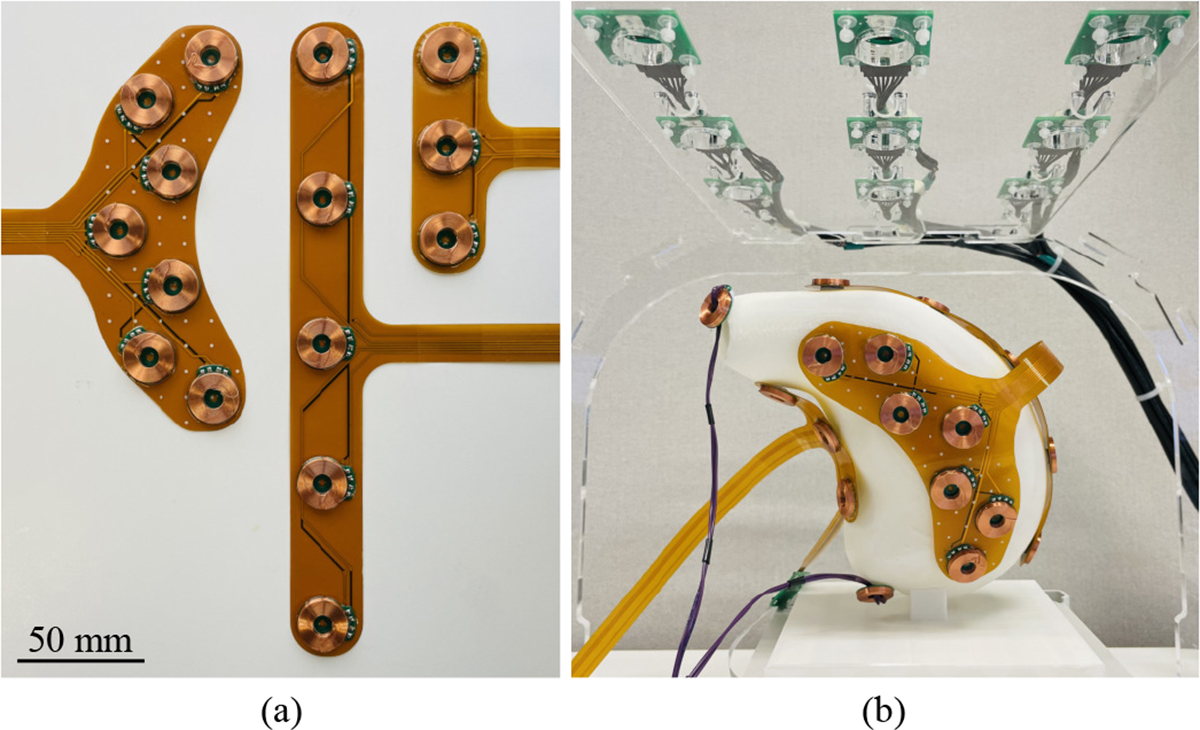
Benchtop experimental setup. (a) The coil arrays constructed using flexible printed circuits for (left) the anterior and posterior stomach, (middle) the greater curvature, and (right) the lesser curvature are shown. (b) A photograph of the benchtop experimental setup showing the placement of the transmitting coils on a 3D-printed stomach model positioned below the sensor array.
Suitable weight values for the geometry fitting procedure were then identified using data collected for a single geometry. The values of and were initially set to zero, and a parameter sweep was performed for the ratio using the average Hausdorff distance and average normal vector error as metrics described in Section II-E. Using the optimum ratio from the sweep, the value of was increased until the difference between coil orientations and surface normal vectors at mesh locations closest to coil positions was ≤ 10°, and the value of was increased until the change in the average geometric curvature due to the fitting procedure was ≤ 10%. Curvature was computed as defined in [28]. The parameter sweep was then repeated using the updated and values to find an updated optimum ratio. Finally, the achievement of the targets was reassessed and and were updated if required.
The geometry reconstruction method was repeated ten times for each stomach model using independently recorded MF data, and the coil arrays were removed and repositioned between each repetition. Finally, the reconstructed and ground-truth meshes were discretized using approximately 70,000 points to enable their comparison.
2). In-Vivo Experiment:
Ethical approval was provided by the University of Auckland Animal Ethics Committee. The in-vivo experiment was performed on a 43.3 kg anesthetized, overnight-fasted, female, crossbreed, weaner pig. This animal was part of a larger gastric HR mapping study, and animal care was as previously described [29]. The gastric serosal surface was exposed through midline laparotomy and all coil arrays were placed on the stomach. The midline incision was clamped closed and the MF data collection protocol and surface fitting parameters values were the same as in the benchtop experiment. The single coil markers were placed at the lower esophageal and pyloric sphincters during this experiment. The animal was euthanized with a bolus injection of pentobarbital sodium while still under anesthesia after the conclusion of the experiment.
E. Evaluation
1). Coil Localization Error:
Coil localization performance was first evaluated by computing the error in the Euclidean distance between neighboring coils within coil arrays. This intra-array localization error metric was computed for the posterior and anterior arrays because the limited deformation that they experienced allowed the known coil locations within each array to be used as the ground-truth.
The distances separating the estimated coil positions and the ground-truth surfaces was also computed using Point-to-Surface Error (P2SE), which was defined as the minimum Euclidean distance between a point and a surface :
| (7) |
The angles between the estimated coil orientations and the surface-normal vectors at positions on the ground-truth surface nearest to the coil positions, termed Normal-Vector-Error (NVE), were also calculated.
2). Geometry Reconstruction Error:
The reconstructed surfaces were compared against the ground-truth surfaces using the Average Hausdorff Distance (AHD) and the 95% Hausdorff Distance (95HD) metrics that compare spatial separation. AHD was computed using [30]:
| (8) |
where for a surface composed of points compared against a second surface is given by:
| (9) |
Similarly, 95HD was computed from:
| (10) |
where is the 95th ranked percentile for the set of distances:
| (11) |
NVE was also calculated for minimally separated points on the reconstructed and ground-truth surfaces for both the to and the to directions. Similar to the Hausdorff Distance metrics, the Average Normal Vector Error (ANVE) and 95th percentile Normal Vector Error (95NVE) were computed by taking the maximum of the forward and backward comparisons.
Reconstruction error over the repetitions was reported using mean and standard deviation. Results were also reported separately for the full stomach and the corpus, which was defined as the region bordered by the coil positions along the lesser curvature and greater curvature (Fig. 1(b)).
III. RESULTS
A. Benchtop Coil Localization
The localized coil positions for all repetitions performed during the benchtop experiment were in the range of 101.6–249.2 mm below the sensor array, as shown in Fig. 4. The mean P2SE and NVE for the localized coils across all stomachs and repetitions were 2.2 ± 1.7 mm and 10.6 ± 6.8°, respectively. P2SE and NVE were relatively higher in regions with higher curvature, especially on the lesser curvature. Linear regressions of both P2SE and NVE against the distance between the coils and the sensor plane did not exhibit strong trends, indicating that localization error was relatively stable in this range. Furthermore, the average error for the distance between neighboring localized coil positions within the anterior and posterior coil arrays over all repetitions was 1.4 ± 1.1 mm.
Fig. 4.
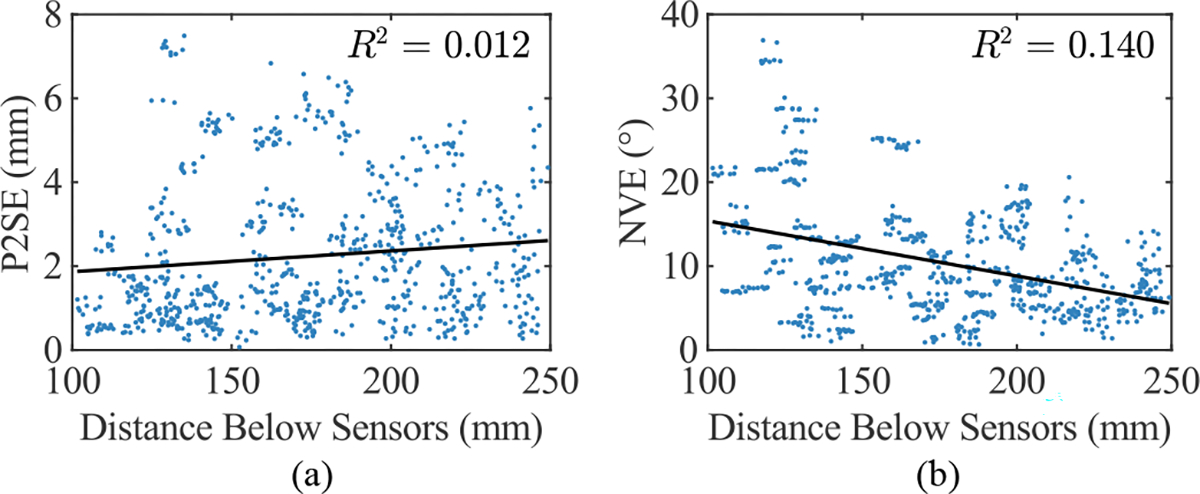
Coil localization error against distance below the sensor plane for all stomachs and repetitions. (a) Point-to-Surface Error (P2SE) and (b) Normal-Vector Error (NVE) are both presented, and linear regressions of these error metrics and the associated R2 values are also shown.
B. Benchtop Geometry Reconstruction
The and values that met the selection criteria were 25 and 1000, respectively, and the optimum ratio from the parameter sweep performed using these parameter values was 0.01 (Fig. 5). Representative reconstructions for the four stomach models compared against the ground-truth are presented in Fig. 6. As a result of the fitting procedure, the reconstructed surfaces were approximately coincident with the coil positions and were approximately perpendicular to the orientations of the coils at these locations (Fig. 6(b)). Furthermore, the reconstructed meshes maintained smooth curvature between coil locations. Although, the lesser curvature in the reconstructions was often simplified and smoothed compared to the ground truth because the smaller radius curves within this region were not able to be reproduced using the limited number of points that were collected.
Fig. 5.
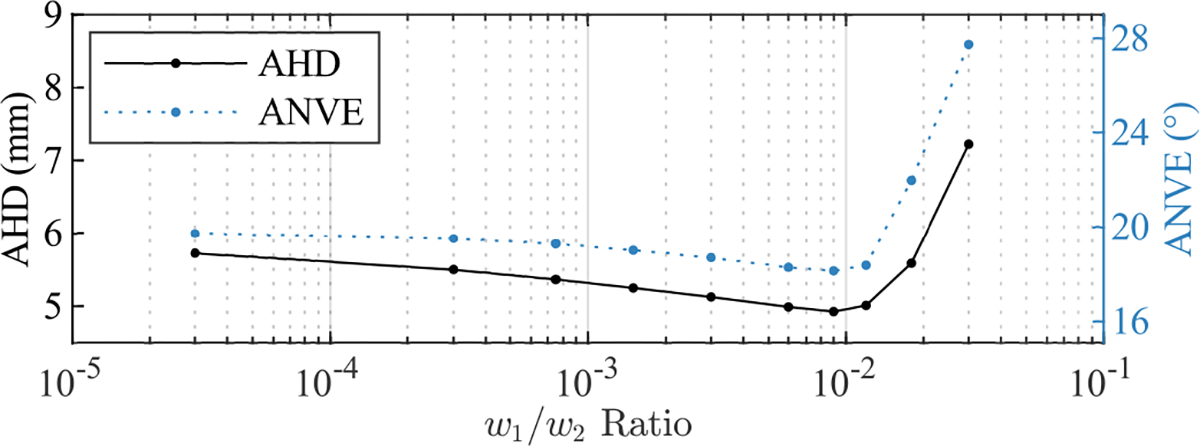
Parameter sweep for the ratio using the final values of (25) and (1000), where the performance metrics were the Average Hausdorff Distance (AHD) and Average surface-Normal Vector Error (ANVE).
Fig. 6.
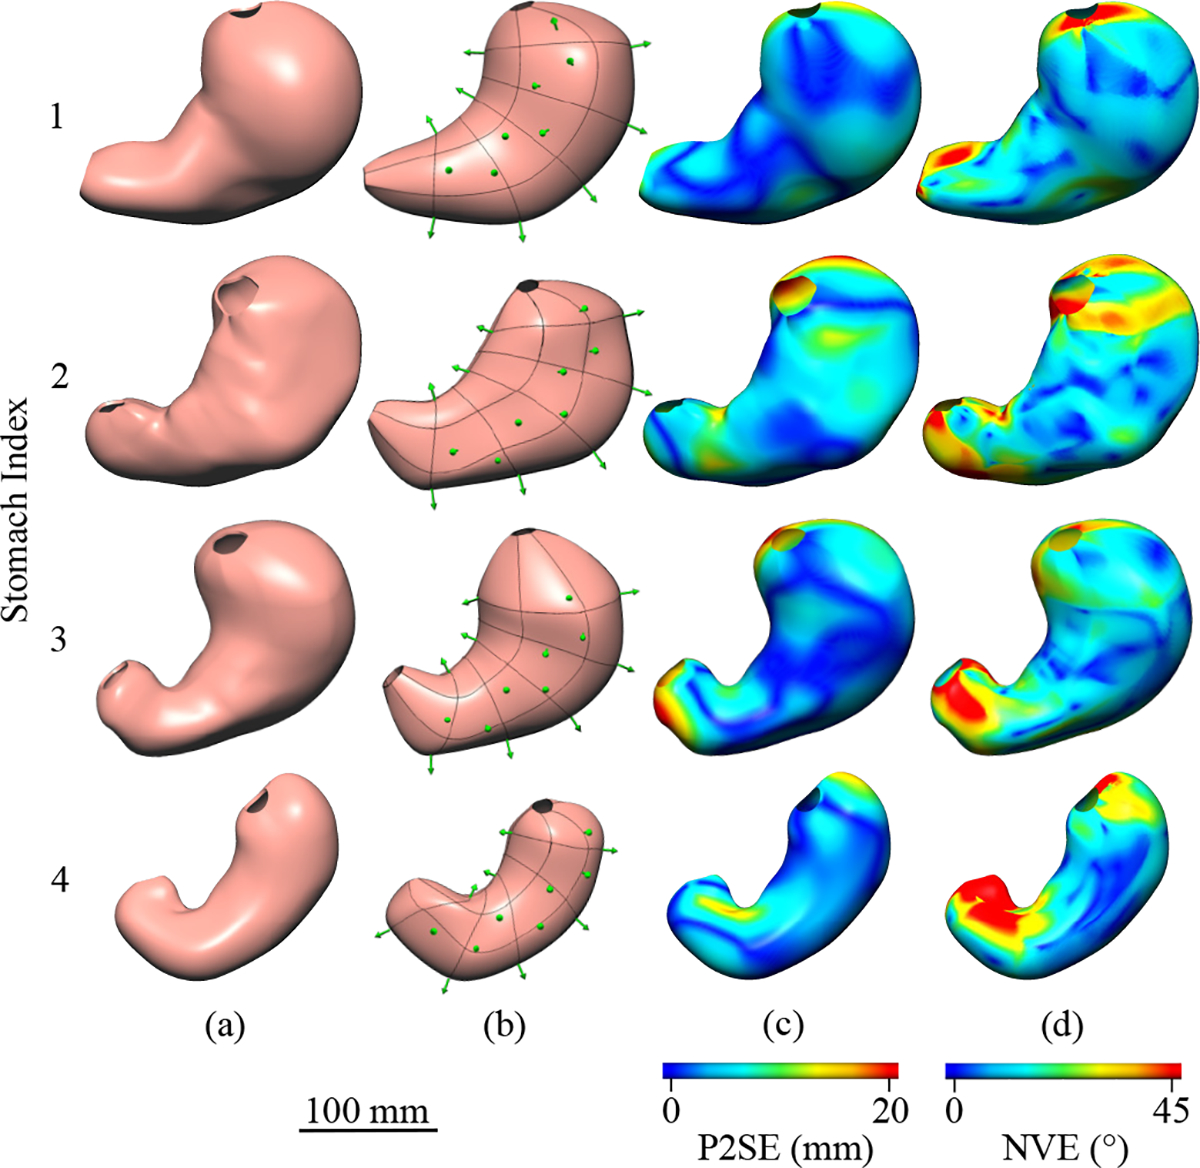
Anterior views of (a) the ground truth and (b) a representative reconstruction are presented for each human stomach model. The reconstructed geometries are shown with the localized coil positions and orientations shown as green arrows, where the coil location is at the base of the arrow. Heat-maps of (c) Point-to-Surface Error (P2SE) and (d) Normal Vector Error (NVE) are displayed on the ground-truth models.
The distance from the ground-truth surfaces to the reconstructed surfaces, as measured by P2SE, was consistently higher in the fundus and antrum compared to the corpus for all stomachs, as shown in Fig. 6(c). For example, P2SE for Stomach 3 was less than 3.0 mm for the majority of the corpus, but rose to a maximum of 23.0 mm within the fundus. P2SE was also elevated on sections of the lesser curvature that had higher curvature, and this was particularly evident for Stomach 2 and Stomach 4.
Over the 10 repeated reconstructions of each stomach the mean AHD value for the corpus was lower compared to the full stomach, however, the difference was relatively small for Stomach 4 (Fig. 7(a)). The pooled mean values across all repetitions and stomachs was 3.6±0.2 mm and 4.7±0.2 mm, respectively. The pooled 95HD values were 9.0±0.5 mm for the corpus and 14.3±0.7 mm for the full stomach, demonstrating that the largest error values were consistently lower in the corpus compared to the fundus and antrum (Fig. 7(b)).
Fig. 7.
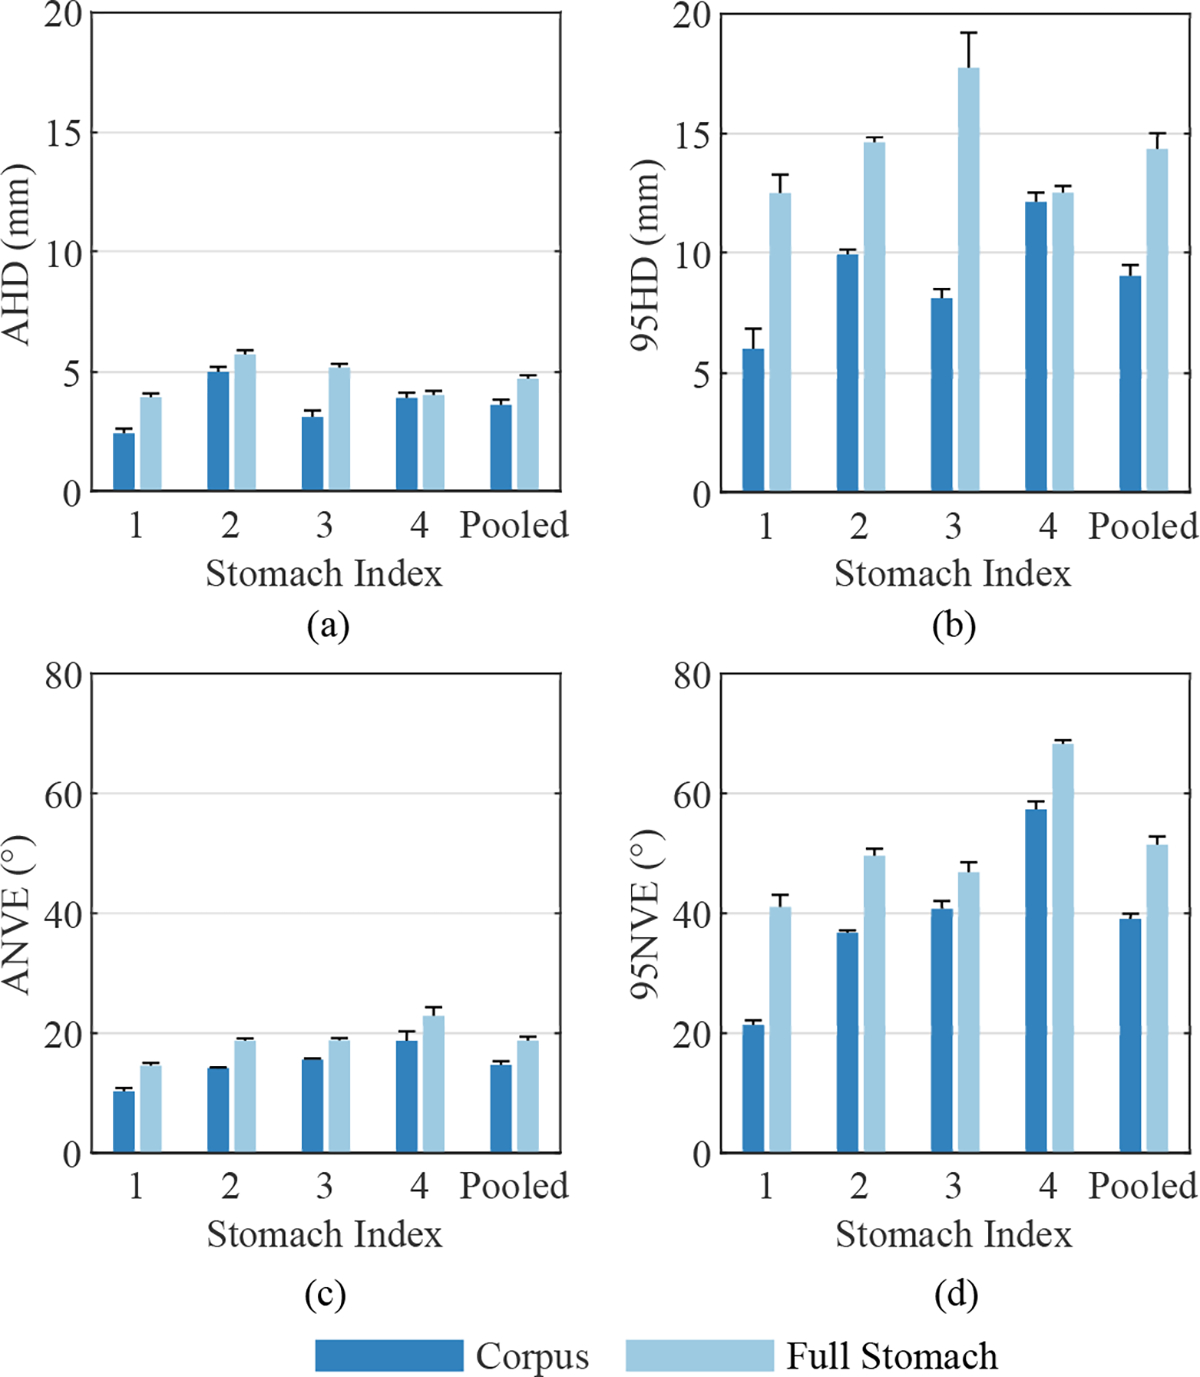
Mean reconstruction error for each stomach geometry over 10 repetitions, where error bars represent standard deviations. (a) Average Hausdorff Distance (AHD) and (b) 95th percentile Hausdorf Distance (95HD) values are presented, as well as (c) Average surface-Normal Vector Error (ANVE) and (d) 95th percentile surface-Normal Vector Error (95NVE). Results are shown for both the corpus and full stomach.
The angle between surface-normal vectors at minimally separated locations on the ground-truth and reconstructed surfaces had a similar spatial distribution compared to P2SE (Fig. 6(d)). NVE was consistently lowest within the corpus near coil locations for all stomachs. NVE was often largest in the proximal fundus and distal antrum where no coils were located to define boundaries and govern the orientation of the surface. As shown in Fig. 6(d), NVE occasionally exceeded 40° in small localized patches in all stomachs, which were often located in the antrum. The pooled mean ANVE values across all stomachs and repetitions were 14.6 ± 0.6° for the corpus and 18.7 ± 0.7° for the full stomach (Fig. 7(c)). Furthermore, the pooled mean 95NVE values where 39.0 ± 0.9° for the corpus and 51.4 ± 1.4° for the full stomach (Fig. 7(d)).
C. In-Vivo Experiment
The coil positions for the in-vivo experiment were estimated to be 110.2–197.7 mm below the sensor array. Fig. 8(a) shows the placement of the coil arrays on the gastric serosa viewed from the midline incision, where two of the five coils in the greater curvature array and two of the seven coils in the anterior coil array can be identified. The posterior view of the reconstructed stomach geometry of the pig subject is shown in Fig. 8(b) with the approximate field of view of the photograph in Fig. 8(a) labelled. The mean error for the distance between neighboring localized coil positions within the anterior and posterior coil arrays was 1.7 ± 1.6 mm.
Fig. 8.
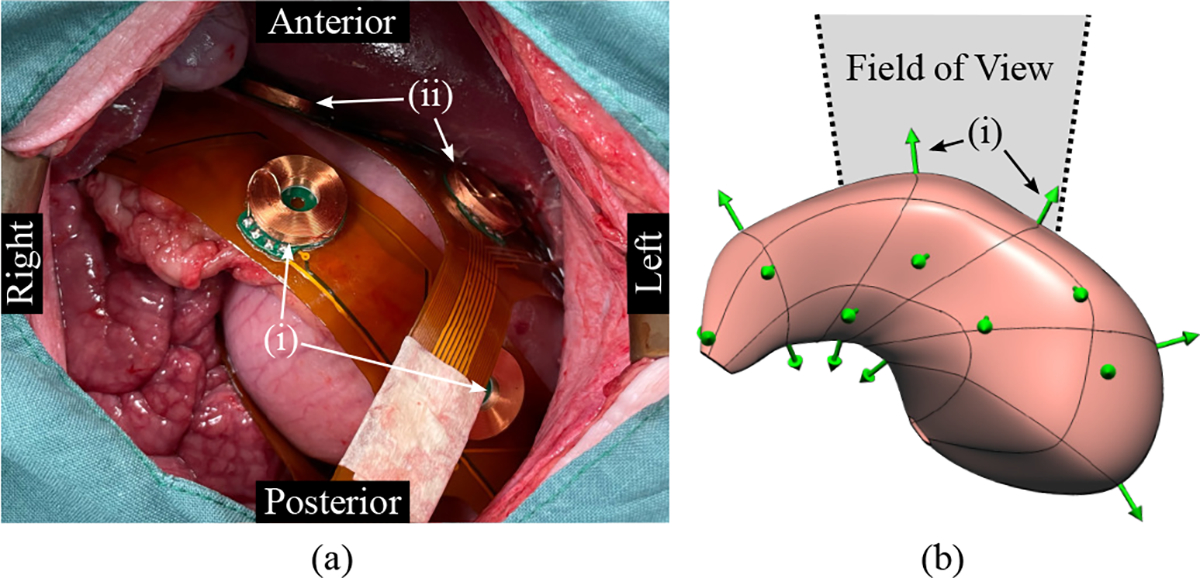
In-vivo experiment results. (a) The placement of the coil arrays on the stomach of the pig subject as viewed from the midline incision is shown. (i) Two of the five coils placed on the greater curvature and (ii) two of the seven coil placed on the anterior stomach can be identified. (b) The posterior view of the reconstructed stomach geometry is also presented with the localized coil positions and orientations shown as green arrows, where the coil location is at the base of the arrow. The approximate field of view of the photograph is also labelled.
IV. DISCUSSION
In this study, a stomach geometry reconstruction method was evaluated using 3D-printed anatomically realistic human stomach models and applied in a proof of concept in-vivo study on an anesthetized pig. Transmitting coils placed on the serosal surface of the stomach models were used to generate MFs, and their positions and orientations were estimated using a magnetic source localization algorithm and used to reconstruct the stomach geometries. The accuracy and repeatability of coil localization and geometry reconstruction was then evaluated.
Coil localization error was shown to be relatively stable within the target feasible range of 100–250 mm below the sensor array. The target separation between the sensors and the stomach was achieved during the in-vivo experiment and is feasible because the mean combined thickness of abdominal rectus muscle and subcutaneous fat is 34.1 ± 8.2 mm for adult humans, and the fact that this region is typically thinner in the young pigs used for experimental studies [31], [32]. This suggests that the demonstrated level of localization accuracy is achievable for a broad range of human and pig subjects.
The reconstruction method was able to produce relatively accurate geometries using only 24 coils because coil orientation in addition to coil position was used in the surface fitting procedure. This compensated for the sparse layout of the coils because the coil orientation largely determined the surface-normal vectors at coil locations. The use of the displacement and displacement gradient penalties in the surface fitting procedure was also able to avoid overfitting to the sparse data because it maintained the smooth curvature from the initial surface meshes.
Reconstruction accuracy was relatively similar across the range of stomachs tested, however, accuracy was higher for stomachs regions with smoother curvature. This may be due in part to the sampled boundary points and surface-orientations at coil locations being less representative of the local region when surface curvature was more complex. Furthermore, the flexible FPCs were not able to conform to the curvature of the stomach in certain regions, especially along the lesser curvature, and this reduced the accuracy of the position and normal vector estimates in these regions. Contact between the coil arrays and the gastric serosa in-vivo would likely be improved compared to the 3D-printed models because the stomach wall is compliant.
The lack of ground-truth information for the pig study meant that geometry reconstructed error could not be computed for the in-vivo experiment. However, the relative similarity of intra-array coil localization error for the benchtop and in-vivo experiments suggests that body tissues did not have a significant impact on localization performance. This result is expected because body tissues have a high permeability to MFs and MF-based tracking systems have been shown to maintain their accuracy when used within the body [17], [33]. Additionally, geometry reconstruction accuracy is likely to be similar for human and pig stomachs because the anatomy and size of the pig stomach is similar to that of adult humans when the animal is young [34]. The pig stomach is a common animal model for GI investigations and is therefore the most likely type of subject on which this reconstruction method would be applied [5], [35], [36].
The proposed geometry reconstruction method provides an option for quantitatively recording the placement of electrodes and sensors relative to the anatomy of the stomach in a subject specific manner. Although CT and MRI can be used to produce geometric models with sub-millimeter accuracy [37], unlike the proposed method, both of these modalities are challenging to use during invasive research studies and are both incompatible with MGG. Recording geometric information concurrently with SW recordings is essential for the accurate co-registration of electrode and sensor positions, which can be recorded by this system through the use of additional transmitting coils. Additionally, this approach could also improve the localization of medical devices (e.g. ablation catheters, pacing electrodes, endoscopic measurement devices etc.) with respect to the stomach geometry [36], [38]–[40]. This is significant as localization uncertainty has been noted as a limiting factor in gastric electrophysiological mapping studies. Furthermore, the SQUID sensors used to record MGG could also be used to record the signals generated by the transmitting coils. This means that an additional MF recording system may not be necessary to perform the developed method during MGG studies [6], [41]. However, the method may need to be applied before or after MGG recordings to avoid interference and the source generation and localization systems would need to be updated to work with SQUIDs instead of magnetoresistive sensors.
The registration of bioelectric and biomagnetic data to anatomical structures is routinely performed during studies focused on recording brain source activity. In these studies, commercial MF-based position tracking systems are used to record the position of electrodes and markers placed on the scalp, and separately recorded MRI or CT scans are used to acquire geometric models [19], [42]. Recording anatomical geometries separately to other measurements is a feasible approach for brain studies because the skull prevents substantial configuration change between the time of bioelectric/biomagnetic measurements and imaging. However, the stomach can shift and deform, especially as the abdominal cavity is accessed and electrode arrays are inserted [5]. Additionally, the stomach can undergo large volume changes during a meal, and it is desirable to monitor gastric electrophysiology during this time because these volume changes are often associated with the onset of symptoms [43]. Therefore, the acquisition of subject anatomy concurrently with other measurements is required for accurate reconstructions and co-registration with electrodes and sensors.
The quantitative co-registration of spatial information during research studies would enhance the development of relationships between non-invasive modalities and the underlying SW activity, and in particular would enable the investigation of source analysis methods developed for the brain that use anatomically-informed constraints to enhance performance [14], [44]. The use of anatomically constrained inverse methods to characterize gastric sources has been investigated, but the lack of ground-truth SW data registered to the stomach geometry has limited what can be achieved [15]. The reconstruction method developed in this study would contribute to investigations of gastric electrophysiology by providing anatomical references for SW measurements. The anatomical stomach models generated by this method, when co-registered with electrode and sensor positions, would provide ground-truth data that could be used to develop and validate novel inverse analysis techniques, which can be translated to a clinical setting where less invasive methods of acquiring the stomach geometry such as endoscopy and 3D ultrasound could be used [45]–[47].
Despite the evidence supporting the accuracy and feasibility of the developed stomach geometry reconstruction method, there are several limitations worth noting. Firstly, the parameter search for the surface fitting procedure was not conducted entirely within CMGUI because of the constraints of the programming environment but was instead carried out across both CMGUI and MATLAB. The computational cost and complexity of this implementation restricted the scope of the parameter search and meant that global optimum values may not have been identified. However, and values were selected based on targets ensuring that the penalties they were associated with were substantially constraining the solution. The implementation of the parameter search procedure in a more versatile low-level programming environment may enable the global optimization of parameter values. Additionally, the robustness of the fitting procedure may be limited because the parameters were selected using a single geometry.
Each magnetic source was generated by a single transmitting coil to simplify both the control hardware and the source localization problem. However, multiple coils could be combined in the future for more accurate and stable source localization. The distribution of the coils also meant that AHD and ANVE values were lower for the corpus compared to the fundus and antrum. Reconstruction error could be reduced within the proximal and distal stomach through the use of more or larger FPCs that put additional coils within these regions, however, it may be challenging for more complex coil arrays to conform to the shape and size of different stomachs.
Error could also be reduced over the entire reconstruction using a denser layout of smaller coils, which could be achieved by reducing the coil size. However, the applied current would need to be increased or alternative sensors with higher sensitivity could be used to compensate and maintain the SNR and coil localization accuracy. It is also important to note that reconstruction error in the fundus region would be unlikely to affect research efforts focused on SW activity because the fundus does not exhibit SWs [12]. A further limitation of this study is that the impact of respiratory motion artifacts was also not captured. Although the sequential activation and deactivation of all of the coils took 1.2 s, the operation time and therefore the robustness of the system against motion artifacts could be improved by increasing the MF recording frequency and decreasing the pulse width or through the simultaneous activation of multiple coils at different frequencies.
V. CONCLUSION
This study presents a novel method for acquiring the geometry of the stomach during research studies, for which there is currently a lack of practical options. The proposed reconstruction method produces accurate reconstructions using transmitting coils placed on the serosal surface of the stomach to estimate both boundary points and surface-normal vectors. Furthermore, this method can be extended using additional transmitting coils to register the location of electrodes and sensors relative to the acquired stomach geometry, and these co-registered data has the potential to aid the investigation of gastric electrophysiology.
Acknowledgments
The research was supported in part by the National Institutes of Health (R01 088662), the Marsden Fund Council of New Zealand, the Health Research Council of New Zealand, the Auckland Bioengineering Institute, and the University of Auckland Faculty Research Development Fund. CEE was supported by a University of Auckland Doctoral Scholarship. PD and TRA-G were supported by Rutherford Discovery Fellowships from the Royal Society Te Apārangi.
Contributor Information
Chad E. Drake, Auckland Bioengineering Institute, University of Auckland, Auckland, New Zealand.
Leo K. Cheng, Auckland Bioengineering Institute, University of Auckland, Auckland, New Zealand. Department of Surgery, Vanderbilt University, TN, USA.
Niranchan Paskaranandavadivel, Auckland Bioengineering Institute, University of Auckland, Auckland, New Zealand..
Saeed Alighaleh, Auckland Bioengineering Institute, University of Auckland, Auckland, New Zealand..
Timothy R. Angeli-Gordon, Auckland Bioengineering Institute, University of Auckland, Auckland, New Zealand.
Peng Du, Auckland Bioengineering Institute, University of Auckland, Auckland, New Zealand..
Leonard A. Bradshaw, Department of Surgery, Vanderbilt University, TN, USA.
Recep Avci, Auckland Bioengineering Institute, University of Auckland, Auckland, New Zealand..
REFERENCES
- [1].Farrugia G, “Interstitial cells of Cajal in health and disease,” Neurogastroenterol. Motil, vol. 20, no. SUPPL. 1, pp. 54–63, 2008. [DOI] [PubMed] [Google Scholar]
- [2].Gharibans AA, et al. , “Spatial Patterns From High-Resolution Electrogastrography Correlate With Severity of Symptoms in Patients With Functional Dyspepsia and Gastroparesis,” Clin. Gastroenterol. Hepatol, vol. 17, no. 13, pp. 2668–2677, 2019. [DOI] [PubMed] [Google Scholar]
- [3].Angeli TR, et al. , “Loss of Interstitial Cells of Cajal and Patterns of Gastric Dysrhythmia in Patients With Chronic Unexplained Nausea and Vomiting.” Gastroenterology, vol. 149, no. 1, pp. 56–66.e5, 2015. [DOI] [PMC free article] [PubMed] [Google Scholar]
- [4].Lammers WJ, et al. , “Focal Activities and Re-Entrant Propagations as Mechanisms of Gastric Tachyarrhythmias,” Gastroenterology, vol. 135, no. 5, pp. 1601–1611, 2008. [DOI] [PubMed] [Google Scholar]
- [5].O’Grady G, et al. , “Methods for High-Resolution Electrical Mapping in the Gastrointestinal Tract.” IEEE Rev. Biomed. Eng, vol. 12, pp. 287–302, 2019. [DOI] [PubMed] [Google Scholar]
- [6].Bradshaw LA, et al. , “Characterization of electrophysiological propagation by multichannel sensors,” IEEE Trans. Biomed. Eng, vol. 63, no. 8, pp. 1751–1759, 2016. [DOI] [PMC free article] [PubMed] [Google Scholar]
- [7].Gharibans AA, et al. , “High-Resolution Electrogastrogram: A Novel, Noninvasive Method for Determining Gastric Slow-Wave Direction and Speed,” IEEE Trans. Biomed. Eng, vol. 64, no. 4, pp. 807–815, 2017. [DOI] [PMC free article] [PubMed] [Google Scholar]
- [8].Bradshaw LA, et al. , “Volume conductor effects on the spatial resolution of magnetic fields and electric potentials from gastrointestinal electrical activity,” Med. Biol. Eng. Comput, vol. 39, no. 1, pp. 35–43, 2001. [DOI] [PubMed] [Google Scholar]
- [9].Mika B, et al. , “Assessment of slow wave propagation in multichannel electrogastrography by using noise-assisted multivariate empirical mode decomposition and cross-covariance analysis.” Comput. Biol. Med, vol. 100, pp. 305–315, 2018. [DOI] [PubMed] [Google Scholar]
- [10].Avci R, et al. , “Characterizing spatial signatures of gastric electrical activity using biomagnetic source localization.” IEEE Trans. Biomed. Eng, vol. PP, pp. 1–1, 2022. [DOI] [PMC free article] [PubMed] [Google Scholar]
- [11].Eichler CE, et al. , “Effects of magnetogastrography sensor configurations in tracking slow wave propagation.” Comput. Biol. Med, vol. 129, p. 104169, 2021. [DOI] [PMC free article] [PubMed] [Google Scholar]
- [12].Lammers WJEP, et al. , “Origin and propagation of the slow wave in the canine stomach: the outlines of a gastric conduction system.” Am. J. Physiol. Gastrointest. Liver Physiol, vol. 296, no. 6, pp. G1200–10, 2009. [DOI] [PubMed] [Google Scholar]
- [13].Gopirajah R and Anandharamakrishnan C, “Advancement of Imaging and Modeling Techniques for Understanding Gastric Physical Forces on Food,” Food Eng. Rev, vol. 8, no. 3, pp. 323–335, 2016. [Google Scholar]
- [14].Zorzos I, et al. , “Advances in Electrical Source Imaging: A Review of the Current Approaches, Applications and Challenges,” Signals, vol. 2, no. 3, pp. 378–391, 2021. [Google Scholar]
- [15].Allegra AB, et al. , “Bayesian inverse methods for spatiotemporal characterization of gastric electrical activity from cutaneous multi-electrode recordings,” PLoS One, vol. 14, no. 10, p. e0220315, 2019. [DOI] [PMC free article] [PubMed] [Google Scholar]
- [16].Sun Z, et al. , “A Non-invasive Real-time Localization System for Enhanced Efficacy in Nasogastric Intubation.” Ann. Biomed. Eng, vol. 43, no. 12, pp. 2941–52, 2015. [DOI] [PubMed] [Google Scholar]
- [17].Franz AM, et al. , “Electromagnetic tracking in medicine-A review of technology, validation, and applications,” IEEE Trans. Med. Imaging, vol. 33, no. 8, pp. 1702–1725, 2014. [DOI] [PubMed] [Google Scholar]
- [18].Little G, et al. , “Head movement compensation in real-time magnetoencephalographic recordings,” MethodsX, vol. 1, pp. 275–282, 2014. [DOI] [PMC free article] [PubMed] [Google Scholar]
- [19].Pfeiffer C, et al. , “Localizing on-scalp MEG sensors using an array of magnetic dipole coils,” PLoS One, vol. 13, no. 5, p. e0191111, 2018. [DOI] [PMC free article] [PubMed] [Google Scholar]
- [20].Cao F, et al. , “Co-registration Comparison of On-Scalp Magnetoencephalography and Magnetic Resonance Imaging.” Front. Neurosci, vol. 15, p. 706785, 2021. [DOI] [PMC free article] [PubMed] [Google Scholar]
- [21].Neumann A, et al. , “Recent developments in magnetic particle imaging,” J. Magn. Magn. Mater, vol. 550, p. 169037, 2022. [Google Scholar]
- [22].Poli R, et al. , “Particle swarm optimization,” Swarm Intell, vol. 1, no. 1, pp. 33–57, 2007. [Google Scholar]
- [23].Waltz RA, et al. , “An interior algorithm for nonlinear optimization that combines line search and trust region steps,” Math. Program, vol. 107, no. 3, pp. 391–408, 2006. [Google Scholar]
- [24].Lee ET, “Choosing nodes in parametric curve interpolation,” Comput. Des, vol. 21, no. 6, pp. 363–370, 1989. [Google Scholar]
- [25].Bradley CP, et al. , “Geometric modeling of the human torso using cubic hermite elements.” Ann. Biomed. Eng, vol. 25, no. 1, pp. 96–111, 1997. [DOI] [PubMed] [Google Scholar]
- [26].Meza JC, et al. , “OPT++,” ACM Trans. Math. Softw, vol. 33, no. 2, p. 12, 2007. [Google Scholar]
- [27].Komuro R, et al. , “Comparison and analysis of inter-subject variability of simulated magnetic activity generated from gastric electrical activity.” Ann. Biomed. Eng, vol. 36, no. 6, pp. 1049–59, 2008. [DOI] [PMC free article] [PubMed] [Google Scholar]
- [28].Nguyen TP and Debled-Rennesson I, “Curvature and torsion estimators for 3D curves,” Lect. Notes Comput. Sci. (including Subser. Lect. Notes Artif. Intell. Lect. Notes Bioinformatics), vol. 5358 LNCS, no. PART 1, pp. 688–699, 2008. [Google Scholar]
- [29].Angeli TR, et al. , “High-resolution electrical mapping of porcine gastric slow-wave propagation from the mucosal surface.” Neurogastroenterol. Motil, vol. 29, no. 5, p. e13010, 2017. [DOI] [PMC free article] [PubMed] [Google Scholar]
- [30].Taha AA and Hanbury A, “Metrics for evaluating 3D medical image segmentation: analysis, selection, and tool,” BMC Med. Imaging, vol. 15, no. 1, p. 29, 2015. [DOI] [PMC free article] [PubMed] [Google Scholar]
- [31].Kim J, et al. , “Thickness of rectus abdominis muscle and abdominal subcutaneous fat tissue in adult women: correlation with age, pregnancy, laparotomy, and body mass index.” Arch. Plast. Surg, vol. 39, no. 5, pp. 528–33, 2012. [DOI] [PMC free article] [PubMed] [Google Scholar]
- [32].Best SL, et al. , “Magnetic anchoring and Guidance System instrumentation for laparo-endoscopic single-site surgery/natural orifice transluminal endoscopic surgery: Lack of histologic damage after prolonged magnetic coupling across the abdominal wall,” Urology, vol. 77, no. 1, pp. 243–247, 2011. [DOI] [PubMed] [Google Scholar]
- [33].Bianchi F, et al. , “Localization strategies for robotic endoscopic capsules: a review,” Expert Rev. Med. Devices, vol. 16, no. 5, pp. 381–403, 2019. [DOI] [PubMed] [Google Scholar]
- [34].Ribitsch I, et al. , “Large Animal Models in Regenerative Medicine and Tissue Engineering: To Do or Not to Do.” Front. Bioeng. Biotechnol, vol. 8, p. 972, 2020. [DOI] [PMC free article] [PubMed] [Google Scholar]
- [35].Du P, et al. , “High-resolution Mapping of In Vivo Gastrointestinal Slow Wave Activity Using Flexible Printed Circuit Board Electrodes: Methodology and Validation,” Ann. Biomed. Eng, vol. 37, no. 4, pp. 839–846, 2009. [DOI] [PMC free article] [PubMed] [Google Scholar]
- [36].Chan C-HA, et al. , “Localized gastric distension disrupts slow-wave entrainment leading to temporary ectopic propagation: a high-resolution electrical mapping study.” Am. J. Physiol. Gastrointest. Liver Physiol., vol. 321, no. 6, pp. G656–G667, 2021. [DOI] [PubMed] [Google Scholar]
- [37].Van den Broeck J, et al. , “Segmentation accuracy of long bones,” Med. Eng. Phys, vol. 36, no. 7, pp. 949–953, 2014. [DOI] [PubMed] [Google Scholar]
- [38].Aghababaie Z, et al. , “Targeted ablation of gastric pacemaker sites to modulate patterns of bioelectrical slow wave activation and propagation in an anesthetized pig model,” Am. J. Physiol. Liver Physiol, vol. 322, no. 4, pp. G431–G445, 2022. [DOI] [PMC free article] [PubMed] [Google Scholar]
- 39.[] Alighaleh S, et al. , “Design and Validation of a Surface-Contact Electrode for Gastric Pacing and Concurrent Slow-Wave Mapping,” IEEE Trans. Biomed. Eng, vol. 68, no. 8, pp. 2574–2581, 2021. [DOI] [PubMed] [Google Scholar]
- [40].Gregersen H and Lo KM, “What Is the Future of Impedance Planimetry in Gastroenterology?” J. Neurogastroenterol. Motil, vol. 24, no. 2, pp. 166–181, 2018. [DOI] [PMC free article] [PubMed] [Google Scholar]
- [41].Somarajan S, et al. , “Noninvasive Magnetogastrography Detects Erythromycin-Induced Effects on the Gastric Slow Wave,” IEEE Trans. Biomed. Eng, vol. 66, no. 2, pp. 327–334, 2019. [DOI] [PMC free article] [PubMed] [Google Scholar]
- [42].Neugebauer F, et al. , “Validating EEG, MEG and Combined MEG and EEG Beamforming for an Estimation of the Epileptogenic Zone in Focal Cortical Dysplasia.” Brain Sci, vol. 12, no. 1, 2022. [DOI] [PMC free article] [PubMed] [Google Scholar]
- [43].Banerjee S, et al. , “Volume and position change of the stomach during gastric accommodation and emptying: A detailed three-dimensional morphological analysis based on MRI.” Neurogastroenterol. Motil, vol. 32, no. 8, p. e13865, 2020. [DOI] [PubMed] [Google Scholar]
- [44].Phillips C, et al. , “Anatomically informed basis functions for EEG source localization: combining functional and anatomical constraints.” Neuroimage, vol. 16, no. 3 Pt 1, pp. 678–95, 2002. [DOI] [PubMed] [Google Scholar]
- [45].Widya AR, et al. , “Whole Stomach 3D Reconstruction and Frame Localization From Monocular Endoscope Video.” IEEE J. Transl. Eng. Heal. Med, vol. 7, p. 3300310, 2019. [DOI] [PMC free article] [PubMed] [Google Scholar]
- [46].Steinsvik EK, et al. , “Ultrasound imaging for assessing functions of the GI tract.” Physiol. Meas, vol. 42, no. 2, p. 024002, 2021. [DOI] [PubMed] [Google Scholar]
- [47].Liao D, et al. , “Analysis of surface geometry of the human stomach using real-time 3-D ultrasonography in vivo,” Neurogastroenterol. Motil, vol. 16, no. 3, pp. 315–324, 2004. [DOI] [PubMed] [Google Scholar]


