School of Science and Technology, University of Trás-os-Montes e Alto Douro, UTAD, Quinta de Prados, Vila Real 5001-801, Portugal
2.
Departamento de Epidemiologia, Instituto Nacional de Saúde Doutor Ricardo Jorge (INSA), Lisbon 1649-016, Portugal
3.
Escola Nacional de Saúde Pública, Universidade NOVA de Lisboa
4.
Center for Mathematics and Applications (CMA) and Department of Mathematics, NOVA School of Science and Technology, FCT NOVA, Quinta da Torre, Caparica 2829-516, Portugal
5.
Center for Computational and Stochastic Mathematics, Instituto Superior Técnico, University of Lisbon, Lisbon 1049-001, Portugal
Academic Editor: Cristiana J. Silva
Received:
31 August 2021
Accepted:
09 November 2021
Published:
22 November 2021
In this work we use simple mathematical models to study the impact of vaccination against COVID-19 in Portugal. First, we fit a SEIR type model without vaccination to the Portuguese data on confirmed cases of COVID-19 by the date of symptom onset, from the beginning of the epidemic until the 23rd January of 2021, to estimate changes in the transmission intensity. Then, by including vaccination in the model we develop different scenarios for the fade-out of the non pharmacological intervention (NPIs) as vaccine coverage increases in the population according to Portuguese vaccination goals. We include a feedback function to mimic the implementation and relaxation of NPIs, according to some disease incidence thresholds defined by the Portuguese health authorities.
Citation: Beatriz Machado, Liliana Antunes, Constantino Caetano, João F. Pereira, Baltazar Nunes, Paula Patrício, M. Luísa Morgado. The impact of vaccination on the evolution of COVID-19 in Portugal[J]. Mathematical Biosciences and Engineering, 2022, 19(1): 936-952. doi: 10.3934/mbe.2022043
Related Papers:
[1]
Pannathon Kreabkhontho, Watchara Teparos, Thitiya Theparod .
Potential for eliminating COVID-19 in Thailand through third-dose vaccination: A modeling approach. Mathematical Biosciences and Engineering, 2024, 21(8): 6807-6828.
doi: 10.3934/mbe.2024298
[2]
Ayako Suzuki, Hiroshi Nishiura .
Transmission dynamics of varicella before, during and after the COVID-19 pandemic in Japan: a modelling study. Mathematical Biosciences and Engineering, 2022, 19(6): 5998-6012.
doi: 10.3934/mbe.2022280
[3]
Fang Wang, Lianying Cao, Xiaoji Song .
Mathematical modeling of mutated COVID-19 transmission with quarantine, isolation and vaccination. Mathematical Biosciences and Engineering, 2022, 19(8): 8035-8056.
doi: 10.3934/mbe.2022376
[4]
Glenn Ledder .
Incorporating mass vaccination into compartment models for infectious diseases. Mathematical Biosciences and Engineering, 2022, 19(9): 9457-9480.
doi: 10.3934/mbe.2022440
[5]
Ahmed Alshehri, Saif Ullah .
A numerical study of COVID-19 epidemic model with vaccination and diffusion. Mathematical Biosciences and Engineering, 2023, 20(3): 4643-4672.
doi: 10.3934/mbe.2023215
[6]
Xiaojing Wang, Yu Liang, Jiahui Li, Maoxing Liu .
Modeling COVID-19 transmission dynamics incorporating media coverage and vaccination. Mathematical Biosciences and Engineering, 2023, 20(6): 10392-10403.
doi: 10.3934/mbe.2023456
[7]
Yuto Omae, Yohei Kakimoto, Makoto Sasaki, Jun Toyotani, Kazuyuki Hara, Yasuhiro Gon, Hirotaka Takahashi .
SIRVVD model-based verification of the effect of first and second doses of COVID-19/SARS-CoV-2 vaccination in Japan. Mathematical Biosciences and Engineering, 2022, 19(1): 1026-1040.
doi: 10.3934/mbe.2022047
[8]
Tetsuro Kobayashi, Hiroshi Nishiura .
Prioritizing COVID-19 vaccination. Part 2: Real-time comparison between single-dose and double-dose in Japan. Mathematical Biosciences and Engineering, 2022, 19(7): 7410-7424.
doi: 10.3934/mbe.2022350
[9]
Vinicius Piccirillo .
COVID-19 pandemic control using restrictions and vaccination. Mathematical Biosciences and Engineering, 2022, 19(2): 1355-1372.
doi: 10.3934/mbe.2022062
[10]
Avinash Shankaranarayanan, Hsiu-Chuan Wei .
Mathematical modeling of SARS-nCoV-2 virus in Tamil Nadu, South India. Mathematical Biosciences and Engineering, 2022, 19(11): 11324-11344.
doi: 10.3934/mbe.2022527
Abstract
In this work we use simple mathematical models to study the impact of vaccination against COVID-19 in Portugal. First, we fit a SEIR type model without vaccination to the Portuguese data on confirmed cases of COVID-19 by the date of symptom onset, from the beginning of the epidemic until the 23rd January of 2021, to estimate changes in the transmission intensity. Then, by including vaccination in the model we develop different scenarios for the fade-out of the non pharmacological intervention (NPIs) as vaccine coverage increases in the population according to Portuguese vaccination goals. We include a feedback function to mimic the implementation and relaxation of NPIs, according to some disease incidence thresholds defined by the Portuguese health authorities.
1.
Introduction
The first cases of the new coronavirus infection, diagnosed as severe pneumonia of unknown etiology, appeared in December 2019, in the city of Wuhan, China. Later, the acute respiratory syndrome coronavirus SARS-CoV-2 was identified as the causative agent of the disease COVID-19 [1]. Its rapid spread worldwide led the World Health Organization (WHO) to declare, on 11 of March 2020, the COVID-19 infection, a worldwide pandemic.
Until there was a vaccine available capable of protecting individuals from this disease, only non-pharmaceutical interventions (NPIs), aimed at reducing population contact rates and thus reducing virus transmission, could be implemented in the population. Two fundamental strategies were possible: mitigation, which focuses on slowing but not necessarily stopping epidemic spread–reducing peak healthcare demand while protecting those most at risk of severe disease from infection, and suppression, which aims to reverse epidemic growth, reducing case numbers to low levels and maintaining that situation indefinitely [2].
One of the known strategies to mitigate the effect of infectious diseases is through vaccination. Thus, the greatest hope of the world population against COVID-19 is mass vaccination, which has proved to be a great challenge both for the pharmaceutical industry and for the national health systems. The completion of the testing phase for the first vaccines for COVID-19 took place in December 2020. As soon as they were approved by the national regulatory authorities, the vaccination began in accordance with the country's national immunization plan. COVID-19 vaccines are crucial tools in the pandemic response and protect against serious illness and death. Several studies have shown their effectiveness in reducing the development of serious disease, but also reducing the ability to transmit the virus [3]. However, the limitations imposed by production capacity and a logistical plan for the distribution of vaccines challenged the potential for applying vaccines in the population, especially in less developed countries [4].
The Portuguese government authorities adopted a rapid vaccination strategy against COVID-19 and this is the reason why Portugal is, currently, one of the European countries with the highest rate of vaccinated individuals in its population (see Directorate-General for Health (DGS) website). In Portugal, vaccination started on late December 2020. At an early stage, priority was given to high risk individuals (healthcare professionals, individuals with comorbidities or over 80 years old) and the second one for the general population, organised by age groups. Four vaccines have been administered until now: Pfizer and Moderna vaccine (two doses, 28 days apart), AstraZeneca (two doses, 8 to 12 weeks apart) and Janssen, (single dose). Until July 7, 2021, 9, 625, 694 doses were administered, corresponding to 3, 710, 093 individuals with full vaccination (available at DGS site).
Mathematical models for infectious diseases achieved great prominence during the COVID-19 pandemic (see [5,6,7,8,9,10] and the references therein), in particular for Portugal we refer to the works [11,12,13]. These models range from simple deterministic continuous time models, to sophisticated computer simulation schemes. Common deterministic models for the spread of an infectious disease are described by a system of ordinary differential equations (ODEs) capable of representing the most important stages of a disease. In other words, this type of models allows obtaining information about the epidemic's dynamics and helps to define disease combat and prevention strategies.
The main objective of this study is to analyse the impact of vaccination on the control of the pandemic. In a previous work [11], we have developed an age structured model to evaluate the effect of the NPIs on the COVID-19 in Portugal, using hospitalization and ICU stages to fit the parameters of the model related to the changes in the transmission. In order to complement this, here we want to use a simple model to be fitted to Portuguese data on confirmed cases, to see if it could describe COVID-19 dynamics in Portugal when using different and more noisy data. On the other hand, we also believe that this can be an important tool in decision-making by health authorities. From the beginning of 2021, Portugal has been using a risk matrix based on two indicators, Rt and the 14-day cumulative incidence per 100, 000 inhabitants, to impose or lift NPIs. As we will see in the results section, the model will allow us to determine these two indicators through time.
This paper is organized as follows: in Section 2 two simple mathematical models are described, with and without vaccination. In Section 3, we present the fitting results to Portuguese data of the model before vaccination and we also simulate some scenarios after vaccination is introduced. We proceed with some discussion on these results and end with some conclusions.
2.
Mathematical models and methods
In this section we present the two mathematical models we will use to describe the evolution of the COVID-19 in Portugal. First, in Subsection 2.1 we consider a SEIR type model to estimate the parameters related to the changes in the transmission of the disease and the time-points where these transitions occurred, as a consequence of the NPIs measures implemented in Portugal. Then, in Subsection 2.2 we include the vaccination in the model and we evaluate its impact on the evolution of the pandemic combined with different NPIs.
2.1. Mathematical model without vaccination
Several mathematical models have been proposed to represent population dynamics and their interactions in order to predict the dynamics of the COVID-19 pandemic. Most of them describe the propagation of COVID-19 based on SIR (Susceptible, Infected and Recovered) or SEIR (Susceptible, Exposed, Infected and Recovered) modifications [5,6,7,8,9,11,12,13]. We choose to use a simple SEIR model as in [14], because we decided to keep the model as simple as possible, as adding more compartments increases the number of unknown parameters to be estimated. The class of infected individuals is subdivided into two compartments, the confirmed infected, Ic, and the unconfirmed infected, Iu, since asymptomatic infections can only be detected when confirmed with a RT-PCR test, and symptomatic cases may not be detected if they do not seek medical care [15]. The model is described by the following system of ordinary differential equations:
We assume that the disease-related parameters are fixed and are described in Table 1, namely σ, the rate at which an exposed individual becomes infected, the inverse of the mean value of the latency period, considered to be 3.8 days; γ, the rate at which infected individuals are removed, defined by the inverse of the mean period of infection, which is assumed to be 3.4 days; α, the relative transmission of confirmed and unconfirmed infectious cases, that here is, for simplicity, considered equal to 1 as in [14]. We also fix N, the total number of the Portuguese population, obtained from Statistics Portugal, since the time interval that we are analysing is relatively small to disregard demographics dynamics.
Table 1.
The values of the parameters used in the SEIR Model.
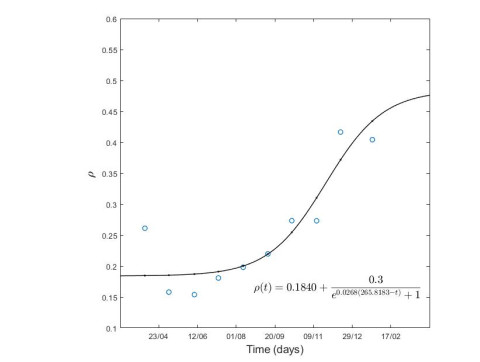
Parameter ρ represents the proportion of confirmed cases out of the total number of cases (confirmed and unconfirmed), that is, the cumulative number of confirmed cases up to a certain date divided by an estimate of the total number of cases [14]. This is obtained from the quotient of the cumulative number of confirmed cases by the cumulative number of deaths to date for a mortality rate of 0.66% for a certain time period. We assume that it varies in time as the identification of infected cases improves, more details are given on Section 3.1.
We assume that the NPIs intensity changes imposed by the Portuguese Government will correspond to a change in the transmission rate, reflecting a change in contacts and/or effectiveness of such intervention. We divide our time interval of our analysis into four periods corresponding to different waves of transmission. For that, we will consider that β(t) is a piecewise function, where the transmission rate will vary according to the reinforcement or relief of the containment measures at different time points. These parameters are then estimated by fitting the model results to real data, as properly explained in Section 3.1.
The basic reproduction number, R0 is defined as the number of individuals that can be infected by an infectious individual, on average, in an environment where all individuals are susceptible without intervention. R0 may reflect the potential and severity of the epidemic outbreak for a naive population. R0<1 means that the disease is not able to invade the population and when R0>1 an outbreak occurs. For our model, the basic reproduction is:
R0=β(ρ+α(1−ρ))γ.
(2.2)
Based on R0 expression, and since we assume that α=1, we define the effective reproduction number as:
Rt=Rt(t)=β(t)γS(t)N.
(2.3)
Thus, when Rt>1 the epidemic is in an increasing phase. Otherwise, when Rt<1, the epidemic is in a decreasing phase
In order to illustrate the evolution of the different compartments, we implemented the system of differential equations in Matlab software and used the Ode45 routine to perform numerical simulations.
A major difference between our approach and the one used in [14] is in the choice of the solution curve of model (2.1) to be fitted to real data. In [14] the γIc curve was fitted to the daily reported cases. Here, instead, we will fit the ρσE curve to the number of cases by the date of the symptom onset, which, in our opinion, is a more reliable data set, since it does not contain possible fluctuations in the notification process.
We considered the following set of initial conditions (see [14] for details):
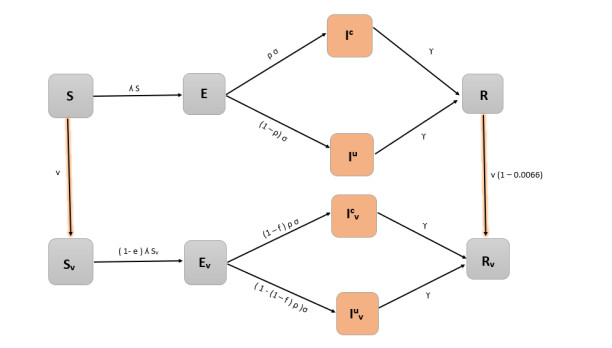
In this subsection we modify the initial model to include vaccination by duplicating the classes into vaccinated and non vaccinated. A schematic diagram of the vaccination model is presented in Figure 1. The model can be defined through the following ordinary differential system:
Both vaccinated and non vaccinated individuals can be infected and both contribute to the force of infection λ. We assume that only susceptible and recovered individuals are vaccinated at rate v.
Protection conferred by the vaccine is assumed to decrease susceptibility (parameter e) and decrease the risk of severe/symptomatic disease upon infection acquisition (parameter f). We assumed e = 0.75 and f = 0.20 in order to achieve an effectiveness of 80% of the vaccine ([17,18], personal communication INSA) according to the following expression:
effectiveness=1−[(1−e)(1−f)].
(2.5)
The vaccination rate, v, is given by the following expression:
v=−log(1−PT),
(2.6)
where P corresponds to the percentage of the vaccinated population and T is the period of time in which that population will be vaccinated. For the vaccination model, the effective reproduction number, Rt, can be obtained from the following expression:
Rt=β(t)γS(t)+(1−e)Sv(t)N.
(2.7)
Note that Rt now depends explicitly on the protection against susceptibility to infection conferred by vaccination, e but also on v and f, through Sv.
We took as initial conditions for the non-vaccinated classes the number of confirmed cases and deaths on January 23rd, which were available on the Directorate-General for Health (DGS) website. In our model, individuals are considered vaccinated 14 days after the last dose, since that for most available vaccines this is the average time until being protected. So, we start the vaccination model simulations on the 23rd of January. We also assumed that there is no loss of immunity during the considered period. From the 23rd of January to the 9th of July, we fitted the vaccination model curve γ(Ic+Icv), to the number of confirmed cases. As before, we assumed that β(t) is a piecewise function and estimated the transmission rate changes and the time when these changes occur.
The model will be used to create some scenarios for complementary control measures and evaluate vaccination results under these scenarios.
3.
Results
In this section we present the fitting results of model (2.1) to Portuguese data on the number of new cases by symptom onset date, during the period between the 4th of March 2021 until the 23rd of January 2021. Then, in order to analyse the impact of vaccination in the evolution of COVID-19 we first fit the vaccination model (2.4) to the Portuguese data on number of confirmed cases observed from the 23rd of January 2021 to the 9th of July 2021. Finally, we simulate some scenarios for vaccination and NPIs relaxation to evaluate Portuguese vaccination campaign results.
3.1. Fitting the SEIR model to Portuguese data
The model (2.1) has been fitted to Portuguese data on the number of new cases by symptom onset date, from March 4th to January 23rd of 2021 (available here). Data on the number of new cases by symptom onset date will correspond, on the model, to the curve ρσE(t). Since the parameter ρ assumes different values in each period and in order to obtain a continuous curve in the considered period under analysis, we used ρ as a time dependent function, obtained by fitting the different values computed for time intervals of approximately one month (see Figure 2).
Figure 2.
Fitting results for the proportion of confirmed cases out of the total number of infected cases over time, ρ(t).
We assume that the implementation and lifting of NPIs are related to changes in the transmission, moreover they are generally not expected to take effect immediately. Hence, we will estimate the changes in transmissibility and the time points when these changes occur. We divided the period from March 4th, 2020 to January 23rd, 2021 in 4 periods:
● P1: from March 4 to June 1;
● P2: from June 1 to August 31;
● P3: from August 31 to December 12;
● P4: from December 12 to January 23.
In each period, we assume that β is a function of the form:
β(t)={βpre,t<trβpos,t≥tr
(3.1)
The fitting was performed using the fminsearch routine available in Matlab to minimize the sum of the squares of the residuals, in each period, obtaining an estimate for parameters βpre, βpos and tr. For the first period P1, the value E0=E(0) was also estimated to be equal to 1780 individuals. The values of estimated parameters can be found in Table 2.
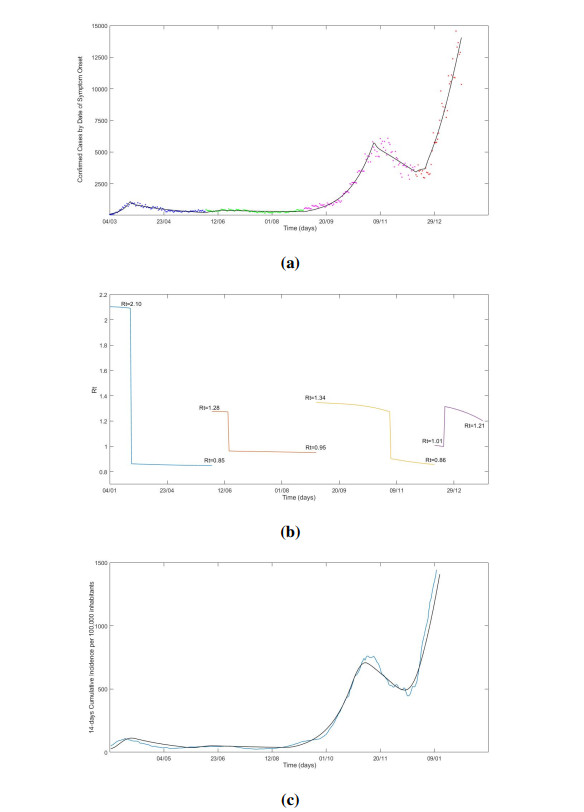
Results of the model using the parameters obtained from the fitting procedure are depicted in Figure 3. As it can be seen in Figure 3(a), the numerical results provided by the model are in good agreement with the daily Portuguese confirmed cases. The values of Rt were computed by using Eqs (2.3) and (3.1) with the values of βpre, βpos and tr given in Table 2. Results are presented in Figure 3(b). We observe that they are consistent with the ones obtained in [11] (see Figure 4 therein). The estimated values for tr in the four periods correspond to the following dates: 22/03/2020; 15/06/2020; 2/11/2020 and 20/12/2020. Note that the tr corresponds to the day that changes in transmission occur which reflects not only changes on the control measures but also changes on the behaviour of the population. By comparing to the dates in Table 3, we see that the first breaking point on 22/03/2020 coincides with the first "state of contingency" implementation. The second breaking point, on 15/06/2020, is subsequent of three waves of lockdown phase-out measures. The third breaking point, on 2/11/2020, follows a sequence of reinforcement of the control measures that culminates with the "state of emergency" on 09/11/2020. Finally, the fourth breaking point, on 20/12/2020, is a consequence of the announcement of the control measures relaxation for the Christmas eve and Christmas day, and corresponds to an increase of contacts due to Christmas gatherings. We remark that the model is also able to reproduce the 14-day cumulative incidence per 100, 000 inhabitants, as shown in Figure 3(c).
Table 3.
Introduction and lifting of NPI adopted in Portugal, dates and descriptions. Lockdown refers to a mandatory stay-at-home order. In Portugal this refers to a declaration of "state-of-emergency" by the Portuguese government to provide a response to a national crisis. This state allows the implementation of severe measures to fight disease spread. "state of contingency" refers to the introduction of milder measures and "state of calamity" corresponds to a state in between contingency and emergency.
date
description
2020-03-12
announcement of schools closure
2020-03-16
closure of schools
2020-03-18
lockdown ("state-of-emergency") announcement
2020-03-22
lockdown goes into effect
2020-04-28
announcement of lockdown phase-out
2020-05-04
first wave of lockdown phase-out
2020-05-18
second wave of lockdown phase-out
2020-06-01
third wave of lockdown phase-out
2020-09-15
"state of contingency" goes into effect
2020-10-15
"state of calamity" goes into effect
2020-10-28
outdoor obligatory use of mask
2020-11-04
lockdown on weekends for counties above 480/100, 000 incidence
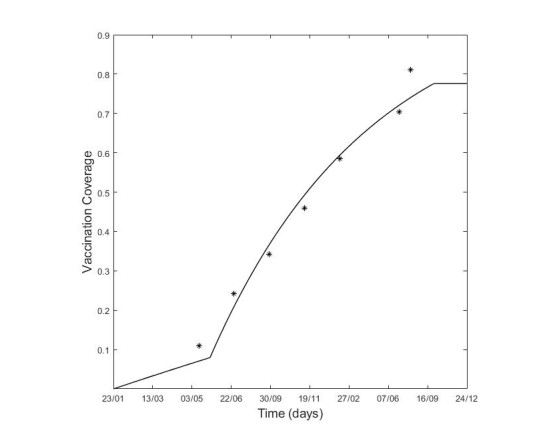
Figure 4.
Coverage vaccination in the Portuguese population: the asterisks correspond to the proportion of the vaccinated population according the Portuguese vaccination plan and the curve corresponds to the vaccination coverage given by Eq (2.6).
Following the Portuguese vaccination coverage reports and early proposed plans (available at DGS site), we computed the vaccination rates using Eq (2.6) for two time periods corresponding to different vaccination phases: vaccination of high risk groups (e.g., health workers, individuals with comorbidities and the older age group (+85)) und vaccination by age group from 85 to 15 years old. The resulting vaccination coverage as function of time is shown in Figure 4.
In Portugal, the health authorities have established a risk matrix as a criteria for the implementation of the control measures. This risk matrix is based on two indicators: the effective reproduction ratio (Rt) and on the 14-day cumulative incidence of cases per 100, 000 inhabitants. Two risk levels were defined: 120 and 240 cases of the 14-day cumulative incidence per 100, 000 inhabitants, above which, combined with Rt>1, the control measures should be reinforced.
In January 2021, a lockdown was implemented to control the steep increase of cases and hospitalizations. In April, the relaxation of the lockdown started with selected Portuguese regions, either progressing, stopping or retreating in the disconfinement when these levels (known as the 'red lines') are crossed.
From 23rd of January to 9th of July 2021, we fitted the vaccination model to the Portuguese data on confirmed cases notification (available at ECDC site). Following the same procedure as described in the previous section, we divided this period into two time-windows:
● P5: from January 23th to May 1st of 2021;
● P6: from May 1st to July 9th;
We used data from the DGS national daily reports, to infer the initial conditions for the vaccination model. We assumed that β is a piecewise function as in Eq (3.1) and ρ is constant in each one of these periods and equal to 0.33 and 0.35, respectively.
The values of estimated parameters can be found in Table 4.
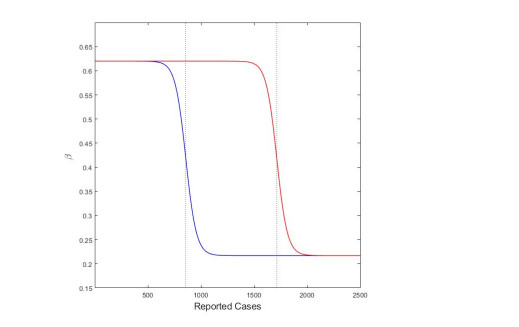
After June the 2nd of 2021, the time point estimated as the last change in transmissibility to occur (t=130), we consider different scenarios based on measures to be implemented. To mimic the 'red lines' criteria defined by the health authorities we use a logistic type function for the transmission rate β, that depends on the incidence of confirmed cases, γ(Ic+Icv) with a 14 day delay. The logistic function has the following expression:
β(γ(Ic+Icv))=(1−L1+e−k(γ(Ic+Icv)−x0))β0,
(3.2)
where L=0.65 is the maximum reduction on the transmission previously observed, k=0.02 which controls the rate of change between the two levels of transmission, and β0=0.62 that is the transmission intensity prior to implementation of control measures. Parameter x0 takes the value of 857 for the 14-day cumulative incidence per 100, 000 inhabitants of 120 cases and 1714 for 240 cases (see Figure 5).
Figure 5.
Logistic function Eq (3.2). Blue curve: x0 = 857; red curve: x0 = 1714.
In what follows we show the results of the simulations of three scenarios from the 2nd of June 2021:
Scenario 1 (S1): We assume that when we have reached a 14-day cumulative incidence per 100, 000 inhabitants equal to 120, there will be a reduction in the transmission rate (meaning that some NPIs are implemented in order to reduce the contacts between individuals), achieved accordingly to the logistic function described by Eq (3.2).
Scenario 2 (S2): The same as in Scenario 1 but where the 120 14-day cumulative incidence per 100, 000 inhabitants is replaced with the 240 14-day cumulative incidence per 100, 000 inhabitants.
Scenario 3 (S3): NPI's correspond to the estimated value for β obtained for the period between 2nd of June to the 9th of July, 2021. No further changes are considered.
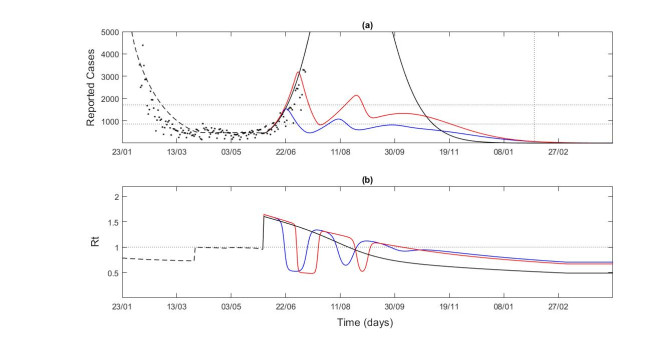
In Figure 6(a), we can see the comparison of the vaccination model results with the estimated parameters using the Portuguese data on reported cases, from the 23rd of January to the 9th of July, 2021. From June the 2nd, the confirmed cases resulting from the different scenarios are considered. The observed cases are above those predicted by Scenario 1. For Scenario 2, it is expected that the number of confirmed cases starts to decrease even before the 9th of July, with cases reaching more than 3000 per day. If no additional measures are implemented the number of confirmed cases can go up to 11, 000 per day (not showed).
Figure 6.
Vaccination model results. (a) Confirmed cases (b) Transmissibility index value, Rt. Portuguese data on reported cases by DGS (black dots). Scenario: S1 (blue line), S2 (red line) and S3 (black line).
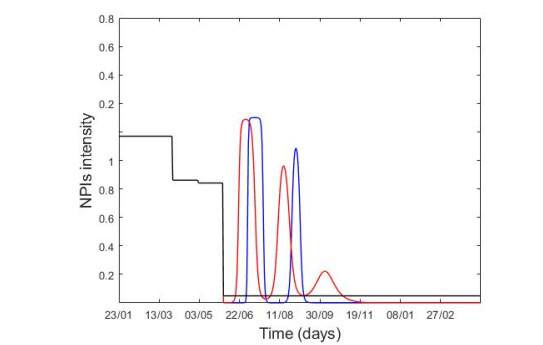
The implementation of the 'red line' criteria would rapidly revert the increase in the number of cases. It would be necessary to reinforce the control measures 2 or 3 times for Scenarios 1 and 2, respectively, before vaccination is able to control the epidemic alone, as illustrated in Figures 6(b) and 8.
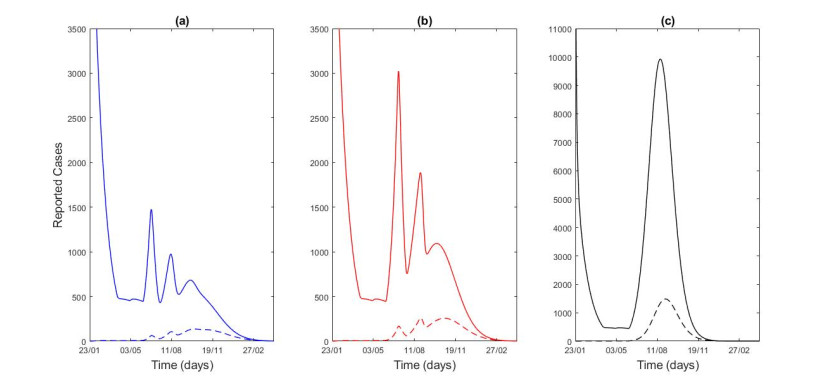
Figure 7.
Vaccinated (continuous lines) and non-vaccinated (dashed lines) cases for the 3 scenarios: S1 (blue line), S2 (red line) and S3 (black line).
In Figure 7, it is possible to compare the cases among vaccinated and non vaccinated population. As mentioned before, we assumed an effectiveness of the vaccine of 80% and even so we can observe a significant difference between the vaccinated and non vaccinated individuals along the three scenarios. Naturally, this difference is accentuated if higher values of vaccine effectiveness are considered.
4.
Discussion and conclusions
In this work, we used simple mathematical models for the SARS-CoV-2 transmission to understand the impact of vaccination on the dynamics of COVID-19 disease in Portugal.
First we fitted the model without vaccination to reported cases by date of symptom onset, from March 2020 to January 2021, to estimate changes in the transmissibility.
Even though we have used simple models, by analysing their results, we observe that they are able to well describe the evolution of the disease in Portugal, even when comparing to the 14-day cumulative incidence per 100, 000 inhabitants, reported by Portuguese Health Authorities (see Figure 3(c)). It is more common to fit this type of models to more robust data, such as the number of beds occupied in intensive care units or the number of deaths, but from the results obtained here, we can conclude that the fit to confirmed cases is also viable when using data on reported cases by date of symptom onset. We have chosen this data instead of notification of cases used by [14] because it is a more robust data set, since it avoids the possible delays in the notification procedure. Our results also show that the effective reproduction number obtained by the model (shown in Figure 3(b)) is consistent with the estimated values reported by DGS and those obtained with more sophisticated models [11,13]. This allows a simpler and faster way to track further changes in transmission, propose and evaluate the different control strategies based on the reported cases as the two indicators Rt and 14-day cumulative incidence per 100, 000 inhabitants defined by the Portuguese Government as 'red lines' to control the pandemic are easily obtained through this model.
We then included vaccination in the model to better understand the interplay between the relaxation of NPIs and the intensification of the vaccination coverage. Vaccination was implemented according to the Portuguese vaccination plans and NPIs were changed taking into account the 'red lines' criteria. Instead of simulating static future scenarios, in the sense that NPI's do not change after a certain moment in time, as done in [13], we used the logistic-type function Eq (3.2) which allows us to simulate the effect of NPIs with different intensities. Results are shown in Figure 6.
Despite the increasing number of vaccinated individuals over time, the model indicates that it is crucial to maintain NPIs in forthcoming months, otherwise the number of confirmed cases could reach around 11, 000, possibly resulting in a severe impact of the Portuguese health services. Results are based on current data on the effectiveness of the vaccine, which can be revised as more information on the new SARS-CoV-2 variants of concern becomes available. Furthermore, the duration of vaccine-acquired immunity, and whether or not there is a loss of immunity, is still an open question.
Our modeling study has some limitations, namely the use an homogeneous model which can overestimate transmission and does not allow us to distinguish the evolution of the disease between age groups. Such a simple model, on the other hand, facilitates the implementation of alternative model assumptions and configurations, against heterogeneous or other complex models. Moreover, by using homogeneous models, the number of parameters to be estimated from fitting is significantly lower when compared with heterogeneous models which make it easier to control the epidemiological meaning of the values obtained.
There is some degree of uncertainty in the parameters related to the infectious period for both confirmed and unconfirmed cases. We assumed a significantly lower infectious period than many virological/epidemiological estimates [16]. However, for modelling purposes the infectious period corresponds to the time during which the individual is able to contribute to community transmission.
It is hard to assign, a priori, a time point for each change in transmission since these changes can reflect not only the introduction or relaxation of a control measures, but also the behavioural changes of the population. We decided to estimate these time points although this can create some over fitting. Moreover, our model does not take into account the appearance of new variants of SARS-CoV-2 and their potential impact on the transmission and on vaccine efficacy. Since the fitting of the vaccination was made until July 2021, we can expect that the changes in the transmission caused by the Delta variant were taken into account indirectly.
Our main objective in this work was to show that the use of very simple models does not compromise their accuracy regarding the description of the evolution of the pandemic. Due to their simplicity, they provide a quick and effective response to support policy decisions. Issues such as the actual effectiveness of the vaccine, the relative rate of transmission of confirmed and non-confirmed cases, α (which is a controversial topic) and its proportion ρ can be further explored in the future as more founded studies are available. Further investigation will also focus on the construction of scenarios including new SARS-CoV-2 variants for which the vaccine has lower or no efficacy and the impact caused by the waning of immunity.
Acknowledgments
The authors acknowledge financial support from the Fundação para a Ciência e Tecnologia—FCT through project 692 2a edição Research 4 covid, project name Projeção do Impacte das medidas Não-farmacológicas de Controlo e mitigação da epidemia de COVID-19 em Tempo ReaL (COVID-19 in-CTRL). CC acknowledges FCT within the PhD grants "DOCTORATES 4 COVID-19", number 2020.10172.BD. PP acknowledges FCT within the Strategic Project UIDB/00297/2020 (Centro de Matemática e Aplicações, FCT NOVA). MLM acknowledges FCT within projects UIDB/04621/2020 and UIDP/04621/2020.
Conflict of interest
The authors declare no conflict of interest.
References
[1]
T. Singhal, A review of coronavirus disease-2019 (COVID-19), Indian J. Pediatr, 87 (2020), 281–286. doi: 10.1007/s12098-020-03263-6. doi: 10.1007/s12098-020-03263-6
[2]
A. Mavragani, K. Gkillas, Exploring the role of non-pharmaceutical interventions (NPIs) in flattening the Greek COVID-19 epidemic curve, Sci. Rep., 11 (2021), 11741. doi: 10.1038/s41598-021-90293-5. doi: 10.1038/s41598-021-90293-5
[3]
C. Pawlowski, P. Lenehan, A. Puranik, V. Agarwal, A. J. Venkatakrishnan, M. J. M. Niesen, et al., FDA-authorized mRNA COVID-19 vaccines are effective per real-world evidence synthesized across a multi-state health system, Med, 2 (2021), 979–992. doi: 10.1016/j.medj.2021.06.007. doi: 10.1016/j.medj.2021.06.007
[4]
Z. Wang, C. T. Bauch, S. Bhattacharyya, A. d'Onofrio, P. Manfredi, M. Perc, et al., Statistical physics of vaccination, Phys. Rep., 664 (2016), 1–113. doi: 10.1016/j.physrep.2016.10.006. doi: 10.1016/j.physrep.2016.10.006
[5]
Z. Memon, S. Qureshi, B. R. Memon, Assessing the role of quarantine and isolation as control strategies for COVID-19 outbreak: a case study, Chaos Solutions Factals, 144 (2021). doi: 10.1016/j.chaos.2021.110655.
[6]
S. S. Musa, S. Qureshi, S. Zhao, A. Yusuf, U. T. Mustapha, D. He, Mathematical modeling of COVID-19 epidemic with effect of awareness programs, Infect. Dis. Model., 6 (2021), 448-460. doi: 10.1016/j.idm.2021.01.012. doi: 10.1016/j.idm.2021.01.012
[7]
O. J. Peter, S. Qureshi, A. Yusuf, M. Al-Shomrani, A. A. Idowu, A new mathematical model of COVID-19 using real data from Pakista, Results Phys., 24 (2021). doi: 10.1016/j.rinp.2021.104098.
[8]
M. Amouch, N. Karim, Modeling the dynamic of COVID-19 with different types of transmissions, Chaos Solitions Fractals, 150 (2021). doi: 10.1016/j.chaos.2021.111188.
[9]
P. Harjule, V. Tiwari, A. Kumar, Mathematical models to predict COVID-19 outbreak : an interim review, J. Int. Math., 24 (2021), 259–284. doi: 10.1080/09720502.2020.1848316. doi: 10.1080/09720502.2020.1848316
[10]
S. Moore, E. M. Hill, M. J. Tildesley, L. Dyson, M. J. Keeling, Vaccination and non-pharmaceutical interventions for COVID-19: a mathematical modelling study, Lancet Infect. Dis., 21 (2021), 793–802. doi: 10.1016/S1473-3099(21)00143-2. doi: 10.1016/S1473-3099(21)00143-2
[11]
C. Caetano, M. L. Morgado, P. Patrício, J. F. Pereira, B. Nunes, Mathematical modelling of the impact of non-pharmacological strategies to control the COVID-19 epidemic in Portugal, Mathematics, 9 (2021), 1084. doi: 10.3390/math9101084. doi: 10.3390/math9101084
[12]
A. P. Lemos-Paião, C. J. Silva, D. F. M. Torres, A new compartmental epidemiological model for COVID-19 with a case study of Portugal, Ecol. Complex., 44 (2020), 100885. doi: 10.1016/j.ecocom.2020.100885. doi: 10.1016/j.ecocom.2020.100885
[13]
J. Viana, C. H. van Dorp, A. Nunes, M. C. Gomes, M. van Boven, M. E. Kretzschmar, et al., Controlling the pandemic during the SARS-CoV-2 vaccination rollout, Nat. Commun., 12 (2021), 3674. doi: 10.21203/rs.3.rs-358417/v1. doi: 10.21203/rs.3.rs-358417/v1
[14]
D. H. Glass, European and US lockdowns and second waves during the COVID-19 pandemic, Math. Biosci., 330 (2020), 108472. doi: 10.1016/j.mbs.2020.108472. doi: 10.1016/j.mbs.2020.108472
[15]
K. Markowitz, M. Strickland, A. Huang, Fever and other clinical indicators may fail to detect COVID-19–infected individuals, J. Evidence Based Dental Pract., 20 (2020), 101499. doi: 10.1016/j.jebdp.2020.101499. doi: 10.1016/j.jebdp.2020.101499
[16]
W. Andrew, D. McEvoy, A. B. Collins, K. Hunt, M. Casey, A. Barber, et al., Inferred duration of infectious period of SARS-CoV-2: rapid scoping review and analysis of available evidence for asymptomatic and symptomatic COVID-19 cases, BMJ Open, 10 (2020). doi: 10.1136/bmjopen-2020-039856.
[17]
N. Barda, N. Dagan, R. D. Balicer, BNT162b2 mRNA COVID-19 vaccine in a nationwide mass vaccination setting, N. Engl. J. Med., 384 (2021), 1412–1423. doi: 10.1056/NEJMoa2101765. doi: 10.1056/NEJMoa2101765
[18]
P. T. Heath, E. P. Galiza, D. N. Baxter, M. Boffito, D. Browne, F. Burns, et al., Safety and efficacy of NVX-CoV2373 COVID-19 vaccine, N. Engl. J. Med., 30 (2021). doi: 10.1056/NEJMoa2107659.
This article has been cited by:
1.
Manuel L. Esquível, Nadezhda P. Krasii, Gracinda R. Guerreiro, Paula Patrício,
The Multi-Compartment SI(RD) Model with Regime Switching: An Application to COVID-19 Pandemic,
2021,
13,
2073-8994,
2427,
10.3390/sym13122427
2.
Constantino Caetano, Maria Luísa Morgado, Paula Patrício, Andreia Leite, Ausenda Machado, André Torres, João Freitas Pereira, Sónia Namorado, Ana Sottomayor, André Peralta-Santos, Baltazar Nunes,
Measuring the impact of COVID-19 vaccination and immunity waning: A modelling study for Portugal,
2022,
40,
0264410X,
7115,
10.1016/j.vaccine.2022.10.007
3.
João Mendes-Abreu, Ivan Cabo, Maria Inês Borges, Anabela Quitério, Tiago Nunes, Francisco Maio Matos, Francisco Vale, José Figueiredo,
The COVID-19 Impact on Oral Healthcare Demand and Performance: The Experience of a Clinical and Academic Centre in Portugal (EU),
2022,
36,
1646-0758,
15,
10.20344/amp.18280
4.
Mustafa Kamal, Mintodê Nicodème Atchadé, Yves Morel Sokadjo, Sabir Ali Siddiqui, Fathy H. Riad, M. M. Abd El-Raouf, Ramy Aldallal, Eslam Hussam, Huda M. Alshanbari, Hassan Alsuhabi, Ahmed M. Gemeay,
Influence of COVID-19 vaccination on the dynamics of new infected cases in the world,
2022,
20,
1551-0018,
3324,
10.3934/mbe.2023156
5.
Xinyu Bai, Shaojuan Ma,
Stochastic dynamical behavior of COVID-19 model based on secondary vaccination,
2022,
20,
1551-0018,
2980,
10.3934/mbe.2023141
6.
Irina Kislaya, Paulo Gonçalves, Sara Ramalhete, Marta Barreto, Ana Rita Torres, Vânia Gaio, Verónica Gómez, Carla Manita, João Almeida Santos, Sofia Soeiro, Rita De Sousa, Aryse Melo, Camila Henriques, Raquel Guiomar, Ana Paula Rodrigues, On Behalf of ISNCOVID-19 Group,
SARS-CoV-2 Seroprevalence Following a Large-Scale Vaccination Campaign in Portugal: Results of the National Serological Survey, September - November 2021,
2022,
36,
1646-0758,
5,
10.20344/amp.18528
7.
Ana Rita Sousa Sequeira, Marta Estrela, Kelsey DeWit,
COVID-19 Government policies in Portugal and Brazil: A three-year retrospective analysis,
2024,
13,
22118837,
100809,
10.1016/j.hlpt.2023.100809
8.
Sofia Tedim, Vera Afreixo, Miguel Felgueiras, Rui Pedro Leitão, Sofia J. Pinheiro, Cristiana J. Silva,
Evaluating COVID-19 in Portugal: Bootstrap confidence interval,
2023,
9,
2473-6988,
2756,
10.3934/math.2024136
9.
Jorge Lindo, Patrícia Coelho, Catarina Gavinhos, Manuel Martins, Joana Liberal, António Jorge Ferreira, Teresa Gonçalves, Francisco Rodrigues,
Health Status and COVID-19 Epidemiology in an Inland Region of Portugal: A Retrospective Study,
2024,
21,
1660-4601,
1033,
10.3390/ijerph21081033
10.
Oscar Espinosa, Laura Mora, Cristian Sanabria, Antonio Ramos, Duván Rincón, Valeria Bejarano, Jhonathan Rodríguez, Nicolás Barrera, Carlos Álvarez-Moreno, Jorge Cortés, Carlos Saavedra, Adriana Robayo, Oscar H. Franco,
Predictive models for health outcomes due to SARS-CoV-2, including the effect of vaccination: a systematic review,
2024,
13,
2046-4053,
10.1186/s13643-023-02411-1
11.
Yvette Montcho, Robinah Nalwanga, Paustella Azokpota, Jonas Têlé Doumatè, Bruno Enagnon Lokonon, Valère Kolawole Salako, Martin Wolkewitz, Romain Glèlè Kakaï,
Assessing the Impact of Vaccination on the Dynamics of COVID-19 in Africa: A Mathematical Modeling Study,
2023,
11,
2076-393X,
857,
10.3390/vaccines11040857
12.
Maximilian Pawleta, Susanne Kiefer, Edeltraud Gehrig,
Visualization of relevant parameter dependencies in a delay SEIQ epidemic model — A live script program for didactic and interactive demonstrations,
2023,
14,
1793-9623,
10.1142/S1793962323500423
13.
Horácio N. Hastenreiter Filho, Igor T. Peres, Lucas G. Maddalena, Fernanda A. Baião, Otavio T. Ranzani, Silvio Hamacher, Paula M. Maçaira, Fernando A. Bozza,
What we talk about when we talk about COVID-19 vaccination campaign impact: a narrative review,
2023,
11,
2296-2565,
10.3389/fpubh.2023.1126461
14.
Cheng-Cheng Zhu, Jiang Zhu, Jie Shao,
Epidemiological Investigation: Important Measures for the Prevention and Control of COVID-19 Epidemic in China,
2023,
11,
2227-7390,
3027,
10.3390/math11133027
Beatriz Machado, Liliana Antunes, Constantino Caetano, João F. Pereira, Baltazar Nunes, Paula Patrício, M. Luísa Morgado. The impact of vaccination on the evolution of COVID-19 in Portugal[J]. Mathematical Biosciences and Engineering, 2022, 19(1): 936-952. doi: 10.3934/mbe.2022043
Beatriz Machado, Liliana Antunes, Constantino Caetano, João F. Pereira, Baltazar Nunes, Paula Patrício, M. Luísa Morgado. The impact of vaccination on the evolution of COVID-19 in Portugal[J]. Mathematical Biosciences and Engineering, 2022, 19(1): 936-952. doi: 10.3934/mbe.2022043
Table 3.
Introduction and lifting of NPI adopted in Portugal, dates and descriptions. Lockdown refers to a mandatory stay-at-home order. In Portugal this refers to a declaration of "state-of-emergency" by the Portuguese government to provide a response to a national crisis. This state allows the implementation of severe measures to fight disease spread. "state of contingency" refers to the introduction of milder measures and "state of calamity" corresponds to a state in between contingency and emergency.
date
description
2020-03-12
announcement of schools closure
2020-03-16
closure of schools
2020-03-18
lockdown ("state-of-emergency") announcement
2020-03-22
lockdown goes into effect
2020-04-28
announcement of lockdown phase-out
2020-05-04
first wave of lockdown phase-out
2020-05-18
second wave of lockdown phase-out
2020-06-01
third wave of lockdown phase-out
2020-09-15
"state of contingency" goes into effect
2020-10-15
"state of calamity" goes into effect
2020-10-28
outdoor obligatory use of mask
2020-11-04
lockdown on weekends for counties above 480/100, 000 incidence
lockdown on weekends for counties above 480/100, 000 incidence
2020-11-09
"state of emergency"
2020-12-24
relaxation of measures during Christmas
2020-01-15
lockdown ("state of emergency")
Period P5
Period P6
βpre
0.2575
0.3591
βpos
0.3530
0.6047
tr
67
130
Figure 1. Schematic diagram of the COVID-19 vaccination model
Figure 2. Fitting results for the proportion of confirmed cases out of the total number of infected cases over time, ρ(t)
Figure 3. (a) Number of confirmed cases: model results (continuous line), observed (dots); (b) Effective reproduction number, Rt; (c) 14-day cumulative incidence per 100, 000 inhabitants: reported cases by the DGS (blue curve), model results (black curve)
Figure 4. Coverage vaccination in the Portuguese population: the asterisks correspond to the proportion of the vaccinated population according the Portuguese vaccination plan and the curve corresponds to the vaccination coverage given by Eq (2.6)
Figure 5. Logistic function Eq (3.2). Blue curve: x0 = 857; red curve: x0 = 1714
Figure 6. Vaccination model results. (a) Confirmed cases (b) Transmissibility index value, Rt. Portuguese data on reported cases by DGS (black dots). Scenario: S1 (blue line), S2 (red line) and S3 (black line)
Figure 7. Vaccinated (continuous lines) and non-vaccinated (dashed lines) cases for the 3 scenarios: S1 (blue line), S2 (red line) and S3 (black line)
Figure 8. NPIs intensity for the different scenarios: S1 (blue line), S2 (red line) and S3 (black line)


 DownLoad: